

Spatial distribution of Arctic tidal dynamics and analysis of tidal wave propagation characteristics
-
摘要: 北极因其丰富的矿产能源、航道资源和独特的地缘政治格局,成为全球关注的战略要地,研究北极海域的潮汐动力特征是理解其环境格局与资源开发潜力的关键。本研究基于Arc5km2018北极潮汐模型和ArcTiCA潮汐数据集,采用海洋学统计方法对北极北冰洋海域的主要潮汐特征和潮波传播规律进行了分析。结果表明,北冰洋海域以半日潮为主,M2分潮最显著,振幅可达1.2 m,中央海域振幅则较小(不超过0.1 m)。近岸和群岛区域受浅水分潮影响,潮不对称系数绝对值增大至0.2以上。由于复杂的地形和岸线,北冰洋存在多个逆时针旋转无潮点和多股潮波汇合形成的潮波辐合区,潮波主要由挪威海向巴伦支海、由格陵兰海分别向东西伯利亚海、楚科奇海和帕里群岛传播,传播速度一般不超过200 m/s且与水深的平方根正相关,振幅梯度绝对值一般不超过5 × 10−3 km−1。本研究为北极地区的综合治理和资源开发提供了重要数据支撑。Abstract: The Arctic has become a global strategic focal point due to its rich mineral resources, navigational routes, and unique geopolitical landscape. Understanding the tidal dynamics in Arctic waters is key to assessing its environmental patterns and resource development potential. This study analyzes the primary tidal characteristics and tidal wave propagation in the Arctic Ocean using oceanographic statistical methods, based on the Arc5km2018 Arctic tidal model and the ArcTiCA tidal dataset. The results show that semi-diurnal tides dominate the region, with the M2 tidal constituent being the most significant, reaching amplitudes of up to 1.2 m, while the central areas exhibit much smaller amplitudes (less than 0.1 m). In coastal and archipelago regions, shallow-water tides significantly influence tidal asymmetry, with the absolute value of the tidal asymmetry coefficient exceeding 0.2. Due to complex topography and coastlines, multiple counterclockwise amphidromic points and tidal convergence zones, formed by the confluence of various tidal waves, are present in the Arctic. Tidal waves primarily propagate from the Norwegian Sea into the Barents Sea, and from the Greenland Sea toward the East Siberian Sea, Chukchi Sea, and the Parry Archipelago, with propagation speeds generally not exceeding 200 m/s, and being positively correlated with the square root of water depth. The amplitude gradient is generally below 5 × 10⁻³ km−1. This study provides critical data to support the integrated management and resource development of the Arctic region.
-
Key words:
- harmonic constants /
- tidal types /
- tidal wave propagation /
- tidal asymmetry /
- propagation speed
-
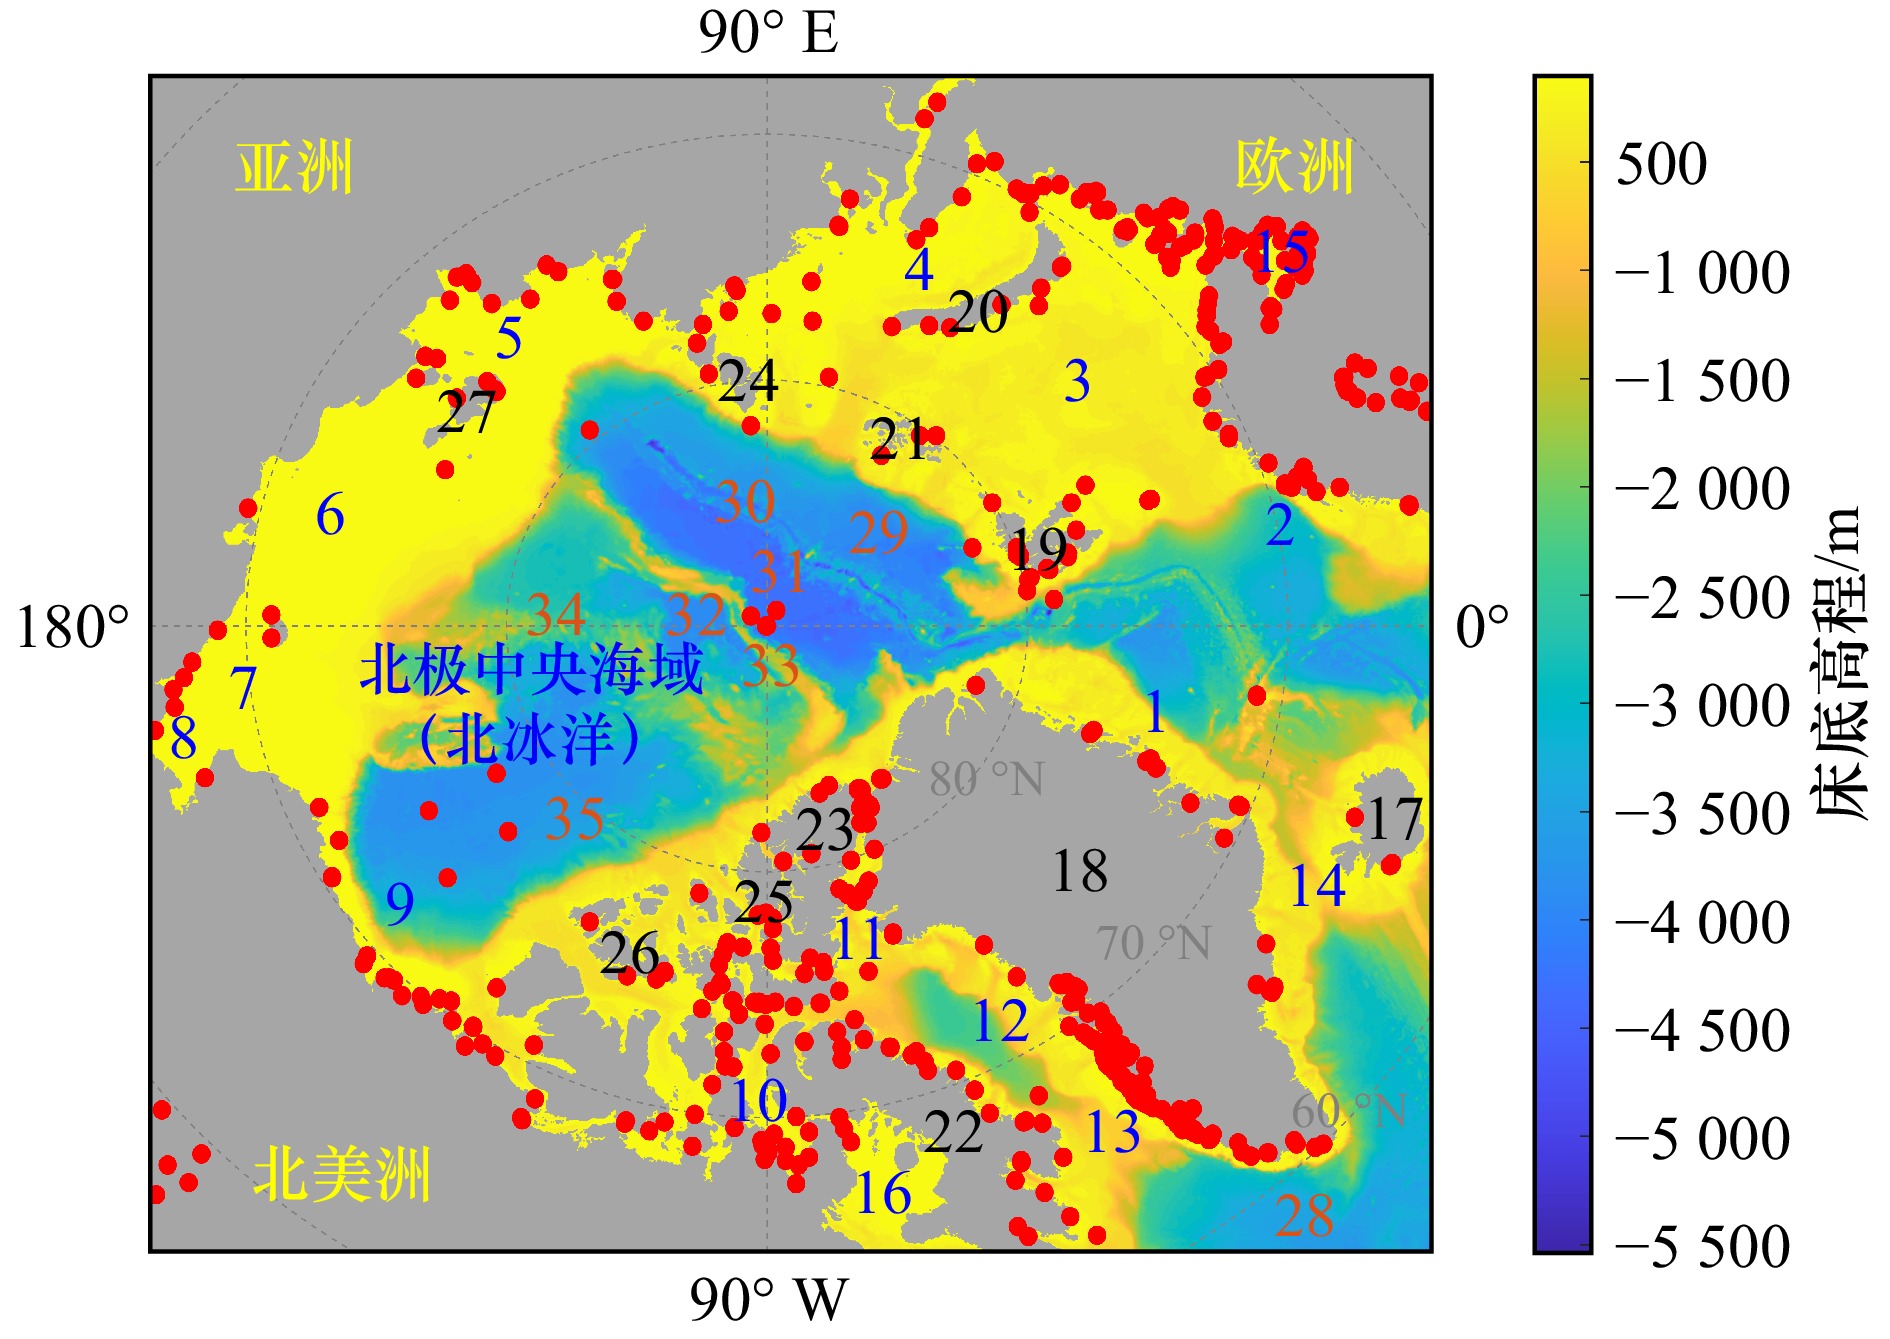
图 1 北极北冰洋及主要边缘海、岛屿群及海湾
图中红色圆圈为验潮站,蓝色标号为海域、海湾或海峡,黑色标号为海岛,橙色标号为海底地形:1:格陵兰海,2:挪威海,3:巴伦支海,4:喀拉海,5:拉普捷夫海,6:东西伯利亚海,7:楚科奇海,8:白令海峡,9:波弗特海,10:布西亚湾,11:史密斯海峡,12:巴芬湾,13:戴维斯海峡,14:丹麦海峡,15:白海,16:福克斯湾,17:冰岛,18:格陵兰岛,19:斯瓦尔巴群岛,20:新地岛,21:法兰士约瑟夫群岛,22:巴芬岛,23:艾尔斯米尔岛,24:北地群岛,25:伊丽莎白女王群岛,26:帕里群岛,27:安茹群岛(新西伯利亚群岛),28:拉布拉多海盆,29:南森海盆,30:南森海底山脉,31:欧亚海盆,32:马卡罗夫海盆,33:罗蒙诺索夫海岭,34:门捷列夫海岭,35:加拿大海盆
Fig. 1 Arctic sea area and major marginal seas, island groups, and bays
The red circle in the figure represents the tide gauge station, the blue label represents the sea area, bay or strait, the black label represents the islands, and the orange label represents the underwater terrain: 1: Greenland Sea, 2: Norwegian Sea, 3: Barents Sea, 4: Kara Sea, 5: Laptev Sea, 6: East Siberian Sea, 7: Chukchi Sea, 8: Bering Strait, 9: Beaufort Sea, 10: Busia Bay, 11: Smith Strait, 12: Baffin Bay, 13: Davis Strait, 14: Denmark Strait, 15: White Sea, 16: Fox Bay, 17: Iceland, 18: Greenland, 19: Svalbard Archipelago, 20: Novaya Zemlya, 21: Franz Josef Archipelago, 22: Baffin Island, 23: Els Mir Island, 24: Northern Land Islands, 25: Queen Elizabeth Islands, 26: Parry Islands, 27: Anjou Islands (Novosibirsk Islands), 28: Labrador Basin, 29: Nansen Basin, 30: Nansen Mountain Range, 31: Eurasian Basin, 32: Makarov Basin, 33: Lomonosov Ridge, 34: Mendeleev Ridge, 35: Canadian Basin

图 2 北冰洋海域4大分潮同潮图
a. M2分潮同潮图,b. S2分潮同潮图,c. K1分潮同潮图,d. O1分潮同潮图
Fig. 2 The cotidal charts of the four major tidal components in the Arctic Sea area
a. The cotidal chart of M2, b. the cotidal chart of S2, c. the cotidal chart of K1, d. the cotidal chart of O1
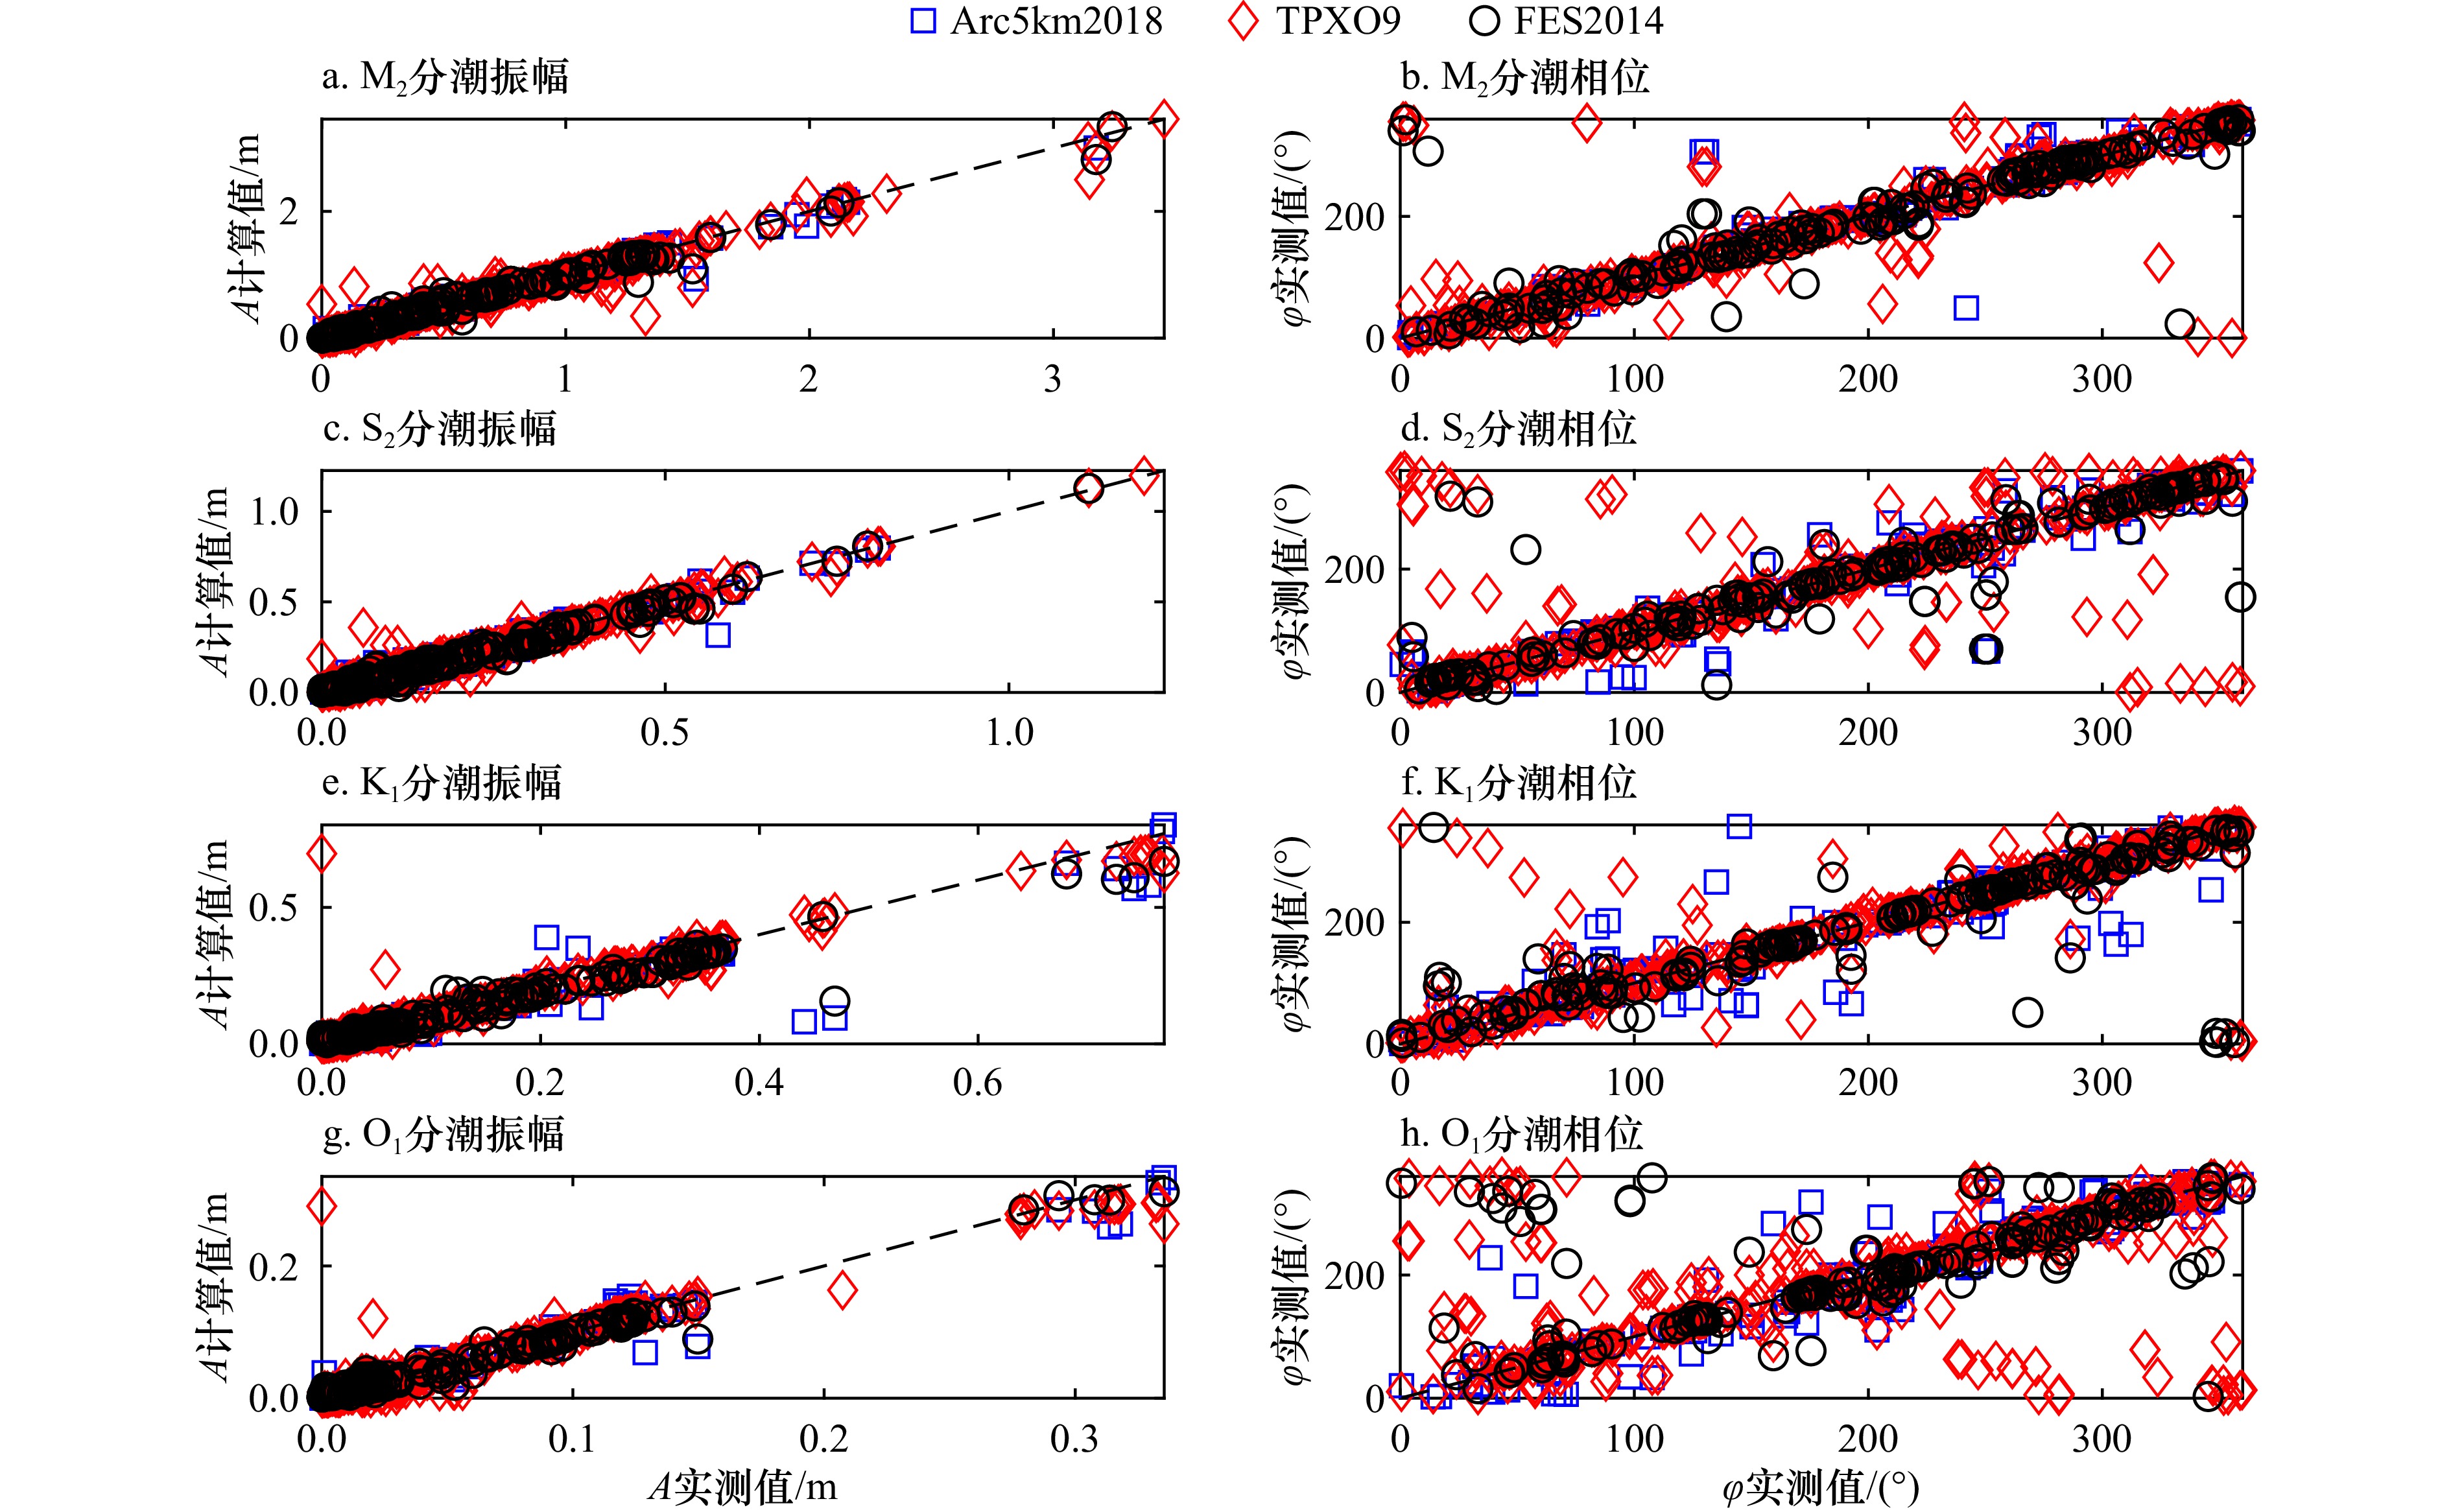
图 3 Arc5km2018北极潮汐模型、TPXO9模型和FES2014模型与ArcTiCA北极潮汐数据集站点率定验证比较
a. M2分潮振幅;b. M2分潮相位;c. S2分潮振幅;d. S2分潮相位;e. K1分潮振幅;f. K1分潮相位;g. O1分潮振幅;h. O1分潮相位
Fig. 3 Comparison of tidal properties between the Arc5km2018 Arctic Tidal Model, TPXO9 and FES2014 Model, and the ArcTiCA Arctic Tidal Dataset
a. M2 tidal amplitude; b. M2 tidal phase; c. S2 tidal amplitude; d. S2 tidal phase; e. K1 tidal amplitude; f. K1 tidal phase; g. O1 tidal amplitude; h. O1 tidal phase

图 5 北极海区主要半日分潮的潮波传播路径(箭头指示方向表示传播路径)
a. M2分潮潮波传播路径,b. S2分潮潮波传播路径
Fig. 5 The propagation paths of the main semi-diurnal tides in the Arctic sea area (with directions indicated by the arrows)
a. The propagation path of M2, b. the propagation path of S2

图 6 M2分潮、S2分潮沿传播路径传播速度的变化
a−d分别为挪威海传向巴伦支海、格陵兰海传向东西伯利亚海、格陵兰海传向楚科奇海、格陵兰海传向帕里群岛的潮波传播速度
Fig. 6 The variation of propagation speed along the propagation path of M2 and S2 tidal waves
a−d are the propagation velocities of tidal waves from the Norwegian Sea to the Barents Sea, from the Greenland Sea to the East Siberian Sea, from the Greenland Sea to the Chukchi Sea, and from the Greenland Sea to the Parry Islands, respectively

图 7 M2分潮、S2分潮沿传播路径潮波振幅及振幅梯度的变化
a、c分别为M2分潮的振幅和振幅梯度,b、d分别为S2分潮的振幅和振幅梯度
Fig. 7 The variation of tidal wave amplitude and amplitude gradient along the propagation path of M2 and S2 tidal waves
a and c represent the amplitude and amplitude gradient of the M2 component, b and d represent the amplitude and amplitude gradient of the S2 component

图 8 北冰洋海域潮汐不对称空间分布特征
a、b、c分别为M2-M4组合、M2-S2-MS4组合、K1-O1-M2组合的潮不对称系数β的空间分布,d为潮不对称主要贡献组合的空间分布,e为总潮汐偏度γN的空间分布
Fig. 8 The spatial distribution characteristics of tidal asymmetry in the Arctic sea area
a, b and c represent the spatial distribution of the tidal misalignment coefficient β for the M2-M4 combination, M2-S2-MS4 combination and K1-O1-M2 combination, d represents the spatial distribution of the main contributing combination to tidal misalignment, and e represents the spatial distribution of the total tidal skewness γN in the Arctic Sea area

图 9 M2分潮、S2分潮传播速度的沿程变化与传播路径沿程的水深变化
a−d分别为挪威海传向巴伦支海、格陵兰海传向东西伯利亚海、格陵兰海传向楚科奇海、格陵兰海传向帕里群岛的潮波传播速度和沿程水深变化
Fig. 9 The variation of propagation speed of M2 and S2 and water depth along the propagation path
a−d represent the tidal wave propagation speed and depth changes along the way from the Norwegian Sea to the Barents Sea, from the Greenland Sea to the East Siberian Sea, from the Greenland Sea to the Chukchi Sea, and from the Greenland Sea to the Parry Islands, respectively
表 1 Arc5km2018北极潮汐模型、TPXO9模型和FES2014模型与ArcTiCA北极潮汐数据集站点数据的相关系数及均方根误差对比
Tab. 1 Comparison of correlation coefficients and root mean square errors between the Arc5km2018 Arctic Tidal Model, TPXO9 and FES2014 Model, and ArcTiCA Arctic Tidal Dataset site data
分潮 模型 振幅R² 振幅RMSE/m 相位R² 相位RMSE/(°) M2 Arc5km2018 0.99 0.064 0.98 24 TPXO9 0.98 0.101 0.90 50 FES2014 0.99 0.075 0.89 50 S2 Arc5km2018 0.98 0.029 0.97 28 TPXO9 0.99 0.029 0.81 67 FES2014 0.99 0.026 0.90 48 K1 Arc5km2018 0.96 0.043 0.95 34 TPXO9 0.97 0.038 0.90 45 FES2014 0.98 0.033 0.77 67 O1 Arc5km2018 0.98 0.011 0.95 34 TPXO9 0.96 0.017 0.63 83 FES2014 0.99 0.010 0.60 79  下载: 导出CSV
-
[1] 康文中. 大国博弈下的北极治理与中国权益[D]. 北京: 中共中央党校, 2012.Kang Wenzhong. Arctic governance and China’s rights and interests under great power competition[D]. Beijing: Party School of the Central Committee of CPC, 2012. [2] 史佳卉. 北极资源的开发与利用[J]. 湖南农机, 2012, 39(1): 137−138.Shi Jiahui. Arctic resource development and utilization[J]. Hunan Agricultural Machinery, 2012, 39(1): 137−138. [3] 于立伟, 王俊荣, 王树青, 等. 我国极地装备技术发展战略研究[J]. 中国工程科学, 2020, 22(6): 84−93.Yu Liwei, Wang Junrong, Wang Shuqing, et al. Development strategy for Polar equipment in China[J]. Strategic Study of Chinese Academy of Engineering, 2020, 22(6): 84−93. [4] 胡冰, 罗文俊, 殷华兵. 我国北极航运发展需求浅析[J]. 航海技术, 2022(5): 76−79.Hu Bing, Luo Wenjun, Yin Huabing. Analysis on the development demand of China’s Arctic shipping[J]. Marine Technology, 2022(5): 76−79. [5] Defant A. Physical Oceanography of Vol Ⅱ[M]. New York: Pregamon Press, 1960: 417−419. [6] 郑文振, 陈福年, 陈新忠. 台湾海峡的潮汐和潮流[J]. 台湾海峡, 1982, 1(2): 1−4.Zheng Wenzhen, Chen Funian, Chen Xinzhong. Tides and tidal currents in the Taiwan Strait[J]. Taiwan Strait, 1982, 1(2): 1−4. [7] 于宜法, 刘兰, 郭明克. 海平面上升导致渤、黄、东海潮波变化的数值研究Ⅱ——海平面上升后渤、黄、东海潮波的数值模拟[J]. 中国海洋大学学报, 2007, 37(1): 7−14.Yu Yifa, Liu Lan, Guo Mingke. Numerical research on tidal waves changes due to mean-sea-level rise in the Bohai Sea, the Huanghai Sea and the East China Sea Ⅱ: Numerical modeling of tidal waves after mean-sea-level rise in the areas[J]. Periodical of Ocean University of China, 2007, 37(1): 7−14. [8] 梁慧迪, 匡翠萍. 岸线变化及海平面上升对渤海潮波运动影响研究[J]. 水动力学研究与进展, 2021, 36(3): 462−470.Liang Huidi, Kuang Cuiping. Impacts of coastline changes and sea level rise on tides in the Bohai Sea[J]. Journal of Hydrodynamics, 2021, 36(3): 462−470. [9] 叶安乐, 梅丽明. 渤黄东海潮波数值模拟[J]. 海洋与湖沼, 1995, 26(1): 63−70. doi: 10.3321/j.issn:0029-814X.1995.01.011Ye Anle, Mei Liming. Numerical modelling of tidal waves in the Bohai Sea, the Huanghai Sea and the East China Sea[J]. Oceanologia et Limnologia Sinica, 1995, 26(1): 63−70. doi: 10.3321/j.issn:0029-814X.1995.01.011 [10] Egbert G D, Bennett A F, Foreman M G G. TOPEX/POSEIDON tides estimated using a global inverse model[J]. Journal of Geophysical Research: Oceans, 1994, 99(C12): 24821−24852. doi: 10.1029/94JC01894 [11] Le Provost C, Genco M L, Lyard F, et al. Spectroscopy of the world ocean tides from a finite element hydrodynamic model[J]. Journal of Geophysical Research: Oceans, 1994, 99(C12): 24777−24797. doi: 10.1029/94JC01381 [12] 孙维康, 周兴华, 周东旭, 等. 南极海域潮汐模型研究进展及精度评定[J]. 极地研究, 2021, 33(1): 13−26.Sun Weikang, Zhou Xinghua, Zhou Dongxu, et al. Development and accuracy of tide models in Antarctica[J]. Chinese Journal of Polar Research, 2021, 33(1): 13−26. [13] Kowalik Z, Proshutinsky A Y. The Arctic ocean tides[M]//Johannessen O M, Muench R D, Overland J E. The Polar Oceans and Their Role in Shaping the Global Environment, Volume 85. Washington: American Geophysical Union, 1994, 85: 137−158. [14] Stammer D, Ray R D, Andersen O B, et al. Accuracy assessment of global barotropic ocean tide models[J]. Reviews of Geophysics, 2014, 52(3): 243−282. doi: 10.1002/2014RG000450 [15] Egbert G D, Erofeeva S Y. Efficient inverse modeling of barotropic ocean tides[J]. Journal of Atmospheric and Oceanic Technology, 2002, 19(2): 183−204. doi: 10.1175/1520-0426(2002)019<0183:EIMOBO>2.0.CO;2 [16] Padman L, Erofeeva S. A barotropic inverse tidal model for the Arctic Ocean[J]. Geophysical Research Letters, 2004, 31(2): L02303. [17] Green J A M, Huber M. Tidal dissipation in the early Eocene and implications for ocean mixing[J]. Geophysical Research Letters, 2013, 40(11): 2707−2713. doi: 10.1002/grl.50510 [18] Wilmes S B, Green J A M. The evolution of tides and tidal dissipation over the past 21, 000 years[J]. Journal of Geophysical Research: Space Physics, 2014, 119(7): 4083−4100. [19] Pickering M D, Horsburgh K J, Blundell J R, et al. The impact of future sea-level rise on the global tides[J]. Continental Shelf Research, 2017, 142: 50−68. doi: 10.1016/j.csr.2017.02.004 [20] Peterson R, Whitworth J D. A reexamination of the dividend threshold[J]. Academy of Business Research Journal, 2013, 3. [21] Erofeeva S, Egbert G. Arc5km2018: Arctic Ocean inverse tide model on a 5 kilometer grid[EB/OL]. [2023−10−23]. https://doi.org/10.18739/A21R6N14K. [22] Hart-Davis M, Howard S L, Ray R, et al. Arctic tidal constituent atlas (ArcTiCA): a database of tide elevation constituents for the Arctic region from 1800 through present day[EB/OL]. [2023−10−23]. https://arcticdata.io/catalog/view/doi:10.18739/A2VT1GR64. [23] 李翔. 北冰洋中层水的数值模拟研究[D]. 青岛: 中国海洋大学, 2013.Li Xiang. Numerical study on the Arctic intermediate water[D]. Qingdao: Ocean University of China, 2013. [24] Parkinson C L, Cavalieri D J. Arctic sea ice variability and trends, 1979−2006[J]. Journal of Geophysical Research: Oceans, 2008, 113(C7): C07003. [25] Comiso J C. Large decadal decline of the Arctic multiyear ice cover[J]. Journal of Climate, 2012, 25(4): 1176−1193. doi: 10.1175/JCLI-D-11-00113.1 [26] 李欣, 张月, 董琪. 北极海域水文特征变化研究进展[J]. 气象水文海洋仪器, 2022, 39(2): 39−44. doi: 10.3969/j.issn.1006-009X.2022.02.012Li Xin, Zhang Yue, Dong Qi. Research progress on the changes of hydrological characteristics in the Arctic waters[J]. Meteorological, Hydrological and Marine Instruments, 2022, 39(2): 39−44. doi: 10.3969/j.issn.1006-009X.2022.02.012 [27] Jakobsson M, Cherkis N, Woodward J, Coakley B, Macnab R. New grid of Arctic bathymetry aids scientists and mapmakers[J]. Eos Transactions, American Geophysical Union, 2000, 81(9): 89−96. doi: 10.1029/00EO00059 [28] Wang Heng, Zhang Ping, Hu Shuai, et al. Tidal regime shift in Lingdingyang Bay, the Pearl River Delta: An identification and assessment of driving factors[J]. Hydrological Processes, 2020, 34(13): 2878−2894. doi: 10.1002/hyp.13773 [29] Song Dehai, Wang Xiaohua, Kiss A E, et al. The contribution to tidal asymmetry by different combinations of tidal constituents[J]. Journal of Geophysical Research: Oceans, 2011, 116(C12): C12007. doi: 10.1029/2011JC007270 [30] Hart-Davis M G, Piccioni G, Dettmering D, et al. EOT20: A global ocean tide model from multi-mission satellite altimetry[J]. Earth System Science Data, 2021, 13(8): 3869−3884. doi: 10.5194/essd-13-3869-2021 [31] Pan Haidong, Xu Tengfei, Wei Zexun. A modified tidal harmonic analysis model for short-term water level observations[J]. Ocean Modelling, 2023, 186: 102251. doi: 10.1016/j.ocemod.2023.102251 [32] Edmonds D A, Caldwell R L, Brondizio E S, et al. Coastal flooding will disproportionately impact people on river deltas[J]. Nature Communications, 2020, 11(1): 4741. doi: 10.1038/s41467-020-18531-4 [33] Fang Jiayi, Nicholls R J, Brown S, et al. Benefits of subsidence control for coastal flooding in China[J]. Nature Communications, 2022, 13(1): 6946. doi: 10.1038/s41467-022-34525-w [34] Rueda A, Vitousek S, Camus P, et al. A global classification of coastal flood hazard climates associated with large-scale oceanographic forcing[J]. Scientific Reports, 2017, 7: 5038. doi: 10.1038/s41598-017-05090-w [35] Matthews H D, Wynes A S. Current global efforts are insufficient to limit warming to 1.5°C[J]. Science, 2022, 376(6600): 1404−1409. doi: 10.1126/science.abo3378 [36] Steele M, Morley R, Ermold W. PHC: a global ocean hydrography with a high-quality arctic ocean[J]. Journal of Climate, 2001, 14(9): 2079−2087. doi: 10.1175/1520-0442(2001)014<2079:PAGOHW>2.0.CO;2 -


计量
- 文章访问数: 529
- HTML全文浏览量: 239
- PDF下载量: 55
- 被引次数: 0
