

Determination of 15 trace elements in seawater by using inductively coupled plasma mass spectrometry with off-line separation and concentration
-
摘要: 基于自制的分离富集装置,使用Toyopearl AF-chelate 650M螯合树脂对海水中15种痕量元素(Al、Sc、V、Fe、Co、Ni、Cu、Zn、Ga、Cd、Nd、Pb、Bi、Th和U)进行了分离富集样品前处理技术方法的研究,优化了上样pH、清洗液的类型和用量、洗脱液类型和用量,并联合高分辨率电感耦合等离子质谱仪(HR-ICP-MS)进行准确的测定。结果表明:8.92 mL的海水样品与醋酸−醋酸铵缓冲溶液以1∶1等比例混合(上样pH = 5.25)后加载到螯合树脂上,然后使用8.0 mL Milli-Q水清洗基体杂质,最后使用2.25 mL 0.8 mol/L HNO3洗脱。洗脱液加入Rh内标后使用HR-ICP-MS测定。方法全流程空白为0.27(Cd)~52.5(Al)pg,方法检出限为0.06(Cd)~1.67(Zn)ng/L,在0.010~50.0 μg/L浓度范围内线性关系良好(R2 > 0.999)。该方法通过分析标准海水GBW(E)080040和国际标准海水CASS-6进行了验证,GBW(E)080040中Cu、Zn、Cd、Pb的测定值均落在标准值范围内,相对误差绝对值 < 4.1%,相对标准偏差(RSD) < 4.1%,15种痕量元素的加标回收率在92.6%~107%之间。CASS-6的测定结果与认证值和报告值一致,RSD < 6.4%。本方法前处理过程简单快速、基质去除率高、检出限低、准确度高、精密度好,适用于天然淡水、饮用水、河口近岸以及大洋海水中15种痕量元素的同时准确测定。
-
关键词:
- 痕量元素 /
- 螯合树脂 /
- 固相萃取 /
- 高分辨电感耦合等离子体质谱法 /
- 海水
Abstract: A self-developed separation and enrichment device was employed to investigate the pretreatment method for isolating and concentrating 15 trace elements (Al, Sc, V, Fe, Co, Ni, Cu, Zn, Ga, Cd, Nd, Pb, Bi, Th, and U) from seawater using Toyopearl AF-Chelate 650M chelating resin. Key parameters including sample loading pH, washing solution composition and volume, and eluent type and volume were optimized. High-resolution inductively coupled plasma mass spectrometry (HR-ICP-MS) was used for accurate determination. The results demonstrated that when 8.92 mL of seawater sample was mixed with acetic acid-ammonium acetate buffer solution at a 1:1 ratio (loading pH = 5.25) and loaded onto the resin, matrix impurities could be effectively removed by washing with 8.0 mL of Milli-Q water. After matrix removal, the adsorbed trace elements were quantitatively recovered by elution with 2.25 mL of 0.8 mol/L HNO3. Rh was added as an internal standard to the eluent prior to HR-ICP-MS analysis. Method blanks ranged from 0.27 pg (Cd) to 52.5 pg (Al), with method detection limits between 0.06 ng/L (Cd) and 1.67 ng/L (Zn). Excellent linearity (R2 > 0.999) was achieved across the concentration range of 0.01−50.0 μg/L. The method was validated using certified reference materials GBW(E)080040 and CASS-6. For GBW(E)080040, measured concentrations of Cu, Zn, Cd and Pb agreed well with certified values (relative error < 4.1%, RSD < 4.1%), with spike recoveries of 92.6%−107% for all 15 elements. Results for CASS-6 also showed good agreement with certified and reported values (RSD < 6.4%). This method features simple and rapid pretreatment, efficient matrix removal, low detection limits, high accuracy and good precision, making it suitable for simultaneous determination of trace elements in various water matrices including natural freshwater, drinking water, estuarine and marine waters. -

图 1 痕量元素分离富集装置示意图
四通道选择阀(V1、V2)、六通道切换阀(V3、V4)、蠕动泵(P1)、真空泵(P2)、富集柱(100 × 2.1 mm ID)、清洁柱(50 × 4 mm ID)、定量环(8.92 mL)、流路管线(0.80 mm ID)、泵管(0.76 mm ID)
Fig. 1 The diagram of trace elements separation and enrichment device
Four-channel selection valve (V1, V2), six-channel switching valve (V3, V4), peristaltic pump (P1), vacuum pump (P2), enrichment column (100 × 2.1 mm ID), cleaning column (50 × 4 mm ID), quantitative ring (8.92 mL), flow line (0.80 mm ID), pump pipe (0.76 mm ID)
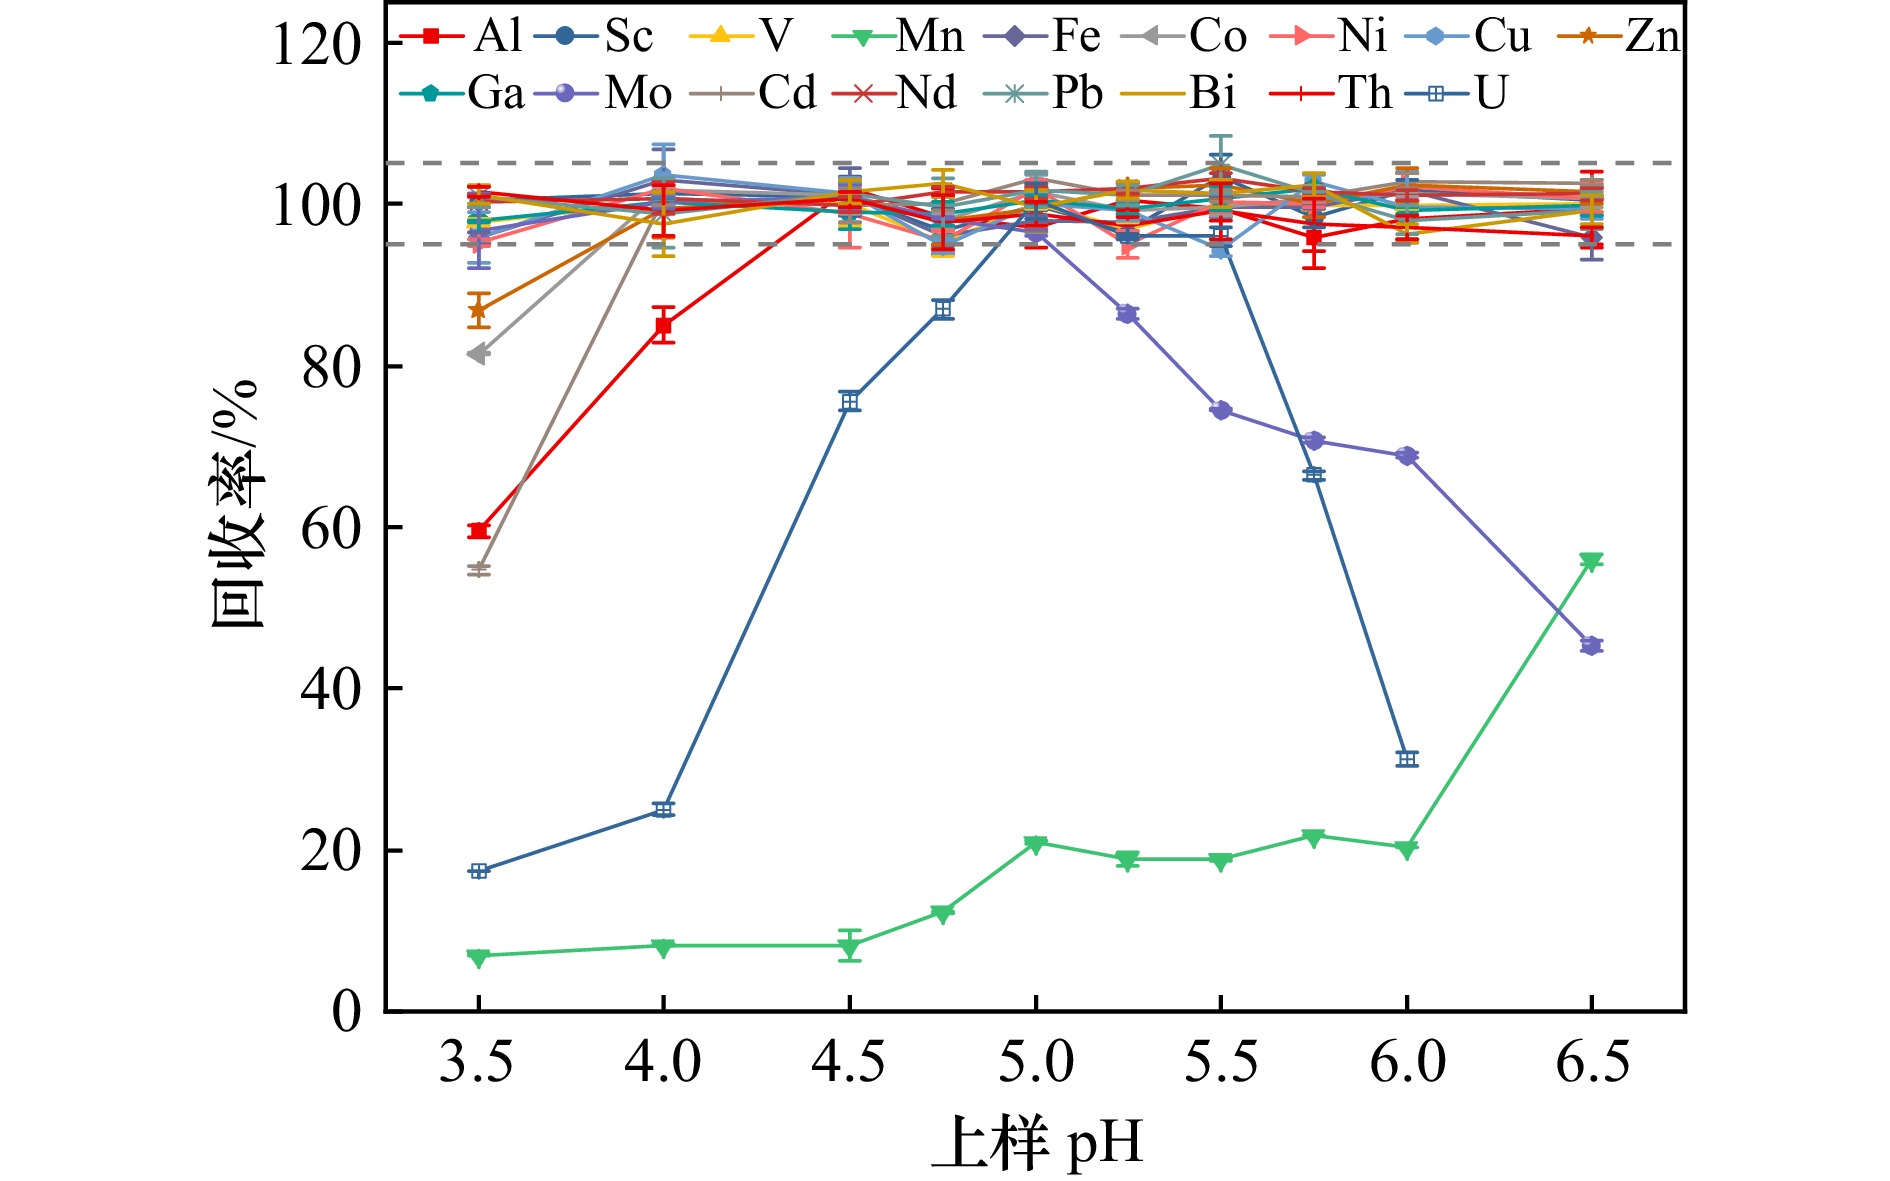
图 3 上样pH对痕量元素分离富集效率的影响
样品:1.0 μg/L标准样品,洗脱液:2.0 mL 1.0 mol/L HNO3
Fig. 3 Effect of different sample loading pH on the separation and enrichment efficiency of trace elements
Sample: 1.0 μg/L standard sample, eluate solution: 2.0 mL 1.0 mol/L HNO3

图 4 不同洗脱液对痕量元素的洗脱效率的影响
样品:1.0 μg/L的标准样品,上样pH = 5.25 ± 0.10,清洗液:4.0 mL缓冲溶液2
Fig. 4 Effect of different eluates on the elution efficiency of trace elements
Sample: 1.0 μg/L standard sample, loading sample pH = 5.25 ± 0.10, cleaning solution: 4.0 mL of buffer solution 2
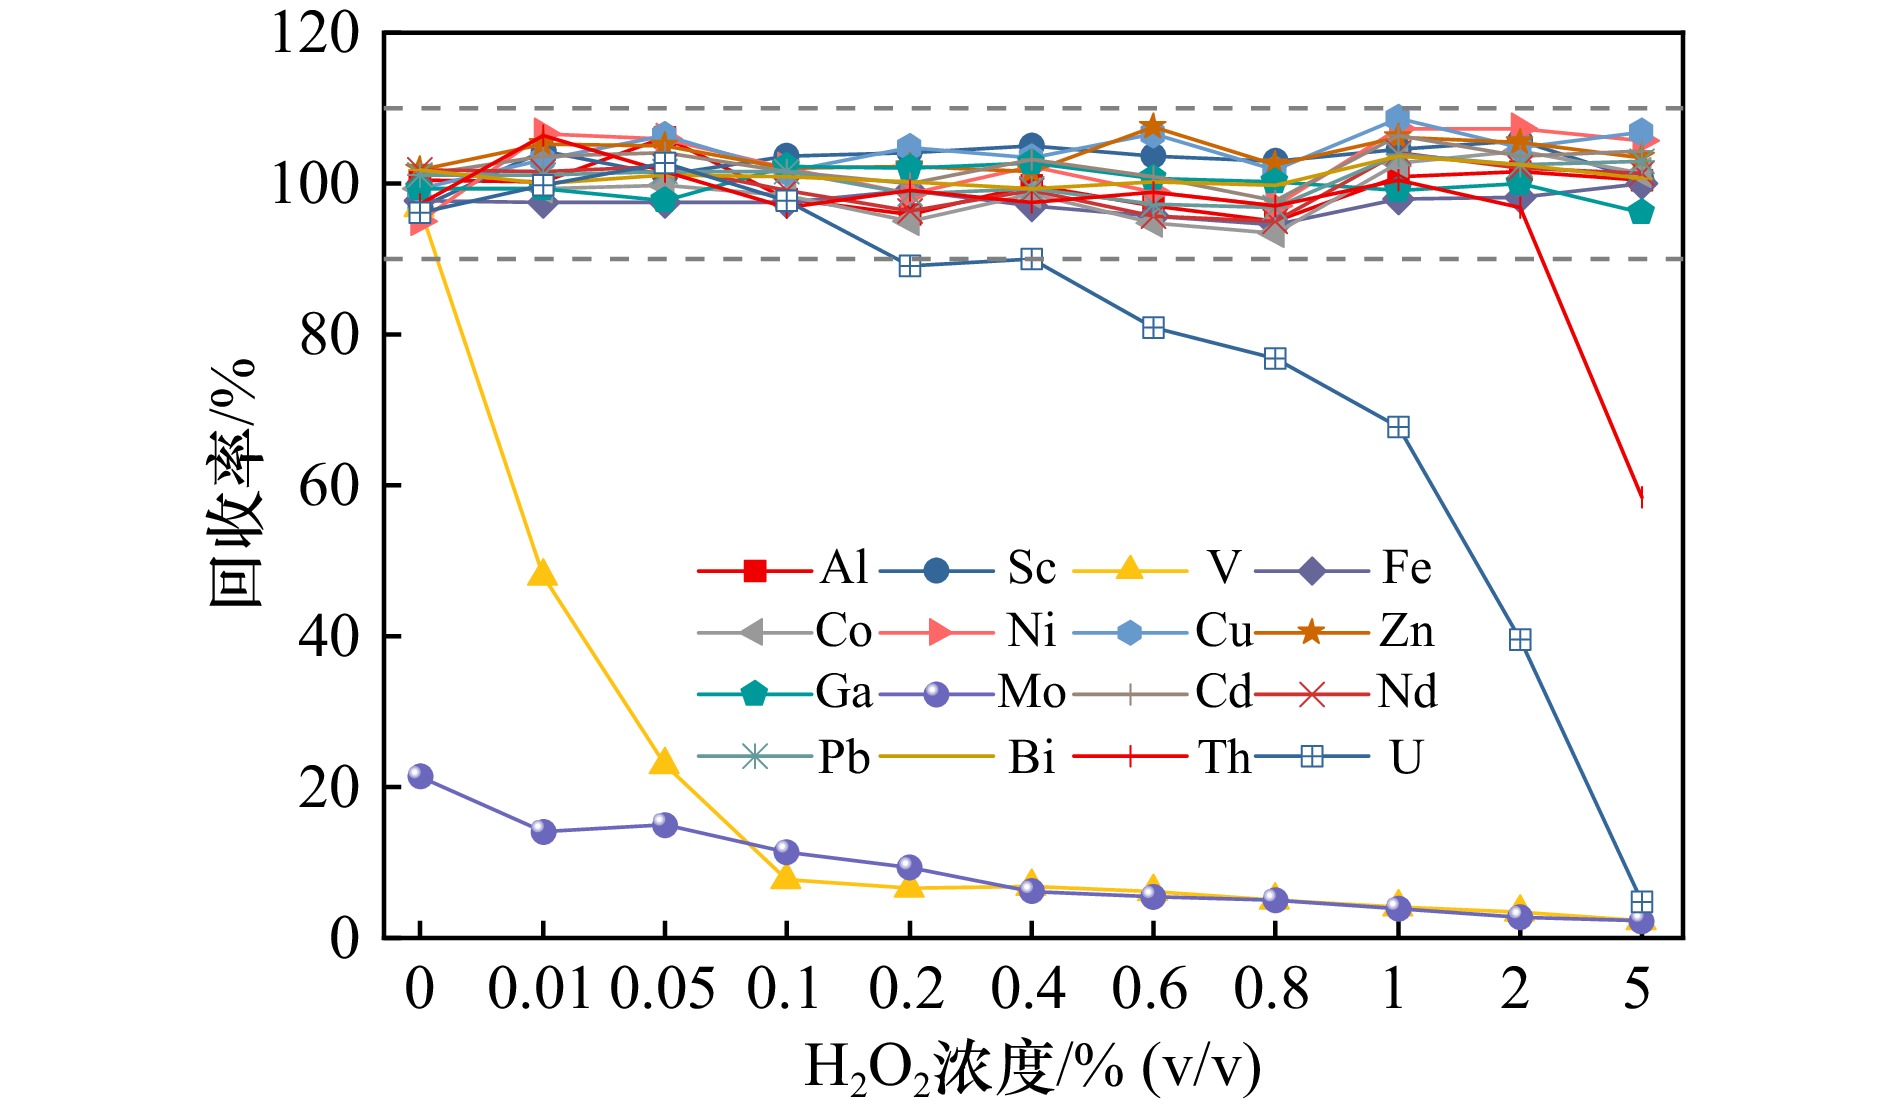
图 5 清洗液H2O2浓度对15种痕量元素回收率的影响
样品:1.0 μg/L标准样品,上样pH = 5.25 ± 0.10,清洗液用量:3.0 mL,洗脱液:2.0 mL 0.8 mol/L HNO3
Fig. 5 Effect of H2O2 concentration on recovery of 15 trace elements
Sample: 1.0 μg/L standard sample, loading sample pH = 5.25 ± 0.10, cleaning solution is 3.0 mL, eluate solution: 2.0 mL 0.8 mol/L HNO3

图 6 Milli-Q水用量对实际海水样品中Mo和基体元素清洗效果的影响
Fig. 6 Effect of Milli-Q water dosage on the cleaning effect of Mo and matrix elements in actual seawater samples
表 1 痕量元素分离富集实验流程
Tab. 1 Experimental process of sample trace elements enrichment and separation
实验步骤 阀1 阀2 阀3 阀4 泵1 泵2 时间/s 柱条件化,预填充样品 3 1 B B 开 开 120 上样 2 1 A B 开 关 536 冲洗 1 1 A B 开 关 240 洗脱 1 4 A A 开 关 135 清洁 1 4 A A 开 关 120 注:样品处理过程中蠕动泵流速为1.0 mL·min−1。 Note: The flow rate of peristaltic pump during sample processing is 1.0 mL·min−1.  下载: 导出CSV
表 2 Element 2仪器的工作参数
Tab. 2 The operating conditions of the Element 2 instrument
仪器参数 参数值 射频功率/W 1300 冷却气流速/(L·min−1) 16.00 辅助气流速/(L·min−1) ~1.00 样品气流速/(L·min−1) 1.25~1.27 锥 镍锥 雾化器流速/(μL·min−1) ~100 扫描类型 E–scan 扫描步长 30 扫描次数 3 × 5 质量窗口 100% 积分窗口 50% 选择
同位素LR:98Mo、111Cd、146Nd、208Pb、209Bi、232Th、238U、103Rh
MR:27Al、45Sc、51V、56Fe、59Co、60Ni、63Cu、66Zn、69Ga、103Rh
下载: 导出CSV
表 3 不同清洗液对16种痕量元素回收率的影响(n = 3)
Tab. 3 Effect of different cleaning solutions on the recovery of 16 trace elements (n = 3)
超纯水 缓冲溶液2 0.05% H2O2 Al 103.5 ± 0.4 103.6 ± 2.5 101.3 ± 0.4 Sc 98.8 ± 1.9 98.0 ± 0.5 99.4 ± 0.5 V 97.8 ± 0.5 100.1 ± 0.7 24.0 ± 0.3 Fe 99.1 ± 2.6 97.8 ± 0.8 98.7 ± 0.8 Co 96.3 ± 1.3 96.8 ± 1.5 99.8 ± 0.5 Ni 96.7 ± 0.1 96.0 ± 2.2 92.9 ± 0.5 Cu 100.2 ± 1.7 98.1 ± 1.9 99.6 ± 1.1 Zn 100.0 ± 0.3 97.5 ± 2.7 96.2 ± 0.7 Ga 97.9 ± 1.9 96.9 ± 1.0 98.0 ± 0.6 Mo 19.1 ± 0.8 96.8 ± 0.5 17.0 ± 0.1 Cd 98.2 ± 1.3 97.3 ± 2.3 94.8 ± 0.9 Nd 96.9 ± 1.4 97.6 ± 1.3 95.0 ± 0.9 Pb 100.5 ± 2.1 101.3 ± 0.9 98.0 ± 0.5 Bi 101.4 ± 2.8 101.8 ± 1.0 103.3 ± 0.1 Th 102.3 ± 3.3 94.4 ± 2.9 105.3 ± 0.7 U 97.5 ± 2.6 97.8 ± 1.0 94.5 ± 0.4 注:样品:1.0 μg/L的标准样品,上样pH = 5.25 ± 0.10,清洗液用量:6 mL,洗脱液:2 mL 0.8 mol/L HNO3。 Note: Sample: 1.0 μg/L standard sample, loading sample pH = 5.25 ± 0.10, cleaning solution: 6.0 mL, eluent: 2.0 mL 0.8 mol/L HNO3.
下载: 导出CSV
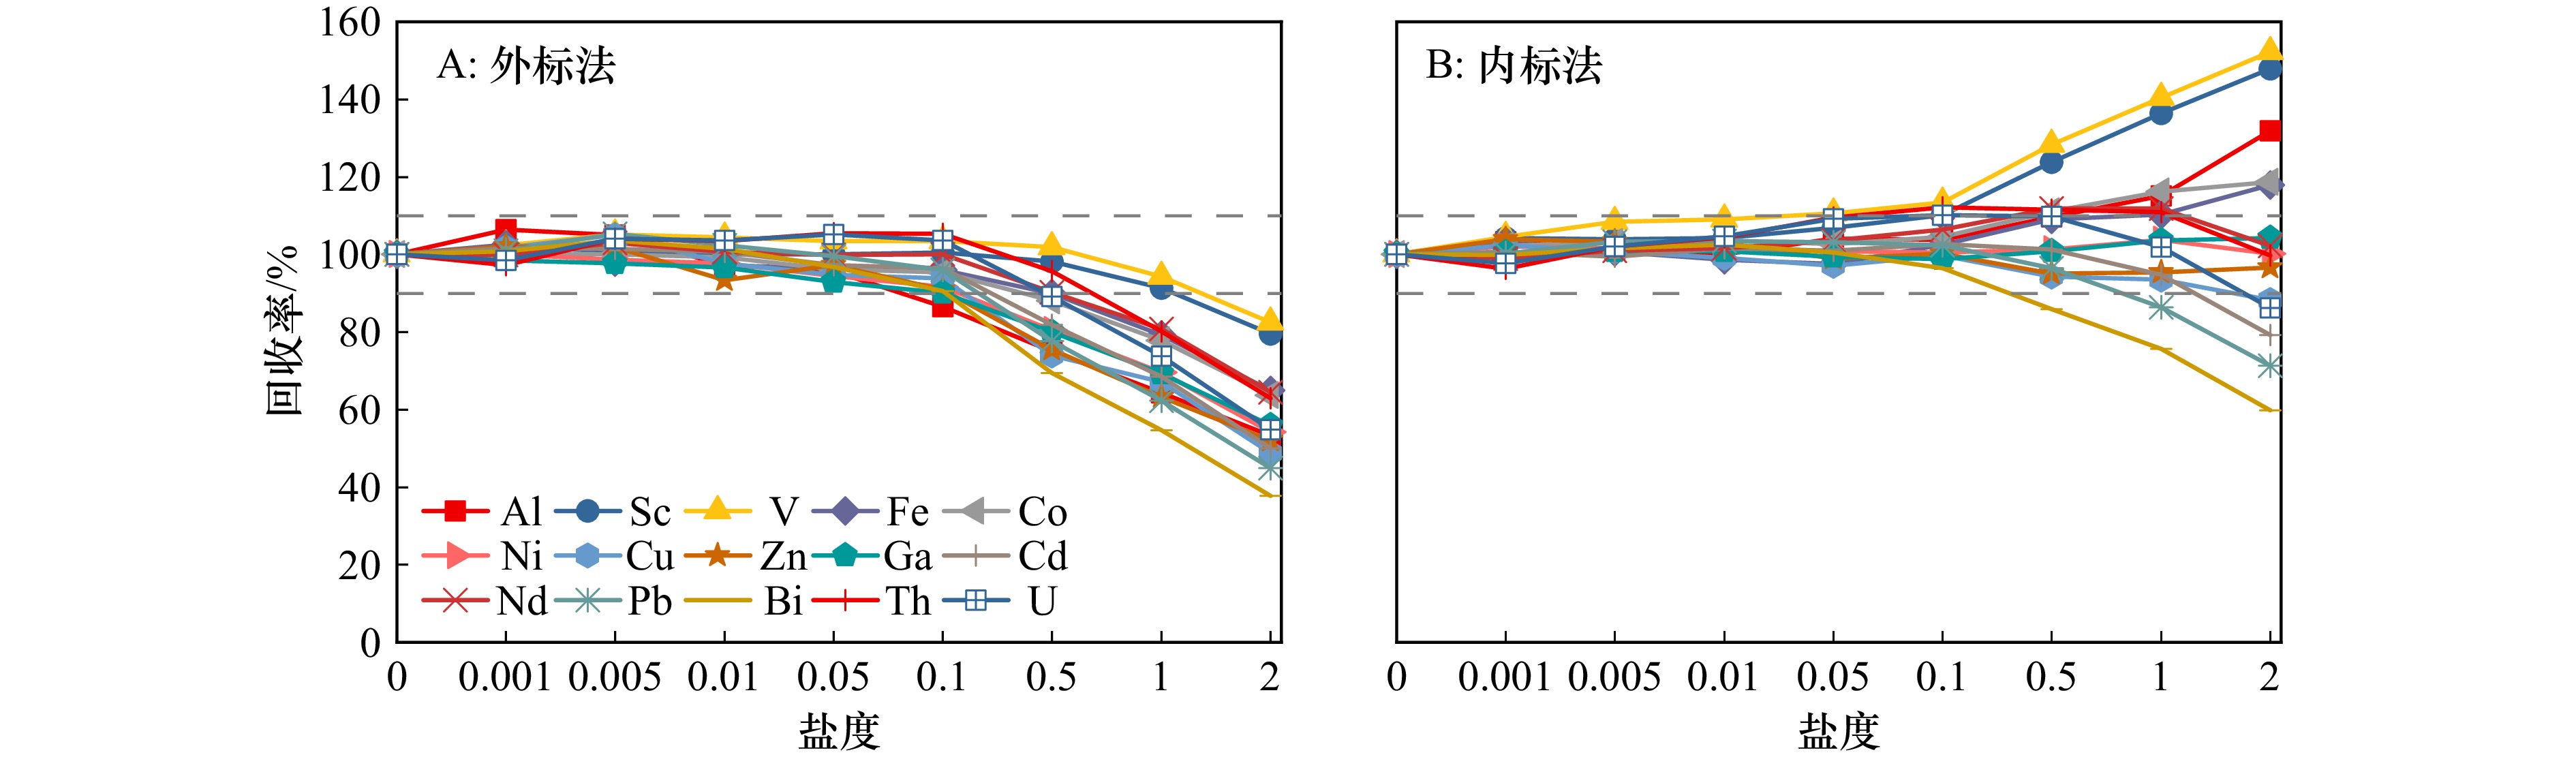
表 4 样品盐度对15种痕量元素分离富集效果的影响
Tab. 4 Effect of sample salinity on the separation and enrichment effect of 15 trace elements
0 4.5 9.0 17.9 35.8 Al 100.1 ± 1.7 100.9 ± 2.4 102.5 ± 5.7 93.0 ± 0.4 95.3 ± 1.6 Sc 99.6 ± 1.5 102.1 ± 0.8 105.0 ± 5.0 102.3 ± 0.4 103.7 ± 1.4 V 100.8 ± 1.1 105.3 ± 0.4 98.9 ± 1.8 106.5 ± 0.5 105.3 ± 0.4 Fe 98.5 ± 1.1 99.4 ± 1.4 104.5 ± 0.7 96.3 ± 0.9 96.1 ± 0.7 Co 101.4 ± 1.1 102.6 ± 0.7 105.2 ± 0.4 99.9 ± 0.2 100.4 ± 0.6 Ni 101.7 ± 0.6 102.3 ± 0.2 102.8 ± 2.0 98.2 ± 0.3 97.6 ± 0.8 Cu 101.1 ± 1.0 101.1 ± 0.5 103.8 ± 0.8 97.0 ± 0.2 99.7 ± 0.9 Zn 101.7 ± 1.7 103.8 ± 1.3 98.8 ± 4.0 103.5 ± 0.4 103.1 ± 0.5 Ga 96.0 ± 0.4 97.0 ± 0.6 103.7 ± 1.1 96.2 ± 0.4 95.1 ± 0.7 Cd 100.0 ± 0.1 105.8 ± 0.8 100.3 ± 2.2 105.8 ± 0.1 99.4 ± 0.5 Nd 100.2 ± 0.4 102.7 ± 0.1 101.8 ± 0.7 104.4 ± 0.5 103.7 ± 0.6 Pb 99.4 ± 1.4 100.8 ± 1.3 99.5 ± 0.3 98.6 ± 2.0 97.1 ± 0.9 Bi 100.6 ± 0.7 95.7 ± 1.5 97.3 ± 1.9 94.2 ± 1.4 93.8 ± 1.3 Th 103.8 ± 0.5 101.1 ± 2.1 96.6 ± 1.9 103.6 ± 0.5 99.9 ± 0.8 U 100.7 ± 2.7 98.5 ± 1.9 101.5 ± 4.8 100.5 ± 2.1 101.8 ± 1.4
下载: 导出CSV
表 5 15种痕量元素的定量限、线性关系、方法空白与检出限
Tab. 5 Quantitative limit, linear relation, method blank and detection limit of 15 trace elements
元素 仪器检出限/(ng·L−1) 仪器定量限/(ng·L−1) 线性方程 相关系数/R2 方法空白/pg(方法检出限/(ng·L−1)) 文献[18] 文献[19] 文献[21] 文献[13] 文献[26] 本研究 Al 2.86 9.53 Y = 0.5689x 0.9998 - - - - - 52.5(1.06) Sc 0.12 0.40 Y = 0.6789x 1.0000 - - - - - 1.34(0.33) V 0.06 0.19 Y = 0.6674x 1.0000 1.20(4.3) - - - - 1.69(0.23) Fe 0.46 1.53 Y = 0.7769x 1.0000 - - 156(1.18) 67.2(0.78) - 31.5(1.64) Co 0.02 0.06 Y = 0.8875x 1.0000 1.20(0.5) - 4.68(0.12) 1.20(0.01) 3.0(0.1) 1.16(0.22) Ni 2.52 8.40 Y = 0.1961x 1.0000 60.0(5.0) 80.0(6.0) 27.5(1.56) 468(5.0) 20(4.0) 2.23(0.23) Cu 0.10 0.32 Y = 0.4277x 1.0000 9.30(1.2) - 11.6(0.46) 84.0(3.3) 22(3.0) 4.55(0.42) Zn 2.41 8.03 Y = 0.0619x 1.0000 129(9.0) 190(28) 200(0.33) 68.0(2.0) 70(4.0) 39.4(1.67) Ga 0.84 2.81 Y = 0.5540x 1.0000 - - - - - 0.54(0.12) Cd 0.04 0.13 Y = 0.0900x 1.0000 3.30(0.06) 32.5(1.4) 5.04(0.06) 3.60(0.10) 0.40(0.06) 0.27(0.06) Nd 0.04 0.12 Y = 0.2478x 1.0000 - - - - - 0.45(0.14) Pb 0.07 0.24 Y = 0.8117x 0.9998 6.30(1.2) 16.0(1.0) 3.48(0.04) 8.40(0.12) 3.0(1.0) 1.61(0.24) Bi 0.002 0.005 Y = 1.2552x 0.9999 - - - - - 0.98(0.25) Th 0.005 0.020 Y = 0.8802x 1.0000 - - - - - 1.69(0.53) U 0.002 0.005 Y = 1.3462x 0.9999 - - - - - 1.61(0.54)
下载: 导出CSV
表 6 标准海水测定结果
Tab. 6 The determination results of the standard seawater
元素 GBW(E)080040 CASS-6 认证值/(μg·L−1)
(mean ± 1σ)测定值/(μg·L−1)
(mean ± 1σ, n = 6)相对误差/% 精密度/% 加标浓度/(μg·L−1) 加标回收率/%
(mean ± 1σ, n = 6)认证值/(μg·L−1)
(mean ± 1σ)测定值/(μg·L−1)
(mean ± 1σ, n = 3)精密度/% Al / 4.50 ± 0.06 / 1.3 0.50 105 ± 4.9 / / / Sc / 0.008 ± 0.0002 / 2.5 0.05 98.8 ± 1.3 / / / V / 1.63 ± 0.01 / 0.6 0.50 102 ± 2.0 0.50 ± 0.12 0.473 ± 0.005 1.1 Fe / 0.19 ± 0.01 / 5.3 0.05 104 ± 4.1 1.56 ± 0.12 1.53 ± 0.033 2.2 Co / 0.001 ± 0.0001 / 10.0 0.05 99.1 ± 1.9 0.067 ± 0.0052 0.063 ± 0.0002 0.3 Ni / 0.22 ± 0.01 / 4.5 0.05 97.4 ± 1.7 0.418 ± 0.04 0.402 ± 0.006 1.5 Cu 5.12 ± 0.41 5.33 ± 0.07 4.1 1.3 0.50 107 ± 2.8 0.53 ± 0.032 0.508 ± 0.004 0.8 Zn 71.75 ± 3.08 71.36 ± 2.95 –0.5 4.1 5.00 97.4 ± 5.8 1.27 ± 0.18 1.11 ± 0.01 0.1 Ga / 0.004 ± 0.0002 / 5.0 0.05 102 ± 1.5 / / / Cd 1.02 ± 0.08 1.00 ± 0.01 –2.7 1.0 0.05 103 ± 4.9 0.0217 ±0.0018 0.0208 ±0.0010 4.8 Nd / 0.007 ± 0.001 / 14.3 0.05 97.7 ± 5.4 0.004 0.0045 ±0.0001 2.2 Pb 10.25 ± 0.75 9.94 ± 0.26 –3.0 2.6 0.50 101 ± 2.5 0.0106 ± .0.0040.0109 ±0.0007 6.4 Bi / 0.005 ± 0.0006 / 12.0 0.05 102 ± 1.4 / / / Th / 0.006 ± 0.001 / 16.7 0.05 94.2 ± 7.3 / / / U / 2.71 ± 0.07 / 2.6 0.50 92.6 ± 6.2 2.92 ± 0.42 2.84 ± 0.05 1.8
下载: 导出CSV
表 7 实际样品的测定结果
Tab. 7 The determination results of trace elements in actual samples
元素 瓶装饮用水1 瓶装饮用水2 菲律宾海域海水 太平洋赤道海水 浓度/(ng·L−1) 精密度/% 浓度/(ng·L−1) 精密度/% 浓度/(ng·L−1) 精密度/% 加标浓度/(ng·L−1) 回收率/% 浓度/(ng·L−1) 精密度/% 加标浓度/(ng·L−1) 回收率
/%Al 165.15 1.5 55.54 4.4 1947.15 1.9 1000 95.3 80.60 1.7 100 96.4 Sc < 0.33 / < 0.33 / 5.42 7.6 100 96.0 < 0.33 / 100 96.2 V 250.93 2.8 8.11 1.9 1506.02 0.6 1000 105 1636.13 0.4 1000 102 Fe 48.29 7.7 6.51 2.7 26.36 4.0 100 102 127.88 1.0 100 98.7 Co 8.83 2.8 < 0.22 / 1.10 3.6 10.0 94.3 0.38 3.1 10.0 99.7 Ni 62.38 2.0 < 0.23 / 103.79 2.0 100 103 76.75 2.9 100 101 Cu 167.17 1.8 1.16 8.6 23.45 3.3 100 97.3 34.15 1.0 100 96.9 Zn 116.56 4.9 21.40 2.7 256.44 6.7 100 97.4 17.95 5.7 10.0 101 Ga 2.10 4.2 < 0.12 / 2.43 4.1 10.0 101 0.53 6.3 10.0 99.5 Cd 1.30 4.4 0.18 9.1 31.15 2.6 100 103 12.10 9.3 10.0 98.9 Nd 0.20 5.0 < 0.14 / 1.27 0.8 10.0 105 0.35 2.9 10.0 95.8 Pb < 0.24 / 0.31 7.6 9.54 1.3 10.0 106 1.58 0.6 10.0 104 Bi < 0.25 / < 0.25 / 8.95 6.7 10.0 99.4 5.69 1.9 10.0 94.6 Th < 0.53 / < 0.53 / 3.76 2.9 10.0 102 < 0.53 / 10.0 101 U 59.31 0.9 30.16 2.4 2438.10 1.2 1000 102 2797.82 0.9 1000 99.3 注:未检出的用“<方法检出限”表示。 Note: Undetected is indicated by “ < method detection limit ”.
下载: 导出CSV
-
[1] Schlesinger W H, Klein E M, Vengosh A. Global biogeochemical cycle of Vanadium[J]. Proceedings of the National Academy of Sciences of the United States of America, 2017, 114(52): E11092−E11100. [2] Morel F M M, Price N M. The biogeochemical cycles of trace metals in the oceans[J]. Science, 2003, 300(5621): 944−947. doi: 10.1126/science.1083545 [3] Barrett P M, Resing J A, Buck N J, et al. The trace element composition of suspended particulate matter in the upper 1000 m of the eastern North Atlantic Ocean: A16N[J]. Marine Chemistry, 2012, 142-144: 41−53. doi: 10.1016/j.marchem.2012.07.006 [4] Mcalister J A, Orians K J. Dissolved gallium in the Beaufort Sea of the Western Arctic Ocean: a GEOTRACES cruise in the International Polar Year[J]. Marine Chemistry, 2015, 177: 101−109. doi: 10.1016/j.marchem.2015.05.007 [5] Liu Zhengbo, Zhang Jing, Jiang Shuo, et al. Observed dissolved gallium in the tropical and subtropical waters in the Western Pacific Ocean[J]. Chemical Geology, 2025, 674: 122573. doi: 10.1016/j.chemgeo.2024.122573 [6] Liu Shengao, Wu Tianhao, Wang Ziteng, et al. Cadmium isotopes as a tracer for deep carbon recycling[J]. Earth and Planetary Science Letters, 2025, 651: 119168. doi: 10.1016/j.jpgl.2024.119168 [7] Wu Yingzhe, Pena L D, Anderson R F, et al. Assessing neodymium isotopes as an ocean circulation tracer in the Southwest Atlantic[J]. Earth and Planetary Science Letters, 2022, 599: 117846. doi: 10.1016/j.jpgl.2022.117846 [8] Boyle E A, Lee J M, Echegoyen Y, et al. Anthropogenic lead emissions in the ocean: The evolving global experiment[J]. Oceanography, 2014, 27(1): 69−75. doi: 10.5670/oceanog.2014.10 [9] Gdaniec S, Roy-Barman M, Foliot L, et al. Thorium and protactinium isotopes as tracers of marine particle fluxes and deep water circulation in the Mediterranean Sea[J]. Marine Chemistry, 2018, 199: 12−23. doi: 10.1016/j.marchem.2017.12.002 [10] Pavia F J, Cooperdock E H G, De Obeso J C, et al. Uranium isotopes as tracers of serpentinite weathering[J]. Earth and Planetary Science Letters, 2023, 623: 118434. doi: 10.1016/j.jpgl.2023.118434 [11] Bruland K W, Franks R P, Knauer G A, et al. Sampling and analytical methods for the determination of copper, cadmium, zinc, and nickel at the nanogram per liter level in sea water[J]. Analytica Chimica Acta, 1979, 105: 233−245. doi: 10.1016/S0003-2670(01)83754-5 [12] Wu Jingfeng, Boyle E A. Determination of iron in seawater by high-resolution isotope dilution inductively coupled plasma mass spectrometry after Mg(OH)2 coprecipitation[J]. Analytica Chimica Acta, 1998, 367(1/3): 183−191. [13] Biller D V, Bruland K W. Analysis of Mn, Fe, Co, Ni, Cu, Zn, Cd, and Pb in seawater using the Nobias-chelate PA1 resin and magnetic sector inductively coupled plasma mass spectrometry (ICP-MS)[J]. Marine Chemistry, 2012, 130-131: 12−20. doi: 10.1016/j.marchem.2011.12.001 [14] Søndergaard J, Asmund G, Larsen M M. Trace elements determination in seawater by ICP-MS with on-line pre-concentration on a Chelex-100 column using a ‘standard’ instrument setup[J]. MethodsX, 2015, 2: 323−330. doi: 10.1016/j.mex.2015.06.003 [15] Zhu Yanbei, Itoh A, Fujimori E, et al. Multielement determination of trace metals in seawater by inductively coupled plasma mass spectrometry after tandem preconcentration using a chelating resin[J]. Bulletin of the Chemical Society of Japan, 2005, 78(4): 659−667. doi: 10.1246/bcsj.78.659 [16] Rahmi D, Zhu Yanbei, Fujimori E, et al. Multielement determination of trace metals in seawater by ICP-MS with aid of down-sized chelating resin-packed minicolumn for preconcentration[J]. Talanta, 2007, 72(2): 600−606. doi: 10.1016/j.talanta.2006.11.023 [17] Nelms S M, Greenway G M, Koller D. Evaluation of controlled-pore glass immobilized iminodiacetate as a reagent for automated on-line matrix separation for inductively coupled plasma mass spectrometry[J]. Journal of Analytical Atomic Spectrometry, 1996, 11(10): 907−912. doi: 10.1039/ja9961100907 [18] Willie S N, Iida Y, Mclaren J W. Determination of Cu, Ni, Zn, Mn, Co, Pb, Cd, and V in seawater using flow injection ICP-MS[J]. Atomic Spectroscopy, 1998, 19(3): 67−72. [19] Willie S N, Sturgeon R E. Determination of transition and rare earth elements in seawater by flow injection inductively coupled plasma time-of-flight mass spectrometry[J]. Spectrochimica Acta Part B: Atomic Spectroscopy, 2001, 56(9): 1707−1716. doi: 10.1016/S0584-8547(01)00263-4 [20] Zhu Zuhao, Zheng Airong. Fast determination of yttrium and rare earth elements in seawater by inductively coupled plasma-mass spectrometry after online flow injection pretreatment[J]. Molecules, 2018, 23(2): 489. doi: 10.3390/molecules23020489 [21] Milne A, Landing W, Bizimis M, et al. Determination of Mn, Fe, Co, Ni, Cu, Zn, Cd and Pb in seawater using high resolution magnetic sector inductively coupled mass spectrometry (HR-ICP-MS)[J]. Analytica Chimica Acta, 2010, 665(2): 200−207. doi: 10.1016/j.aca.2010.03.027 [22] Beck N G, Franks R P, Bruland K W. Analysis for Cd, Cu, Ni, Zn, and Mn in estuarine water by inductively coupled plasma mass spectrometry coupled with an automated flow injection system[J]. Analytica Chimica Acta, 2002, 455(1): 11−22. doi: 10.1016/S0003-2670(01)01561-6 [23] O'Sullivan J E, Watson R J, Butler E C V. An ICP-MS procedure to determine Cd, Co, Cu, Ni, Pb and Zn in oceanic waters using in-line flow-injection with solid-phase extraction for preconcentration[J]. Talanta, 2013, 115: 999−1010. doi: 10.1016/j.talanta.2013.06.054 [24] Warnken K W, Tang Degui, Gill G A, et al. Performance optimization of a commercially available iminodiacetate resin for the determination of Mn, Ni, Cu, Cd and Pb by on-line preconcentration inductively coupled plasma-mass spectrometry[J]. Analytica Chimica Acta, 2000, 423(2): 265−276. doi: 10.1016/S0003-2670(00)01137-5 [25] Sakamoto H, Yamamoto K, Shirasaki T, et al. Pretreatment method for determination of trace elements in seawater using solid phase extraction column packed with polyamino-polycarboxylic acid type chelating resin[J]. Bunseki Kagaku, 2006, 55(2): 133−139. doi: 10.2116/bunsekikagaku.55.133 [26] Vassileva E, Wysocka I, Orani A M, et al. Off-line preconcentration and inductively coupled plasma sector field mass spectrometry simultaneous determination of Cd, Co, Cu, Mn, Ni, Pb and Zn mass fractions in seawater: procedure validation[J]. Spectrochimica Acta Part B: Atomic Spectroscopy, 2019, 153: 19−27. doi: 10.1016/j.sab.2019.01.001 [27] Liu Zhengbo, Zhang Jing, Jiang Shuo, et al. Comparison between three preconcentration resins to determine dissolved gallium in natural waters using isotope dilution and high resolution inductively coupled plasma mass spectrometry[J]. Talanta, 2023, 265: 124792. doi: 10.1016/j.talanta.2023.124792 [28] 汤震宇, 瞿建国, 张安余, 等. UTEVA树脂分离纯化珊瑚中铀、钍的改进研究[J]. 海洋学报, 2022, 44(2): 11−20. doi: 10.12284/j.issn.0253-4193.2022.2.hyxb202202002Tang Zhenyu, Qu Jianguo, Zhang Anyu, et al. Modified method of separation and purification of U, Th in coral sample with UTEVA resin[J]. Haiyang Xuebao, 2022, 44(2): 11−20. doi: 10.12284/j.issn.0253-4193.2022.2.hyxb202202002 [29] Fujimori E. Determination of Cd in seawater at ng·L-1 levels by ICP-MS: removal of Mo during chelating-resin solid-phase extraction[J]. Bunseki Kagaku, 2016, 65(5): 275−281. doi: 10.2116/bunsekikagaku.65.275 [30] Yabutani T, Sumi H, Nakamura T, et al. Multielemental elution behavior of metal ions adsorbed on iminodiacetic acid chelating resin by using hydrogen peroxide as an eluent[J]. Analytical Sciences, 2012, 28(5): 463−468. doi: 10.2116/analsci.28.463 [31] Millero F J. Chemical Oceanography[M]. Boca Raton: CRC Press, 2013. [32] Bruland K W, Lohan M C. Controls of trace metals in seawater[J]. Treatise on Geochemistry, 2003, 6: 23−47. [33] Norisuye K, Ezoe M, Nakatsuka S, et al. Distribution of bioactive trace metals (Fe, Co, Ni, Cu, Zn and Cd) in the Sulu Sea and its adjacent seas[J]. Deep Sea Research Part II: Topical Studies in Oceanography, 2007, 54(1/2): 14−37. -

计量
- 文章访问数: 15
- HTML全文浏览量: 6
- PDF下载量: 2
- 被引次数: 0
