

Seasonal variations and controlling mechanisms of the carbonate system in Xiaohai Lagoon
-
摘要: 本研究于2023年4月和10月对海南岛最大的潟湖—小海进行了碳酸盐体系的调查,旨在评估该区域的河流无机碳输出通量、海−气界面二氧化碳(CO2)通量、水体酸化程度的季节差异及其调控机制。结果表明周边主要河流每年向小海潟湖输送0.682 × 10⁹ mol总溶解无机碳,0.571 × 109 mol总碱度和0.195 × 10⁹ mol钙离子,多因素共同作用使小海流域单位面积无机碳通量在全球河口处于较高水平(47/134)。潟湖在4月为CO2源,而在10月则转变成汇,年均CO2通量[(0.9 mol/(m2·a)]显著低于全球大多数热带潟湖。在4月,受低pH河水输入影响,湖区南部与北部存在一定程度的酸化现象。而10月,湖区中部底栖海藻、海草和浮游植物的强光合作用一定程度上缓解了水体酸化,使溶解氧过饱和(107%~136%),CO2分压低至116 μatm,pH(8.41 ± 0.14)显著高于外海。本研究将为热带潟湖碳循环和万宁小海生态环境治理提供科学理论支撑。Abstract: We conducted two surveys on the carbonate system in Xiaohai, the largest lagoon on Hainan Island, during April and October 2023. The aims were to evaluate the seasonal differences in riverine inorganic carbon export flux, air-sea carbon dioxide (CO2) flux, and coastal acidification as well as their controlling mechanisms. The results indicate that the surrounding major rivers deliver 0.682 × 10⁹ mol dissolved inorganic carbon (DIC), 0.571×10⁹ mol total alkalinity, and 0.195×10⁹ mol calcium ions to Xiaohai Lagoon annually, and multiple factors result in a high DIC areal yield among other estuaries around the world (47/134). The lagoon water was a CO2 source in April, but turned into a sink in October, with an annual mean CO2 flux [0.9 mol/(m2·a)] significantly lower than most tropical lagoons worldwide. In April, some acidification events occurred in the southeastern lagoon and the northern tidal channel. In October, strong photosynthesis by benthic seagrass, macroalgae, and phytoplankton alleviated estuarine acidification, resulting in a supersaturation of dissolved oxygen (107%−136%), a deficit of partial pressure of CO2 as low as 116 μatm, and an elevated pH (8.41 ± 0.14) significantly higher than the offshore seawater. Our study will provide scientific support for the carbon cycle in tropical lagoons and ecological environment management in Xiaohai Lagoon.
-
Key words:
- tropical lagoon /
- carbonate system /
- riverine export flux /
- CO2 flux /
- coastal acidification /
- blue carbon ecosystems
-

图 1 小海采样站位(a)、航次当天潮位(b)和风速(c)的变化情况
实心圆圈显示航次期间的数据
Fig. 1 Sampling sites (a), variations in tidal height (b) and wind speed (c) at sampling days
Filled circles indicate the data during cruises

图 2 周边主要河流河道DIC、TA以及Ca2+浓度
河流顺序从北往南排列,河道内站位从上游到下游排列
Fig. 2 Concentrations of DIC, TA, and Ca2+ in the surrounding river channels
The river sequence is arranged from north to south, and the stations within the river channel are arranged from upstream to downstream

图 3 4月和10月小海潟湖温度(a)和盐度(b)的空间分布特征
Fig. 3 Spatial distributions of water temperature (a) and salinity (b) in April and October in Xiaohai Lagoon

图 4 4月和10月小海潟湖DO%(a)、pH(b)、Ωarag(c)和pCO2(d)的空间分布特征
Fig. 4 Spatial distributions of DO% (a), pH (b), Ωarag (c), and pCO2 (d) in April and October seasons in Xiaohai Lagoon

图 5 小海流域河流无机碳输出通量与其他流域通量及其影响因素比较
大型河流流域数据引自文献[46, 49],由于大型河流流域降雨量数据的缺失,文献使用地表径流Runoff近似指代降雨量;小型河流流域主要来自印度[48]
Fig. 5 Comparison of riverine inorganic carbon export flux and influencing factors between Xiaohai basin and other river basins
The data of large river basins are cited from the literature [46, 49], due to the lack of rainfall data for large river basins, the literature used surface runoff as an approximate proxy for rainfall; while most of the small river basins are from India[48]
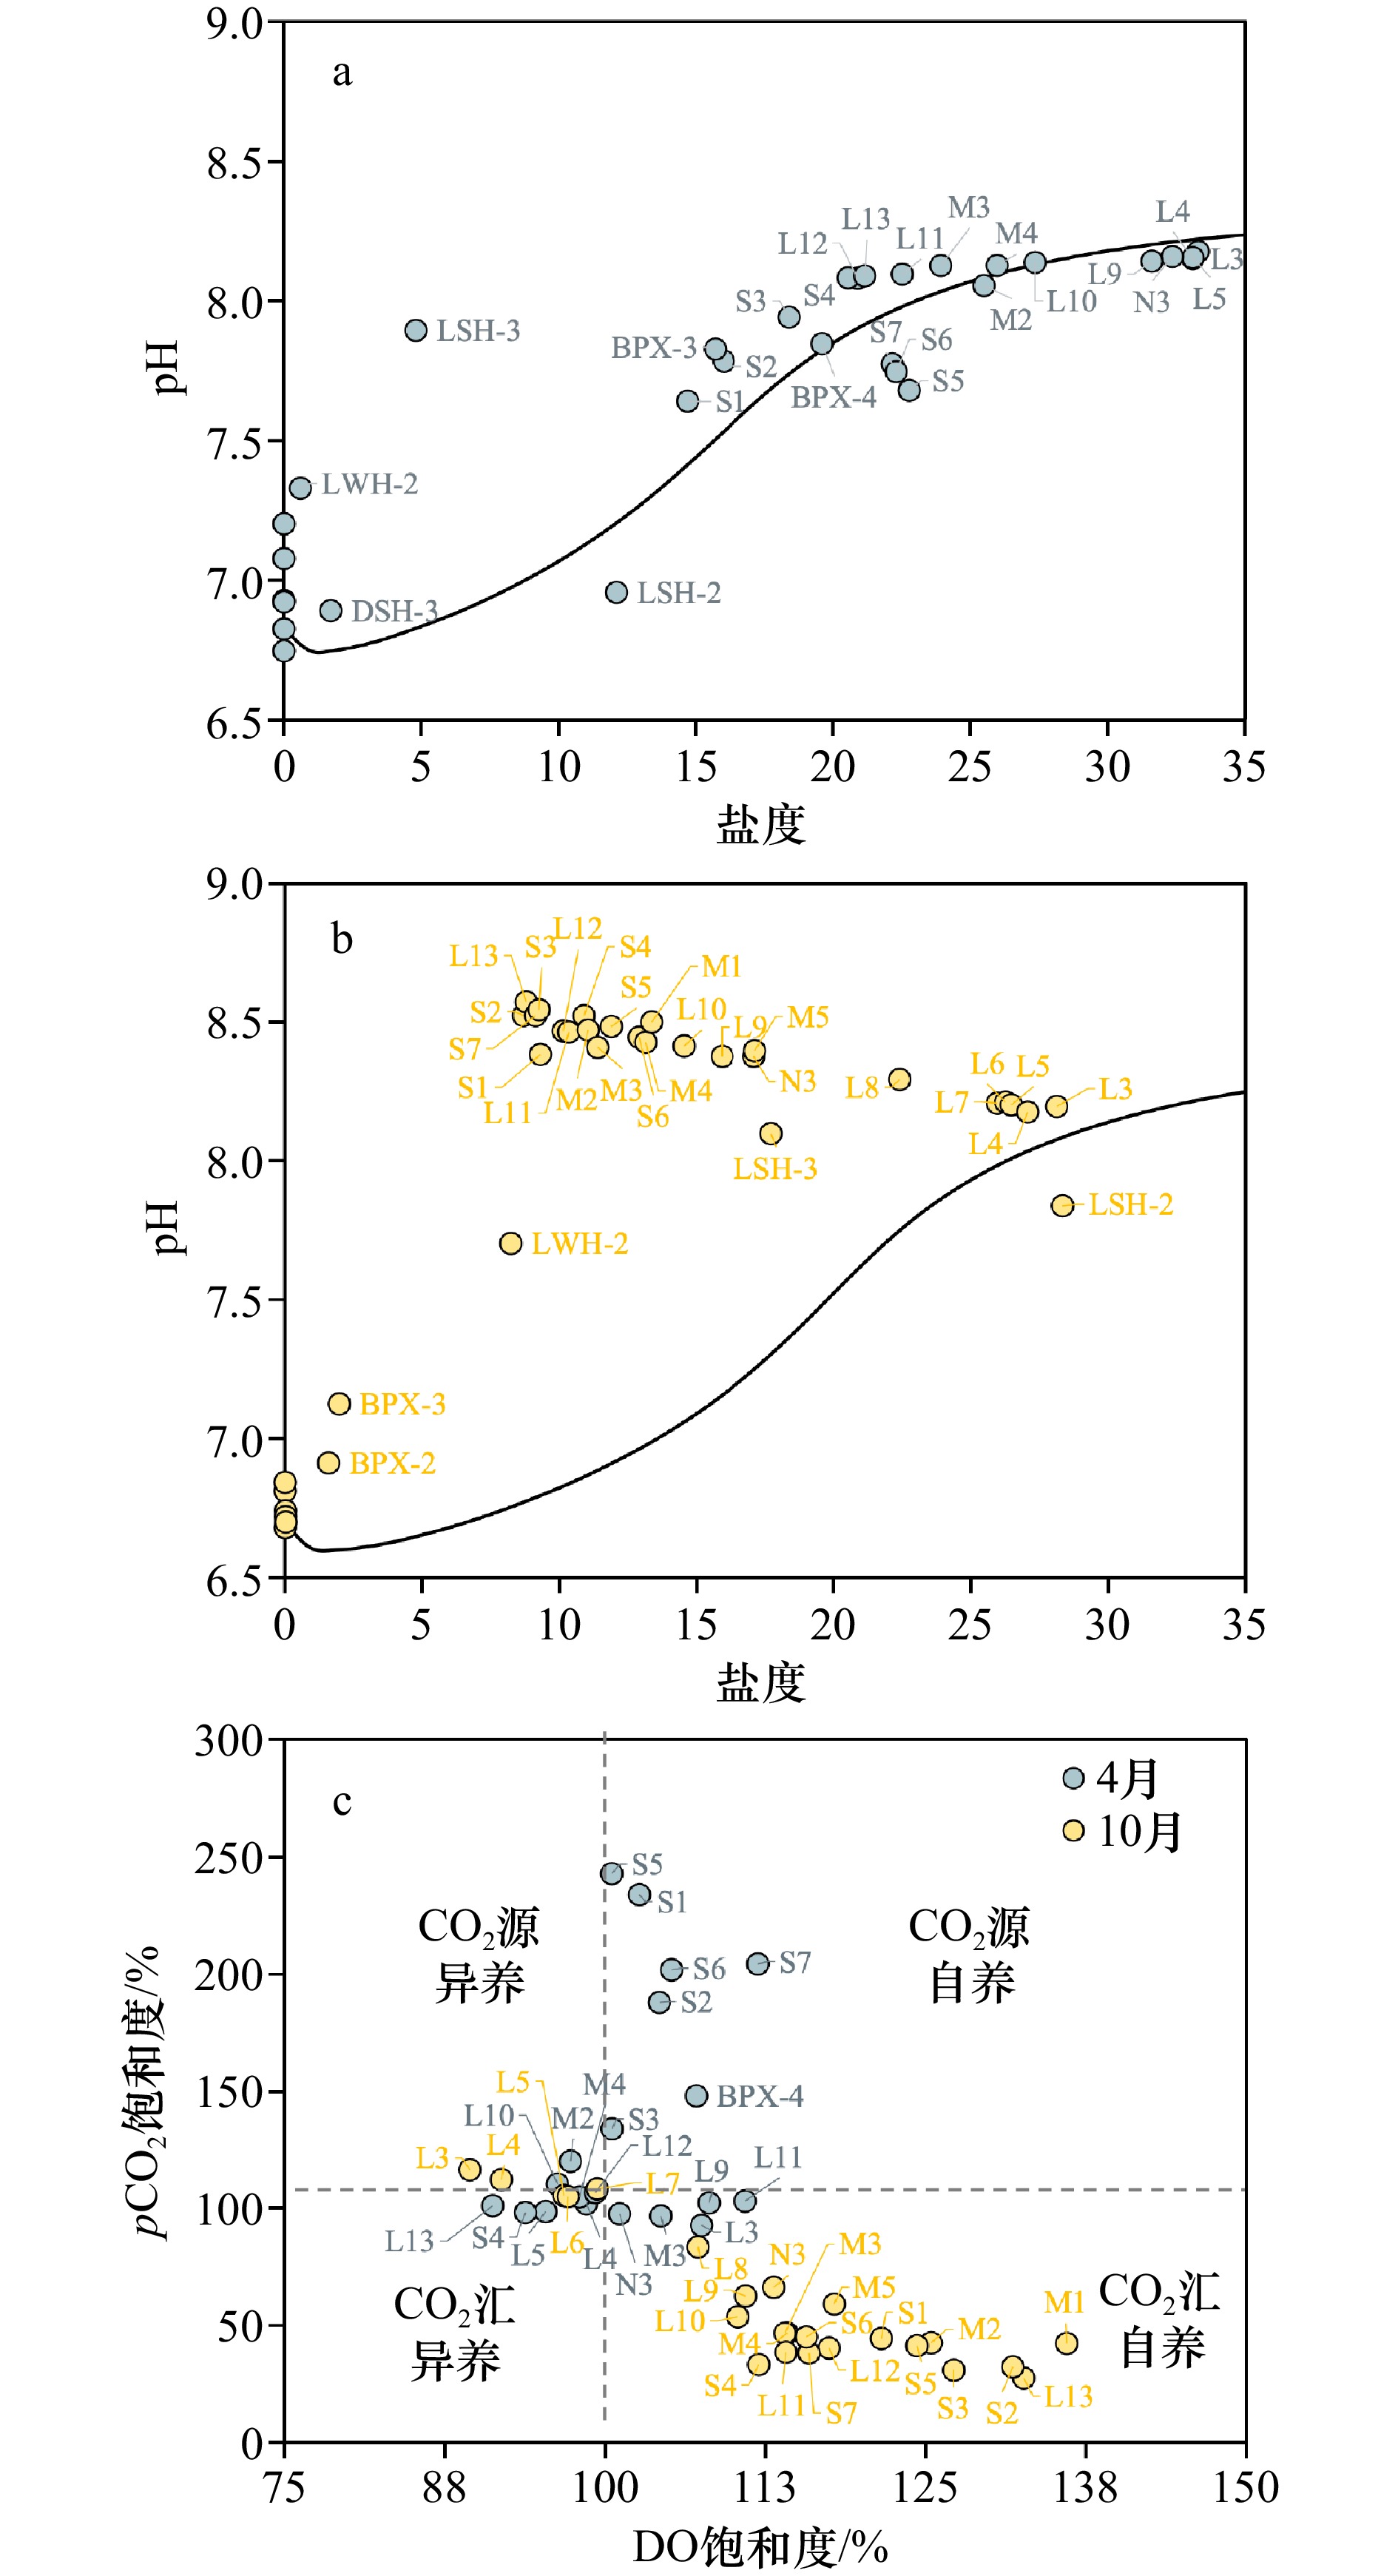
图 6 4月和10月小海潟湖pH随盐度分布(a、b)及 pCO2和DO饱和度的分布(c)
图a和b中包含河道数据,其中曲线为pH的保守混合线;图c仅包含湖区数据,两条灰色虚线为DO和pCO2达到100%饱和度的参考线)
Fig. 6 Distributions of pH against salinity (a, b), saturations of DO and pCO2 in Xiaohai Lagoon (c) in April and October
Figs. a, b contains river channels data, where the curve is a conservative mixed line of pH against salinity; Only data in lagoon aera are included in Fig. c, and the two dashed grey lines mean the reference lines for saturated DO and pCO2
表 1 小海流域4月和10月的物质浓度以及年均河流输出通量
Tab. 1 Substance concentrations in the April and October and the annual mean riverine export fluxes in Xiaohai watershed
河流 流域
面积*/
km2径流量*/
(m3·s−1)DIC浓度/
(μmol·kg−1)TA浓度/
(μmol·kg−1)Ca2+浓度/
(μmol·kg−1)DIC通量/
(109 mol·a−1)TA通量/
(109 mol·a−1)Ca2+通量/
(109 mol·a−1)4月 10月 年均 4月 10月 年均 4月 10月 年均 龙首河 135.8 5.8 1036 774 905 889 649 769 301 202 251 0.166 0.141 0.046 龙尾河 158.0 7.3 638 603 620 633 567 598 184 182 183 0.142 0.137 0.042 东山河 97.1 4.6 959 989 972 768 758 763 276 325 301 0.142 0.111 0.044 北坡溪 110.1 7.5 741 1 221 981 644 890 767 232 298 265 0.232 0.181 0.063 汇总 501.0 25.2 857 718 245 0.682 0.571 0.195 注:*数据引自文献[17]。  下载: 导出CSV
A1 河流无机碳输出通量与流域信息数据汇总
A1 Data compilation for riverine export fluxes of dissolved inorganic carbon and watershed information
编号 河流名称 纬度 经度 流域面积/
(103 km2)径流量/
(km3·a−1)降雨量/
(mm·a−1)无机碳
类型物质浓度/
(μmol·L−1)通量/
(109 mol·a−1)单位面积通量/
(103 mol·km−2·a−1)数据来源 1 Congo 4°S NA 3699 1308 354 HCO3 224 293 79 文献[46] 2 Orinoco 8°N NA 1039 1129 1087 TA 423 478 460 文献[46] 3 Changjiang 30°N NA 1794 944 526 HCO3 1780 1680 937 文献[46] 4 Brahmaputra 25°N NA 583 628 1077 HCO3 1114 700 1200 文献[46] 5 Mississippi 36°N NA 3203 610 190 TA 2074 1265 395 文献[46] 6 Yenisei 60°N NA 2582 599 232 HCO3 905 542 210 文献[46] 7 Parana 23°S NA 2661 568 213 TA 764 434 163 文献[46] 8 Lena 63°N NA 2418 531 220 HCO3 870 462 191 文献[46] 9 Mekong 20°N NA 774 525 678 HCO3 949 498 644 文献[46] 10 Ob 60°N NA 2570 412 160 TA 1251 515 201 文献[46] 11 Ganges 26°N NA 956 404 423 HCO3 1966 794 831 文献[46] 12 Tocantins 8°S NA 757 372 491 HCO3 316 118 155 文献[46] 13 St Lawrence 47°N NA 1267 363 287 TA 1339 486 384 文献[46] 14 Pearl River 23°N NA 477 343 719 HCO3 1535 527 1104 文献[46] 15 Mackenzie 64°N NA 1713 290 169 TA 1800 522 305 文献[46] 16 Xijiang 23°N NA 409 270 660 DIC 1938 523 1279 文献[46] 17 Columbia 42°N NA 724 252 348 HCO3 1246 314 434 文献[46] 18 Ubangi 2°S NA 356 228 640 HCO3 317 72 203 文献[46] 19 Yukon 54°N NA 852 212 249 HCO3 1363 289 339 文献[46] 20 Salween 21°N NA 325 211 649 HCO3 3475 733 2256 文献[46] 21 Danube 48°N NA 788 202 256 HCO3 3115 629 799 文献[46] 22 Niger 9°N NA 2240 193 86 HCO3 550 106 47 文献[46] 23 Indus 29°N NA 1143 104 91 HCO3 1681 175 153 文献[46] 24 Huanghe 36°N NA 894 47 53 HCO3 2591 122 136 文献[46] 25 Irrawady 21°N NA 410 486 1185 HCO3 1967 956 2332 文献[49] 26 Amur 50°N NA 1855 344 185 HCO3 477 164 88 文献[49] 27 Magdalena 7°N NA 235 237 1009 HCO3 808 191 815 文献[49] 28 Uruguay 30°S NA 240 145 604 HCO3 426 62 257 文献[49] 29 Fly 7°S NA 61 141 2311 HCO3 1284 181 2968 文献[49] 30 Pechora 66°N NA 324 131 404 HCO3 638 84 258 文献[49] 31 HongHe 23°N NA 120 123 1025 HCO3 1328 163 1361 文献[49] 32 Sepik 4°S NA 79 120 1525 HCO3 1205 145 1837 文献[49] 33 Kolyma 68°N NA 666 118 177 HCO3 467 55 83 文献[49] 34 Fraser 51°N NA 220 112 509 HCO3 841 94 428 文献[49] 35 N. Dvina 63°N NA 348 110 316 HCO3 1361 150 430 文献[49] 36 Zambese 16°S NA 1330 103 77 HCO3 525 54 41 文献[49] 37 Godavari 21°N NA 312 97 311 HCO3 2156 209 670 文献[49] 38 Nelson 56°N NA 1132 89 79 HCO3 2115 189 167 文献[49] 39 Khatanga 72°N NA 364 85 234 HCO3 785 67 184 文献[49] 40 Purari 7°S NA 31 84 2749 HCO3 1328 112 3651 文献[49] 41 Nile 27°N NA 2870 83 29 HCO3 2852 237 82 文献[49] 42 Rhine 49°N NA 224 69 310 HCO3 2590 180 802 文献[49] 43 Mahanadi 21°N NA 132 66 500 HCO3 998 66 499 文献[49] 44 Kuskokwin 62°N NA 123 60 487 HCO3 1469 88 715 文献[49] 45 Rhone 45°N NA 96 54 565 HCO3 2885 156 1630 文献[49] 46 Dnepr 51°N NA 504 54 107 HCO3 2502 135 268 文献[49] 47 Po 45°N NA 70 47 667 HCO3 2918 136 1947 文献[49] 48 Shatt el arab 31°N NA 541 46 85 HCO3 2951 135 250 文献[49] 49 Narmada 22°N NA 102 39 382 HCO3 2869 112 1097 文献[49] 50 Wisla 52°N NA 198 33 164 HCO3 3115 101 511 文献[49] 51 Krishna 17°N NA 259 30 116 HCO3 2049 61 237 文献[49] 52 Don 50°N NA 420 29 69 HCO3 3295 95 227 文献[49] 53 Limpopo 23°S NA 440 26 59 HCO3 2361 61 140 文献[49] 54 Murray Darling 34°S NA 1060 24 22 HCO3 1541 36 34 文献[49] 55 Elbe 52°N NA 148 23 154 HCO3 2164 49 333 文献[49] 56 Cauveri 11°N NA 88 21 239 HCO3 2902 61 693 文献[49] 57 Nemanus 54°N NA 98 20 200 HCO3 4075 80 813 文献[49] 58 Odra 51°N NA 112 18 163 HCO3 2459 45 402 文献[49] 59 Panuco 22°N NA 66 17 261 HCO3 2918 50 761 文献[49] 60 Ebro 41°N NA 84 17 207 HCO3 2159 38 447 文献[49] 61 Seine 48°N NA 79 13 164 HCO3 4131 53 678 文献[49] 62 Weser 52°N NA 46 11 230 HCO3 2754 29 635 文献[49] 63 Orange 16°S NA 716 11 154 HCO3 1757 19 27 文献[49] 64 Pazhayar 8.2°N 77.5°E 0.397 0.21 1122.24 DIC 1512 0.32 794 文献[48] 65 Thamirabarani 8.3°N 77.2°E 0.745 0.34 1889.56 DIC 591 0.2 266 文献[48] 66 Neyyar 8.4°N 77.1°E 0.497 0.26 1809.2 DIC 353 0.09 188 文献[48] 67 Karamanyar 8.5°N 77.0°E 0.516 0.49 2240.07 DIC 331 0.16 313 文献[48] 68 Vamanapuram 8.7°N 76.8°E 0.687 0.8 2776.12 DIC 522 0.42 608 文献[48] 69 Ithikara 8.9°N 76.7°E 0.642 0.84 2518.46 DIC 316 0.26 412 文献[48] 70 Kallada 9.0°N 76.6°E 1.699 2.28 2695.3 DIC 480 1.09 643 文献[48] 71 Achankovil 9.3°N 76.6°E 1.484 1.99 2695.3 DIC 356 0.71 477 文献[48] 72 Pampa 9.3°N 76.6°E 2.235 3.62 2695.3 DIC 255 0.92 413 文献[48] 73 Manimala 9.4°N 76.6°E 0.847 1.74 3068.4 DIC 329 0.57 674 文献[48] 74 Meenachil 9.6°N 76.5°E 1.272 3.05 2790.82 DIC 339 1.03 813 文献[48] 75 Muvathpuzha 10.0°N 76.6°E 2.754 7.55 2968.5 DIC 351 2.65 962 文献[48] 76 Periyar 10.2°N 76.4°E 5.398 8 2453.71 DIC 411 3.29 610 文献[48] 77 Kurumali 10.4°N 76.3°E 1.537 1.99 2306.25 DIC 269 0.54 349 文献[48] 78 Bharathappuzha 10.8°N 76.3°E 6.181 5.07 1528.71 DIC 901 4.57 739 文献[48] 79 Kadalundipuzha 11.0°N 76.1°E 1.122 1.79 2004 DIC 367 0.66 586 文献[48] 80 Chaliyar 11.2°N 75.9°E 2.933 5.67 2599.56 DIC 333 1.89 645 文献[48] 81 Kuttiyadi 11.5°N 75.6°E 0.583 1.86 3104.84 DIC 402 0.75 1280 文献[48] 82 Mahe 11.7°N 75.6°E 0.406 1.44 4181.45 DIC 424 0.52 1281 文献[48] 83 Anjarakandy 11.8°N 75.5°E 0.412 6.24 4343.84 DIC 485 0.7 1690 文献[48] 84 Valapattanam 12.0°N 75.4°E 1.867 1.53 4234.52 DIC 505 3.15 1688 文献[48] 85 Kuppam 12.0°N 75.3°E 0.469 0.98 4584.78 DIC 369 0.56 1203 文献[48] 86 Perumba 12.1°N 75.2°E 0.314 2.33 3919.67 DIC 466 0.46 1462 文献[48] 87 Thejaswini 12.3°N 75.2°E 0.784 4.4 3709.69 DIC 276 0.64 818 文献[48] 88 Payaswini 12.5°N 75.1°E 1.538 1.77 3577 DIC 337 1.48 964 文献[48] 89 Shiriya 12.7°N 75.1°E 0.587 12.6 3761.89 DIC 298 0.53 898 文献[48] 90 Netravathi 12.9°N 75.0°E 3.657 2.53 4478.32 DIC 411 5.17 1415 文献[48] 91 Gurupura 12.9°N 75.0°E 0.685 0.74 4429.64 DIC 299 0.76 1104 文献[48] 92 Nandini 13.0°N 74.9°E 0.203 1.37 4403.58 DIC 289 0.21 1059 文献[48] 93 Shambhavi 13.1°N 74.9°E 0.344 3.83 4592.46 DIC 248 0.34 991 文献[48] 94 Suvarna 13.4°N 74.9°E 0.873 2.16 5050.25 DIC 288 1.1 1265 文献[48] 95 Sita 13.5°N 74.7°E 0.505 3.07 4909.58 DIC 251 0.54 1071 文献[48] 96 Haladi 13.6°N 74.8°E 0.781 1.15 4907.32 DIC 275 0.84 1081 文献[48] 97 Kolluru 13.7°N 74.6°E 0.295 1.3 4854.85 DIC 289 0.33 1129 文献[48] 98 Venkatapur 14.0°N 74.5°E 0.335 11.31 4881.44 DIC 482 0.63 1872 文献[48] 99 Sharavati 14.2°N 74.5°E 2.895 5.16 4584.78 DIC 387 4.38 1512 文献[48] 100 Aghnashini 14.4°N 74.4°E 1.35 13.83 4883.79 DIC 341 1.76 1304 文献[48] 101 Gangavali 14.6°N 74.4°E 3.574 1.23 4846.39 DIC 588 8.13 2274 文献[48] 102 Poojageri 14.7°N 74.3°E 0.216 0.84 4922.47 DIC 500 0.42 1939 文献[48] 103 Kali 14.9°N 74.2°E 4.841 19.11 4557.92 DIC 521 9.96 2057 文献[48] 104 Galibag 15.0°N 74.1°E 0.112 0.44 4935.18 DIC 397 0.18 1565 文献[48] 105 Talpona 15.0°N 74.1°E 0.233 0.92 4835.99 DIC 349 0.32 1383 文献[48] 106 Sal 15.2°N 74.0°E 0.301 1.19 4931.61 DIC 757 0.9 2988 文献[48] 107 Zuari 15.4°N 74.0°E 0.881 3.51 4579.28 DIC 507 1.78 2017 文献[48] 108 Mandavi 15.5°N 74.0°E 2.032 8.01 4926.81 DIC 507 4.06 1998 文献[48] 109 Chapora 15.6°N 73.8°E 0.923 3.57 4840.37 DIC 391 1.4 1514 文献[48] 110 Terekhol 15.7°N 73.8°E 0.698 2.64 4542.57 DIC 433 1.14 1638 文献[48] 111 Karli 16.0°N 73.7°E 0.786 2.85 4344.11 DIC 504 1.43 1824 文献[48] 112 Gad 16.3°N 73.7°E 0.713 2.46 4493.05 DIC 523 1.29 1806 文献[48] 113 Devgad 16.4°N 73.7°E 0.442 1.41 3988.37 DIC 566 0.8 1805 文献[48] 114 Vaghotan 16.6°N 73.6°E 0.845 2.61 2736.94 DIC 611 1.6 1889 文献[48] 115 Arjuna 16.7°N 73.5°E 0.64 1.9 2735.07 DIC 792 1.51 2354 文献[48] 116 Muchukundi 16.8°N 73.6°E 0.694 2.01 2557.07 DIC 699 1.41 2026 文献[48] 117 Kajali 16.9°N 73.5°E 0.554 1.6 2860.18 DIC 693 1.11 1999 文献[48] 118 Bav 17.2°N 73.5°E 2.159 6.27 2862.87 DIC 577 3.62 1676 文献[48] 119 Vashishti 17.5°N 73.5°E 2.197 6.51 2623.54 DIC 602 3.92 1784 文献[48] 120 Savitri 18.1°N 73.4°E 2.262 7.37 2719.73 DIC 570 4.2 1858 文献[48] 121 Kundalika 18.4°N 73.2°E 0.779 2.02 2540.53 DIC 1081 2.19 2807 文献[48] 122 Amba 18.5°N 73.2°E 0.751 1.9 2469.04 DIC 1232 2.34 3121 文献[48] 123 Bhogawati 18.7°N 73.1°E 0.441 1.11 2479.64 DIC 1089 1.21 2737 文献[48] 124 Patalaganga 18.8°N 73.1°E 0.654 1.58 2174.67 DIC 802 1.27 1942 文献[48] 125 Taloje 19.1°N 73.1°E 0.449 1.34 2133.96 DIC 973 1.3 2900 文献[48] 126 Ulhas 19.2°N 73.0°E 4.733 13.2 1861.4 DIC 1449 19.14 4043 文献[48] 127 Vaitarna 19.6°N 73.0°E 2.784 4.99 1575.52 DIC 1354 6.76 2426 文献[48] 128 Tumb 20.2°N 72.8°E 0.448 0.72 1522.62 DIC 1216 0.87 1951 文献[48] 129 Daman Ganga 20.3°N 72.9°E 2.318 3.48 1788 DIC 1252 4.36 1881 文献[48] 130 Par 20.5°N 73.0°E 0.907 1.27 1421.27 DIC 1632 2.06 2277 文献[48] 131 Auranga 20.6°N 73.0°E 0.701 0.88 1394.86 DIC 1800 1.59 2269 文献[48] 132 Ambika 20.9°N 73.1°E 2.715 3.03 1270.52 DIC 1807 5.48 2020 文献[48] 133 Purna 21.0°N 73.0°E 2.431 2.69 1260.87 DIC 1697 4.56 1875 文献[48] 134 小海 19.0°N 110.5°E 0.501 0.80 2159 DIC 861 0.68 1362 本研究 注:NA表示无法从原文中获取数据。
下载: 导出CSV
A2 全球潟湖河口年均CO2通量数据汇总
A2 Data compilation for annual CO2 flux in the world’s lagoon estuaries
编号 潟湖名称 纬度 经度 水深/
m蓝碳/水生植物 潟湖面积/
km2海气通量/
(mol·m−2·a−1)数据来源 1 Chilka (lagoon) (印度) 19.1°N 85.5°W 2 Potamogeton, Halophila, Gracilaria,
Ruppia, Eichornia, 等1000 27.5 文献[52] 2 Tendo Lagoon (西非) 5.3°N 3.2°W 2.7 NA 74 7.0 文献[58] 3 Aby Lagoon (西非) 5.4°N 3.3°W 4.2 NA 305 −2.7 文献[58] 4 Tagba Lagoon (西非) 5.5°N 4.3°W 4.8 NA 524 18.5 文献[58] 5 Potou Lagoon (西非) 5.5°N 3.8°W 2.7 NA 22 36.8 文献[58] 6 Ebrié Lagoon (西非) 5.4°N 5.0°W 2 NA 190 26.6 文献[58] 7 Hastings (澳大利亚) 31.4°S NA NA Seagrass 19 −0.4 文献[57] 8 Camden Haven (澳大利亚) 30.7°S NA NA Seagrass 30 −1.8 文献[57] 9 Wallis Lake (澳大利亚) 32.2°S NA NA Seagrass 90 −2.0 文献[57] 10 Aveiro lagoon (葡萄牙) 40.7°N 8.7°W NA NA NA 12.4 文献[14] 11 Furen lagoon (日本) 43.3°N 145.3°E 1 Zostera marina 57.4 −32.8 文献[51, 53–54] 12 Mission−Aransas (美国) 27.1°N NA NA NA 452 12.4 文献[50] 13 Lavaca Colorado Estuary (美国) 28.0°N NA 1~1.5 NA NA 25.6 文献[11] 14 Guadalupe Estuary (美国) 28.0°N NA 1~1.5 NA NA 35.9 文献[11] 15 Mission−Aransas Estuary (美国) 28.0°N NA 1~1.5 NA NA 6.9 文献[11] 16 Nueces Estuary (美国) 28.0°N NA 1~1.5 NA NA 2.7 文献[11] 17 Saquarema Lagoon (巴西) 23.5°S 42.2°W 1.2 NA 21.2 −35.9 文献[55] 18 Araruama Lagoon (巴西) 22.9°S 41.2°W 3 NA 220 −26.9 文献[56] 19 Mar Menor (西班牙) 37.8°N 0.8°W 4.5 NA 135 1.2 文献[60] 20 La Mancha (墨西哥) 19.6°N 96.4°W NA NA 1.32 42.3 文献[59] 21 Arcachon (法国) 44.7°N 1.2°E 4.6 Seagrass 174 3.6 文献[61] 22 黎安 (中国) 18.4°N 110.0°E <2 Thalassia hemprichii, Enhalus acoroides NA −0.6 文献[51] 23 新村 (中国) 18.4°N 110.0°E <2 Thalassia hemprichii, Enhalus acoroides NA −0.5 文献[51] 24 小海 (中国) 19.1°N 110.5°E 1~1.5 Halophila beccarii, Gracilaria tenuistipitata 49 0.9 本研究 注:NA表示无法从原文中获取数据。
下载: 导出CSV
-
[1] Monnin E, Indermühle A, Dällenbach A, et al. Atmospheric CO2 concentrations over the Last Glacial Termination[J]. Science, 2001, 291(5501): 112−114. doi: 10.1126/science.291.5501.112 [2] Friedlingstein P, O’Sullivan M, Jones M W, et al. Global carbon budget 2023[J]. Earth System Science Data, 2023, 15(12): 5301−5369. doi: 10.5194/essd-15-5301-2023 [3] Caldeira K, Wickett M E. Oceanography: anthropogenic carbon and ocean pH[J]. Nature, 2003, 425(6956): 365. doi: 10.1038/425365a [4] Doney S C, Fabry V J, Feely R A, et al. Ocean acidification: the other CO2 problem[J]. Annual Review of Marine Science, 2009, 1: 169−192. doi: 10.1146/annurev.marine.010908.163834 [5] Cai Weijun. Estuarine and coastal ocean carbon paradox: CO2 sinks or sites of terrestrial carbon incineration?[J]. Annual Review of Marine Science, 2011, 3: 123−145. doi: 10.1146/annurev-marine-120709-142723 [6] Yan Qi, Cheng Tingting, Song Junting, et al. Internal nutrient loading is a potential source of eutrophication in Shenzhen Bay, China[J]. Ecological Indicators, 2021, 127: 107736. doi: 10.1016/j.ecolind.2021.107736 [7] Laruelle G G, Dürr H H, Slomp C P, et al. Evaluation of sinks and sources of CO2 in the global coastal ocean using a spatially-explicit typology of estuaries and continental shelves[J]. Geophysical Research Letters, 2010, 37(15): L15607. [8] Boynton W R, Murray L, Hagy J D, et al. A comparative analysis of eutrophication patterns in a temperate coastal lagoon[J]. Estuaries, 1996, 19(2): 408−421. doi: 10.2307/1352459 [9] Hu Xinping, Cai Weijun. Estuarine acidification and minimum buffer zone—a conceptual study[J]. Geophysical Research Letters, 2013, 40(19): 5176−5181. doi: 10.1002/grl.51000 [10] Martínez-Trejo J A, Cardoso-Mohedano J G, Sanchez-Cabeza J A, et al. Variability of dissolved inorganic carbon in the most extensive karst estuarine-lagoon system of the southern Gulf of Mexico[J]. Estuaries and Coasts, 2024, 47(8): 2573−2588. doi: 10.1007/s12237-024-01384-1 [11] Yao Hongming, McCutcheon M R, Staryk C J, et al. Hydrologic controls on CO2 chemistry and flux in subtropical lagoonal estuaries of the northwestern Gulf of Mexico[J]. Limnology and Oceanography, 2020, 65(6): 1380−1398. doi: 10.1002/lno.11394 [12] Hsieh H H, Chuang M H, Shih Y Y, et al. Eutrophication and hypoxia in tropical Negombo Lagoon, Sri Lanka[J]. Frontiers in Marine Science, 2021, 8: 678832. doi: 10.3389/fmars.2021.678832 [13] Laruelle G G, Dürr H H, Lauerwald R, et al. Global multi-scale segmentation of continental and coastal waters from the watersheds to the continental margins[J]. Hydrology and Earth System Sciences, 2013, 17(5): 2029−2051. doi: 10.5194/hess-17-2029-2013 [14] Chen C T A, Huang T H, Chen Y C, et al. Air-sea exchanges of CO2 in the world’s coastal seas[J]. Biogeosciences, 2013, 10(10): 6509−6544. doi: 10.5194/bg-10-6509-2013 [15] 海南省万宁市生态环境局. 2023年万宁市生态环境质量状况[EB/OL]. (2024−01−23)[2024−11−11]. https://wanning.hainan.gov.cn/wanning/zfxxgk/sgbmgk/sthjbh/gkml/202401/t20240124_3578456.html.Ecological Environment Bureau of Wanning City, Hainan Province. Ecological environment quality of Wanning city in 2023[EB/OL]. (2024−01−23)[2024−11−11]. https://wanning.hainan.gov.cn/wanning/zfxxgk/sgbmgk/sthjbh/gkml/202401/t20240124_3578456.html. [16] 宋德卓, 薛积彬, 孙升升, 等. 海南小海潟湖沉积物地球化学揭示的近千年气候环境变化[J]. 地球化学, 2022, 51(2): 202−212.Song Dezhuo, Xue Jibin, Sun Shengsheng, et al. Climate and environmental changes revealed by sedimentary geochemical elements of the Xiaohai Lagoon(Hainan) during the last millennium[J]. Geochimica, 2022, 51(2): 202−212. [17] Xue Bosheng, Wang Zhili, Lu Yongjun, et al. Turbulent mixing in a choked shallow lagoon and the impacts of remediation engineering[J]. Applied Ocean Research, 2023, 138: 103643. doi: 10.1016/j.apor.2023.103643 [18] 林钟扬, 倪建宇, 时连强, 等. 海南小海表层沉积环境及重金属污染综合评价[J]. 海洋学研究, 2011, 29(2): 12−23. doi: 10.3969/j.issn.1001-909X.2011.02.002Lin Zhongyang, Ni Jianyu, Shi Lianqiang, et al. Comprehensive evaluation of the environment and the heavy metals pollution in the surface sediments of Xiaohai, Hainan Province[J]. Journal of Marine Sciences, 2011, 29(2): 12−23. doi: 10.3969/j.issn.1001-909X.2011.02.002 [19] 刘兴健, 葛晨东. 海南岛小海潟湖沉积环境演变研究[J]. 海洋通报, 2007, 26(4): 71−79. doi: 10.3969/j.issn.1001-6392.2007.04.010Liu Xingjian, Ge Chendong. Sedimentary environment evolvement of Xiaohai Lagoon in the Hainan Island[J]. Marine Science Bulletin, 2007, 26(4): 71−79. doi: 10.3969/j.issn.1001-6392.2007.04.010 [20] 郭英海, 李壮福, 张德高, 等. 海南岛万宁小海的障壁海岸沉积[J]. 中国矿业大学学报, 1999, 28(5): 461−464. doi: 10.3321/j.issn:1000-1964.1999.05.013Guo Yinghai, Li Zhuangfu, Zhang Degao, et al. Barrier coast deposition in Wanning Xiaohai of Hainan Island[J]. Journal of China University of Mining & Technology, 1999, 28(5): 461−464. doi: 10.3321/j.issn:1000-1964.1999.05.013 [21] 胡辉, 胡方西, 汪思明, 等. 海南岛东海岸小海澙湖水文基本特征[J]. 热带海洋, 1997, 16(4): 54−61.Hu Hui, Hu Fangxi, Wang Siming, et al. Basic hyderologic characterisitics of Xiaohai Lagoon in Hainan Island[J]. Tropic Oceanology, 1997, 16(4): 54−61. [22] 朱志雄, 骆丽珍, 陈石泉, 等. 海南小海海水富营养化和重金属特征分析与评价[J]. 海洋湖沼通报, 2020(5): 131−138.Zhu Zhixiong, Luo Lizhen, Chen Shiquan, et al. Analysis and evaluation of eutrophication of seawater and characteristics of heavy metal in Xiaohai, Hainan[J]. Transactions of Oceanology and Limnology, 2020(5): 131−138. [23] 李伟光, 张京红, 刘少军, 等. 海南岛干旱的气象特征及监测指标[J]. 热带生物学报, 2022, 13(4): 324−330. doi: 10.3969/j.issn.1674-7054.2022.4.hnrdnydxxb202204002Li Weiguang, Zhang Jinghong, Liu Shaojun, et al. Meteorological characteristics and monitoring index of drought in Hainan Island[J]. Journal of Tropical Biology, 2022, 13(4): 324−330. doi: 10.3969/j.issn.1674-7054.2022.4.hnrdnydxxb202204002 [24] Dickson A G, Sabine C L, Christian J R. Guide to Best Practices for Ocean CO2 Measurements[M]. Sidney: North Pacific Marine Science Organization, 2007: 191. [25] Wang Z A, Cai Weijun. Carbon dioxide degassing and inorganic carbon export from a marsh-dominated estuary(the Duplin River): a marsh CO2 pump[J]. Limnology and Oceanography, 2004, 49(2): 341−354. doi: 10.4319/lo.2004.49.2.0341 [26] Pai Sucheng, Gong G C, Liu K K. Determination of dissolved oxygen in seawater by direct spectrophotometry of total iodine[J]. Marine Chemistry, 1993, 41(4): 343−351. doi: 10.1016/0304-4203(93)90266-Q [27] Labasque T, Chaumery C, Aminot A, et al. Spectrophotometric Winkler determination of dissolved oxygen: re-examination of critical factors and reliability[J]. Marine Chemistry, 2004, 88(1/2): 53−60. [28] Benson B B, Krause Jr D. The concentration and isotopic fractionation of oxygen dissolved in freshwater and seawater in equilibrium with the atmosphere[J]. Limnology and Oceanography, 1984, 29(3): 620−632. doi: 10.4319/lo.1984.29.3.0620 [29] Cao Zhimian, Dai Minhan. Shallow-depth CaCO3 dissolution: evidence from excess calcium in the South China Sea and its export to the Pacific Ocean[J]. Global Biogeochemical Cycles, 2011, 25(2): GB2019. [30] Lewis E R, Wallace D W R. Program developed for CO2 system calculations[EB/OL]. (1998-01-01) [2024-11-11]. https://www.ncei.noaa.gov/access/ocean-carbon-acidification-data-system/oceans/CO2SYS/co2rprt.html, 1998. [31] Orr J C, Epitalon J M, Dickson A G, et al. Routine uncertainty propagation for the marine carbon dioxide system[J]. Marine Chemistry, 2018, 207: 84−107. doi: 10.1016/j.marchem.2018.10.006 [32] Millero F J. Carbonate constants for estuarine waters[J]. Marine and Freshwater Research, 2010, 61(2): 139−142. doi: 10.1071/MF09254 [33] Dickson A G. Thermodynamics of the dissociation of boric acid in synthetic seawater from 273.15 to 318.15 K[J]. Deep Sea Research Part A. Oceanographic Research Papers, 1990, 37(5): 755−766. doi: 10.1016/0198-0149(90)90004-F [34] Dickson A G, Riley J P. The estimation of acid dissociation constants in seawater media from potentionmetric titrations with strong base. I. The ionic product of water—Kw[J]. Marine Chemistry, 1979, 7(2): 89−99. doi: 10.1016/0304-4203(79)90001-X [35] Uppström L R. The boron/chlorinity ratio of deep-sea water from the Pacific Ocean[J]. Deep Sea Research and Oceanographic Abstracts, 1974, 21(2): 161−162. doi: 10.1016/0011-7471(74)90074-6 [36] Mucci A. The solubility of calcite and aragonite in seawater at various salinities, temperatures, and one atmosphere total pressure[J]. American Journal of Science, 1983, 283(7): 780−799. doi: 10.2475/ajs.283.7.780 [37] Jiang Liqing, Cai Weijun, Wang Yongchen. A comparative study of carbon dioxide degassing in river- and marine‐dominated estuaries[J]. Limnology and Oceanography, 2008, 53(6): 2603−2615. doi: 10.4319/lo.2008.53.6.2603 [38] Hartman B, Hammond D E. Gas exchange in San Francisco Bay[J]. Hydrobiologia, 1985, 129(1): 59−68. doi: 10.1007/BF00048687 [39] Pond S. The exchanges of momentum, heat and moisture at the ocean-atmosphere interface[C]. Proceedings of the Numerical Models of Ocean Circulation, Proceedings of the Symposium National Academy of Sciences. Washington District of Columbia, 1975: 26−88. [40] Wanninkhof R. Relationship between wind speed and gas exchange over the ocean revisited[J]. Limnology and Oceanography: Methods, 2014, 12(6): 351−362. doi: 10.4319/lom.2014.12.351 [41] Guo Xianghui, Wong G T F. Carbonate chemistry in the Northern South China Sea Shelf-sea in June 2010[J]. Deep Sea Research Part II: Topical Studies in Oceanography, 2015, 117: 119−130. doi: 10.1016/j.dsr2.2015.02.024 [42] 赵军鹏, 龚文平, 王道儒. 海南岛南渡江河口的盐水入侵[J]. 海洋学报, 2013, 35(5): 14−28. doi: 10.3969/j.issn.0253-4193.2013.05.002Zhao Junpeng, Gong Wenping, Wang Daoru. Saline intrusion in the Nandu River Estuary, Hainan Island[J]. Haiyang Xuebao, 2013, 35(5): 14−28. doi: 10.3969/j.issn.0253-4193.2013.05.002 [43] Milliman J D, Farnsworth K L. River Discharge to the Coastal Ocean: A Global Synthesis[M]. Cambridge: Cambridge University Press, 2011. [44] Meybeck M. Global chemical weathering of surficial rocks estimated from river dissolved loads[J]. American Journal of Science, 1987, 287(5): 401−428. doi: 10.2475/ajs.287.5.401 [45] Suchet P A, Probst J L, Ludwig W. Worldwide distribution of continental rock lithology: Implications for the atmospheric/soil CO2 uptake by continental weathering and alkalinity river transport to the oceans[J]. Global Biogeochemical Cycles, 2003, 17(2): 1038. [46] Cai Weijun, Guo Xianghui, Chen C T A, et al. A comparative overview of weathering intensity and HCO3− flux in the world's major rivers with emphasis on the Changjiang, Huanghe, Zhujiang(Pearl) and Mississippi Rivers[J]. Continental Shelf Research, 2008, 28(12): 1538−1549. doi: 10.1016/j.csr.2007.10.014 [47] 彭精诚, 郑栩, 吴卫华. 热带海南岛地表和地下化学风化: 对全球碳循环及海水Sr同位素演化研究的启示[J]. 高校地质学报, 2022, 28(6): 849−860.Peng Jingcheng, Zheng Xu, Wu Weihua. Surface and subsurface chemical weathering in tropical Hainan Island: implications for global carbon cycle and seawater Sr isotope evolution[J]. Geological Journal of China Universities, 2022, 28(6): 849−860. [48] Reddy S K K, Gupta H, Reddy D V. Dissolved inorganic carbon export by mountainous tropical rivers of the Western Ghats, India[J]. Chemical Geology, 2019, 530: 119316. doi: 10.1016/j.chemgeo.2019.119316 [49] Gaillardet J, Dupré B, Louvat P, et al. Global silicate weathering and CO2 consumption rates deduced from the chemistry of large rivers[J]. Chemical Geology, 1999, 159(1/4): 3−30. [50] Yao Hongming, Hu Xinping. Responses of carbonate system and CO2 flux to extended drought and intense flooding in a semiarid subtropical estuary[J]. Limnology and Oceanography, 2017, 62(S1): S112−S130. [51] Liu Songlin, Liang Jiening, Jiang Zhijian, et al. Temporal and spatial variations of air-sea CO2 fluxes and their key influence factors in seagrass meadows of Hainan Island, South China Sea[J]. Science of the Total Environment, 2024, 910: 168684. doi: 10.1016/j.scitotenv.2023.168684 [52] Gupta G V M, Sarma V V S S, Robin R S, et al. Influence of net ecosystem metabolism in transferring riverine organic carbon to atmospheric CO2 in a tropical coastal lagoon(Chilka Lake, India)[J]. Biogeochemistry, 2008, 87(3): 265−285. doi: 10.1007/s10533-008-9183-x [53] Tokoro T, Hosokawa S, Miyoshi E, et al. Net uptake of atmospheric CO2 by coastal submerged aquatic vegetation[J]. Global Change Biology, 2014, 20(6): 1873−1884. doi: 10.1111/gcb.12543 [54] Van Dam B, Polsenaere P, Barreras-Apodaca A, et al. Global trends in air-water CO2 exchange over seagrass meadows revealed by atmospheric eddy covariance[J]. Global Biogeochemical Cycles, 2021, 35(4): e2020GB006848. doi: 10.1029/2020GB006848 [55] Erbas T, Marques A, Abril G. A CO2 sink in a tropical coastal lagoon impacted by cultural eutrophication and upwelling[J]. Estuarine, Coastal and Shelf Science, 2021, 263: 107633. doi: 10.1016/j.ecss.2021.107633 [56] Cotovicz Jr L C, Knoppers B A, Régis C R, et al. Eutrophication overcoming carbonate precipitation in a tropical hypersaline coastal lagoon acting as a CO2 sink(Araruama Lagoon, SE Brazil)[J]. Biogeochemistry, 2021, 156(2): 231−254. doi: 10.1007/s10533-021-00842-3 [57] Maher D T, Eyre B D. Carbon budgets for three autotrophic Australian estuaries: Implications for global estimates of the coastal air‐water CO2 flux[J]. Global Biogeochemical Cycles, 2012, 26(1): GB1032. [58] Koné Y J M, Abril G, Kouadio K N, et al. Seasonal variability of carbon dioxide in the rivers and lagoons of ivory coast(West Africa)[J]. Estuaries and Coasts, 2009, 32(2): 246−260. doi: 10.1007/s12237-008-9121-0 [59] Aguirrezabala-Cámpano T, Gonzalez-Valencia R, García-Pérez V, et al. Spatial and seasonal dynamics of the methane cycle in a tropical coastal lagoon and its tributary river[J]. Science of the Total Environment, 2022, 825: 154074. doi: 10.1016/j.scitotenv.2022.154074 [60] Vallejo B, Ponce R, Ortega T, et al. Greenhouse gas dynamics in a coastal lagoon during the recovery of the macrophyte meadow(Mar Menor, SE Spain)[J]. Science of the Total Environment, 2021, 779: 146314. doi: 10.1016/j.scitotenv.2021.146314 [61] Polsenaere P, Delille B, Poirier D, et al. Seasonal, diurnal, and tidal variations of dissolved inorganic carbon and pCO2 in surface waters of a temperate coastal lagoon(Arcachon, SW France)[J]. Estuaries and Coasts, 2023, 46(1): 128−148. doi: 10.1007/s12237-022-01121-6 [62] Vachon D, Sadro S, Bogard M J, et al. Paired O2-CO2 measurements provide emergent insights into aquatic ecosystem function[J]. Limnology and Oceanography Letters, 2020, 5(4): 287−294. doi: 10.1002/lol2.10135 [63] Broecker W S, Peng T H. Gas exchange rates between air and sea[J]. Tellus, 1974, 26(1/2): 21−35. [64] Zeebe R E, Wolf-Gladrow D. CO2 in Seawater: Equilibrium, Kinetics, Isotopes[M]. Oxford: Gulf Professional Publishing, 2001. [65] Jones D C, Ito T, Takano Y, et al. Spatial and seasonal variability of the air-sea equilibration timescale of carbon dioxide[J]. Global Biogeochemical Cycles, 2014, 28(11): 1163−1178. doi: 10.1002/2014GB004813 [66] Wang Xilong, Du Jinzhou. Submarine groundwater discharge into typical tropical lagoons: a case study in eastern Hainan Island, China[J]. Geochemistry, Geophysics, Geosystems, 2016, 17(11): 4366−4382. doi: 10.1002/2016GC006502 [67] 邱广龙, 范航清, 李宗善, 等. 濒危海草贝克喜盐草的种群动态及土壤种子库——以广西珍珠湾为例[J]. 生态学报, 2013, 33(19): 6163−6172. doi: 10.5846/stxb201306091489Qiu Guanglong, Fan Hangqing, Li Zongshan, et al. Population dynamics and seed banks of the threatened seagrass Halophila beccarii in Pearl Bay, Guangxi[J]. Acta Ecologica Sinica, 2013, 33(19): 6163−6172. doi: 10.5846/stxb201306091489 [68] 耿晓晓. 海南岛贝克喜盐草的空间分布特性及保护价值研究[D]. 三亚: 海南热带海洋学院, 2023.Geng Xiaoxiao. Spatial distribution characteristics and protection value of Halophila beccarii around Hainan Island[D]. Sanya: Hainan Tropical Ocean University, 2023. [69] Delille B, Delille D, Fiala M, et al. Seasonal changes of pCO2 over a subantarctic Macrocystis kelp bed[J]. Polar Biology, 2000, 23(10): 706−716. doi: 10.1007/s003000000142 [70] Setchell W A. Ruppia and its environmental factors[J]. Proceedings of the National Academy of Sciences of the United States of America, 1924, 10(6): 286−288. [71] Menéndez M, Martı́nez M, Comı́n F A. A comparative study of the effect of pH and inorganic carbon resources on the photosynthesis of three floating macroalgae species of a Mediterranean coastal lagoon[J]. Journal of Experimental Marine Biology and Ecology, 2001, 256(1): 123−136. doi: 10.1016/S0022-0981(00)00313-0 [72] Middelboe A L, Hansen P J. High pH in shallow-water macroalgal habitats[J]. Marine Ecology Progress Series, 2007, 338: 107−117. doi: 10.3354/meps338107 [73] Björk M, Axelsson L, Beer S. Why is Ulva intestinalis the only macroalga inhabiting isolated rockpools along the Swedish Atlantic coast?[J]. Marine Ecology Progress Series, 2004, 284: 109−116. doi: 10.3354/meps284109 [74] Su Jianzhong, Cai Weijun, Brodeur J, et al. Chesapeake Bay acidification buffered by spatially decoupled carbonate mineral cycling[J]. Nature Geoscience, 2020, 13(6): 441−447. doi: 10.1038/s41561-020-0584-3 -

计量
- 文章访问数: 369
- HTML全文浏览量: 196
- PDF下载量: 61
- 被引次数: 0
