

Strength and control factors of carbon source/sinks in the China margin seas
-
摘要: 基于观测和大数据机器学习的研究表明,中国陆架边缘海(渤海、黄海、东海和南海)的年均碳汇强度为−10.2±4.4 TgC/a。黄海、东海和南海北部全年吸收大气CO2,而渤海、南海南部和长江口沿岸向大气释放CO2。东海碳汇最强,平均通量为−10.5±4.5 TgC/a,黄海碳汇较小,为−2.1±0.9 TgC/a。面积最小的渤海碳源为+0.3±0.1 TgC/a,而面积最大的南海其碳源强度为+2.0±0.9 TgC/a。从季节上看,冬季我国边缘海碳汇强度最大,为−45.7±19.7 TgC/a,春季较弱,为−16.9±7.3 TgC/a。而夏季和秋季我国边缘海整体为碳源,平均分别为+11.9±5.1 TgC/a和+9.9±4.3 TgC/a。中国陆架边缘海碳源汇强度平均不确定度为±43.0%(±4.4 TgC a−1),比以往用局部海域观测数据导致的平均90.5%的不确定度,基于观测数据机器学习构建格点数据的估算结果不确定度降低了47.5%。海-气界面CO2分压差的差异和由风速引起的CO2交换速率差异是导致我国边缘海海-气界面碳源汇时空变化的关键,究其根本是源于水文动力、陆源输入、浮游生物群落及大洋跨陆架输送等多种因素和过程对我国边缘海海-气碳交换的控制作用。
-
关键词:
- 碳源汇强度 /
- 海气界面二氧化碳通量 /
- 控制因素 /
- 中国陆架边缘海
Abstract: Research based on observation and machine learning shows that the average annual carbon sink intensity of the China marginal seas (Bohai Sea, Yellow Sea, East China Sea and South China Sea) is −10.2±4.4 TgC/a. The Yellow Sea, the East China Sea and the northern region of the South China Sea absorb atmospheric CO2, while the Bohai Sea, the southern South China Sea and the Yangtze River Estuary release CO2 into the atmosphere. The East China Sea carbon sinks are the strongest, with an average flux of −10.5±4.5 TgC/a, and the Yellow Sea carbon sinks are relatively small, −2.1±0.9 TgC/a. The smallest carbon source appeared in the Bohai Sea is +0.3±0.1 TgC/a, while the largest carbon source intensity appeared in the South China Sea is +2.0±0.9 TgC/a. According to seasonal change, the carbon sink intensity in winter is the highest in the China margin seas, with −45.7±19.7 TgC/a, and weaker in spring, at −16.9±7.3 TgC/a. In summer and autumn, China's marginal seas as a whole are carbon sources, with an average of +11.9±5.1 TgC/a and +9.9±4.3 TgC/a respectively. The average uncertainty of carbon source sink strength in China marginal seas is ±43.0% (±4.4 TgC a−1) in the estimation results of constructing lattiness data based on observation data and machine learning, which is 47.5% of the reduced uncertainty less than 90.5% of the average uncertainty by only regional observation data. The difference of PCO2 at the sea-air interface and the difference in the CO2 exchange rate caused by wind speed are the key controlling factors of carbon source/sink in the China marginal seas. In fact, they are controlled by the basic factors and processes such as hydrodynamics, land-based source input, plankton communities and ocean-shelf transportation. -

图 1 中国陆架边缘海表层海水pCO2实测数据站位
Fig. 1 PCO2 measured stations of seawater on the surface of the China margin seas

图 2 基于现场观测的机器学习构建格点数据的我国陆架边缘海碳源汇估算体系
Fig. 2 Carbon source/sink estimation system based on on-site observation and machine learning construction grid data of the China margin seas

图 3 集成学习广义回归-前反馈神经网络算法结构
Fig. 3 General regression neural network approach to reconstruct structure

图 4 我国陆架边缘海季节平均海-气界面CO2分压差空间分布(春、夏、秋、冬)
Fig. 4 Seasonal average sea-air interface CO2 pressure difference spatial distributions (spring, summer, autumn, winter)

图 5 我国陆架边缘海主要海域平均海-气界面CO2分压差年际变化
Fig. 5 Annual variations of pCO2 difference in the China margin seas

图 6 中国陆架边缘海季节平均海-气界面CO2传输速率空间分布(cm/h)
Fig. 6 Spatial distributions of the average CO2 transmission rates at sea-air interface of the China margin seas

图 7 中国陆架边缘海平均海-气界面CO2交换速率年际变化
Fig. 7 Inter-annual changes in the average CO2 exchange rates of the sea-air interface on the China margin seas

图 8 2003−2022年中国陆架边缘海平均碳源汇分布格局(渤黄东南海平均总碳通量)(BS:渤海; YS:黄海; ECS:东海; SCS:南海)
Fig. 8 Distributions of the average carbon source/ sink in China margin seas from 2003 to 2022 (the average CO2 fluxes of the Bohai Sea, the Yellow Sea, the East China Sea and the South China Sea)

图 9 中国边缘海碳源汇强度季节变化(mol m−2 a−1)
Fig. 9 Seasonal changes of the carbon/sinks strength in China margin seas(mol m−2 a−1)

图 10 中国边缘海海-气界面碳通量年际变化
Fig. 10 Annual changes in CO2 fluxes across the sea-air interface on China margin seas

图 11 近20年来我国陆架边缘海碳源汇分布的演化(mol m−2 a−1)
Fig. 11 The distribution evolution of CO2 fluxes of China margin seas in the past 20 years (mol m−2 a−1)
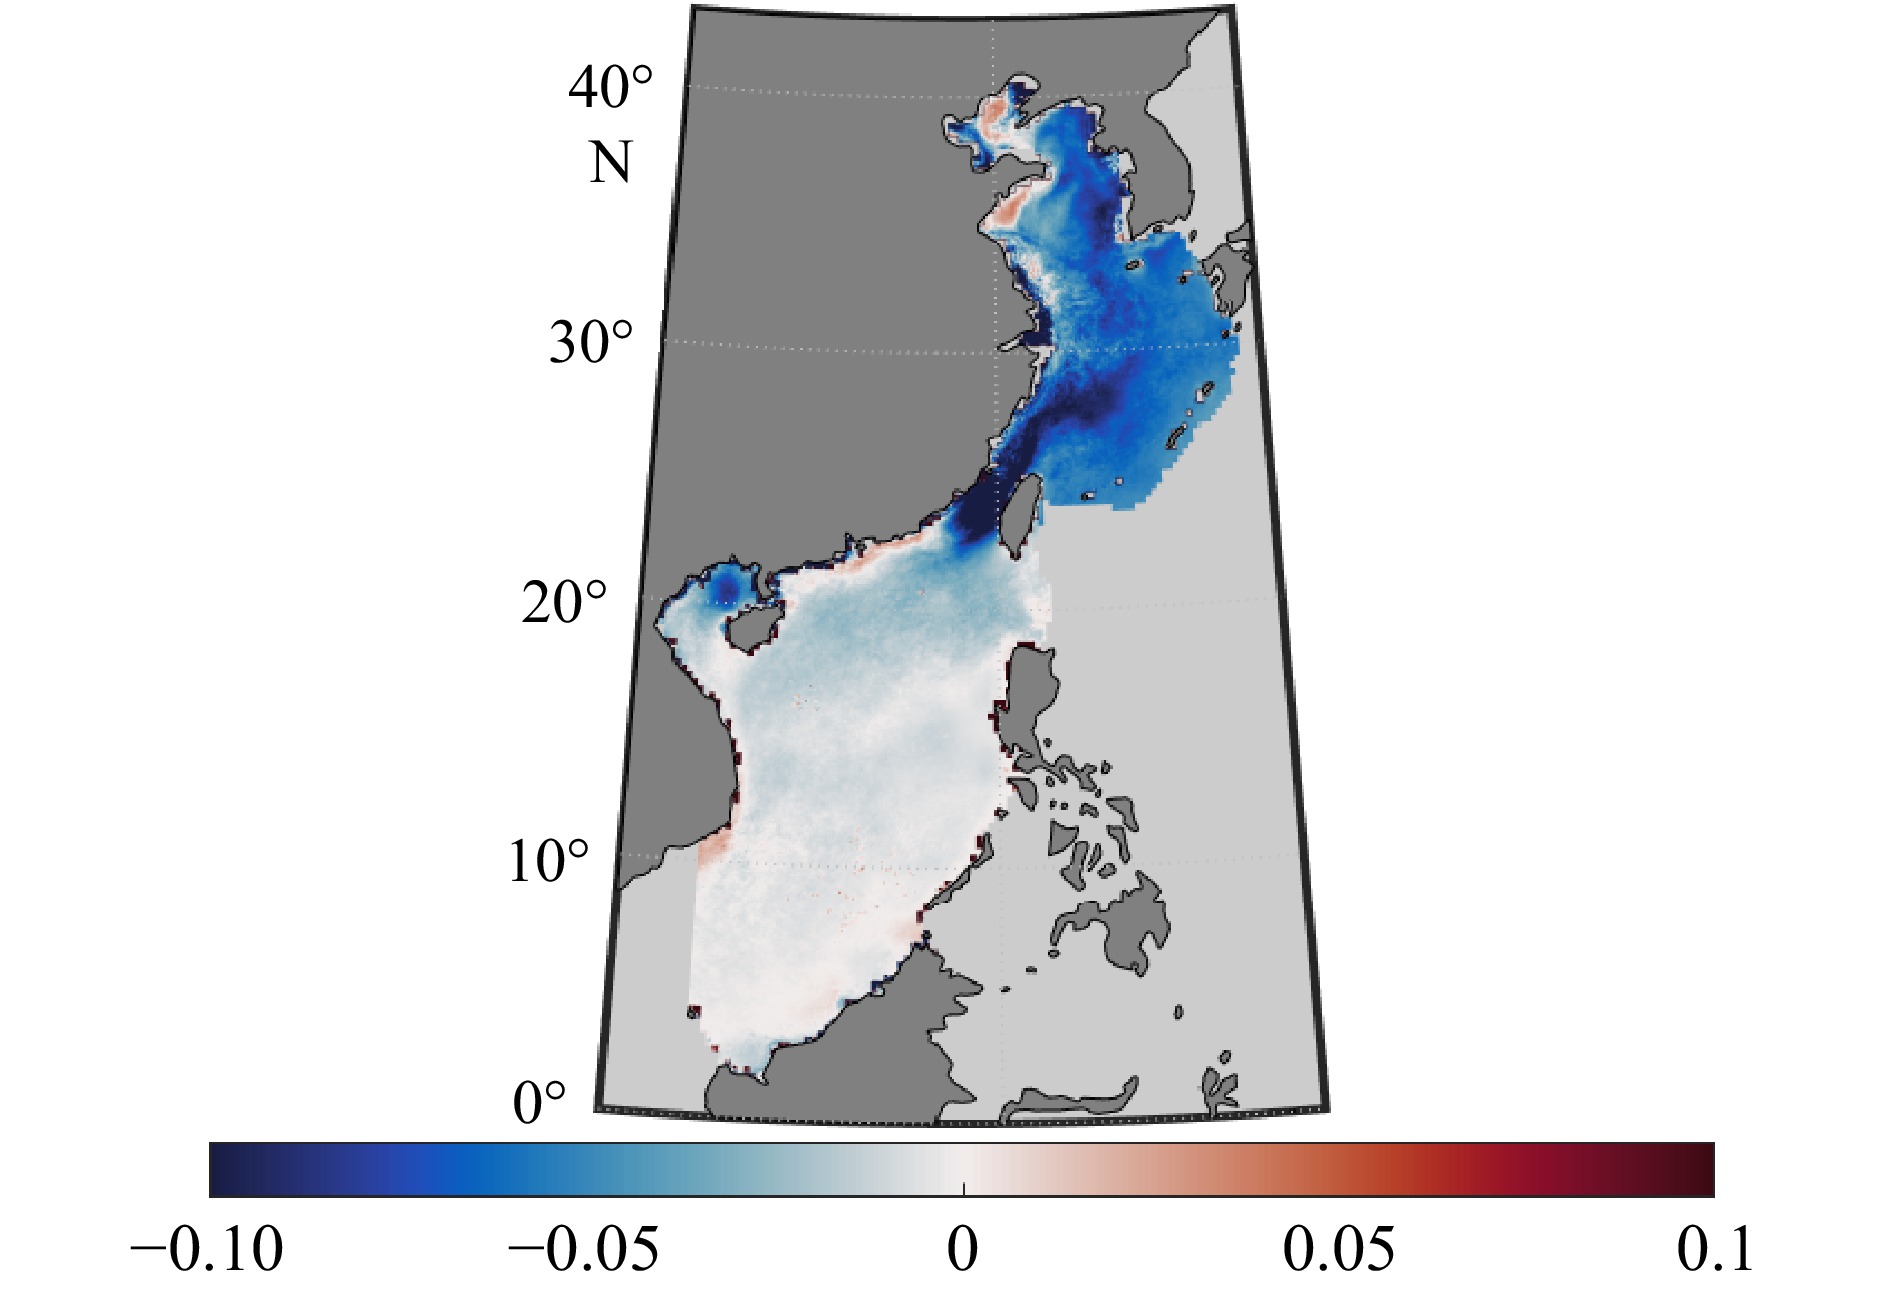
图 12 我国陆架边缘海碳源汇强度年际变化趋势的空间分布(mol m−2 a−2)
Fig. 12 Spatial distributions of the annual variation trend of carbon source/sink strength in China margin seas
表 1 2003-2022年间中国陆架边缘海长期平均碳源汇强度(TgC a−1)
Tab. 1 Average carbon source/sink strength of China margin seas from 2003 to 2022
海域 春季 夏季 秋季 冬季 全年平均 渤海 −0.4±0.2 0.5±0.2 1.2±0.5 0.1±0.0 0.3±0.1 黄海 −4.6±2.0 −1.2±0.5 0.1±0.0 −2.8±1.2 −2.1±0.9 东海 −15.1±6.5 −0.3±0.1 −1.7±0.7 −24.8±10.7 −10.5±4.5 南海 3.2±1.4 12.9±5.6 10.4±4.5 −18.2±7.8 2.1±0.9 中国陆架边缘海 −16.9±7.3 11.9±5.1 9.9±4.3 −45.8±19.7 −10.2±4.4  下载: 导出CSV
表 2 近20年来中国陆架边缘海碳源汇强度年际变化(TgC a−1)
Tab. 2 Annual changes of carbon source/sinks strength of China margin seas in the past 20 years(TgC a−1)
年度 渤海 黄海 东海 南海 中国陆架边缘海 2003 0.7±0.5 0.6±0.4 −4.4±3.0 3.6±2.4 0.5±0.3 2004 0.5±1.8 −0.2±0.9 −4.1±15.4 4.2±15.5 0.3±1.1 2005 0.1±0.1 −1.4±1.2 −4.4±3.8 3.1±2.7 −2.5±2.2 2006 0.4±0.1 −1.5±0.3 −5.3±1.0 3.7±0.7 −2.7±0.5 2007 0.6±0.3 −0.8±0.4 −5.5±2.6 2.8±1.3 −2.9±1.3 2008 0.4±0.2 −0.9±0.5 −4.8±2.7 0.2±0.1 −5.1±2.9 2009 0.5±0.1 −1.3±0.2 −5.9±1.1 2.0±0.4 −4.6±0.8 2010 0.5±0.2 −2.4±1.0 −9.6±4.0 1.8±0.8 −9.6±4.0 2011 0.4±0.1 −2.7±1.1 −8.1±3.3 0.8±0.3 −9.7±3.9 2012 0.3±0.1 −2.5±0.7 −8.5±2.5 3.8±1.1 −6.8±2.0 2013 0.2±0.1 −2.1±0.8 −7.5±2.9 2.9±1.1 −6.5±2.5 2014 0.3±0.1 −1.9±0.6 −11.9±3.5 2.8±0.8 −10.7±3.2 2015 0.4±0.2 −1.9±0.8 −12.5±5.1 3.4±1.4 −10.7±4.4 2016 0.5±0.2 −2.5±0.8 −12.0±3.9 3.3±1.1 −10.7±3.5 2017 0.5±0.2 −1.7±0.6 −12.2±4.3 0.7±0.2 −12.7±4.5 2018 0.3±0.1 −2.4±1.0 −12.9±5.2 −0.1±0.0 −15.2±6.1 2019 0.3±0.1 −2.3±0.6 −12.8±3.6 −0.5±0.2 −15.3±4.4 2020 0.0±0.0 −4.0±2.3 −16.1±9.1 −4.9±2.8 −25.1±14.2 2021 0.0±0.0 −4.5±2.3 −17.0±8.7 −5.5±2.8 −27.0±13.9 2022 −0.1±0.1 −5.3±2.4 −16.9±7.6 −3.8±1.7 −26.3±11.9
下载: 导出CSV
-
[1] 宋金明, 曲宝晓, 李学刚, 等. 海洋碳汇观测与评估的现状与思考[J]. 海洋科学进展, 2023, 41(4): 577−592. doi: 10.12362/j.issn.1671-6647.20230210001Song Jinming, Qu Baoxiao, Li Xuegang, et al. Estimate of ocean carbon sink: current status and reflections[J]. Advances in Marine Science, 2023, 41(4): 577−592. doi: 10.12362/j.issn.1671-6647.20230210001 [2] 宋金明, 李学刚, 袁华茂, 等. 中国近海生物固碳强度与潜力[J]. 生态学报, 2008, 28(2): 551−558. doi: 10.3321/j.issn:1000-0933.2008.02.013Song Jinming, Li Xuegang, Yuan Huamao, et al. Carbon fixed by phytoplankton and cultured algae in China coastal seas[J]. Acta Ecologica Sinica, 2008, 28(2): 551−558. doi: 10.3321/j.issn:1000-0933.2008.02.013 [3] Song Jinming. Biogeochemical Processes of Biogenic Elements in China Marginal Seas[M]. Berlin, Heidelberg: Springer, 2010: 1−662. [4] Wanninkhof R. Relationship between wind speed and gas exchange over the ocean[J]. Journal of Geophysical Research: Oceans, 1992, 97(C5): 7373−7382. doi: 10.1029/92JC00188 [5] Weiss R F. Carbon dioxide in water and seawater: the solubility of a non-ideal gas[J]. Marine Chemistry, 1974, 2(3): 203−215. doi: 10.1016/0304-4203(74)90015-2 [6] 钟国荣, 李学刚, 曲宝晓, 等. 基于广义回归神经网络的全球表层海水1°×1°二氧化碳分压数据推演[J]. 海洋学报, 2020, 42(10): 70−79.Zhong Guorong, Li Xuegang, Qu Baoxiao, et al. A general regression neural network approach to reconstruct global 1°×1° resolution sea surface pCO2[J]. Haiyang Xuebao, 2020, 42(10): 70−79. [7] Landschützer P, Gruber N, Bakker D C E, et al. Recent variability of the global ocean carbon sink[J]. Global Biogeochemical Cycles, 2014, 28(9): 927−949. doi: 10.1002/2014GB004853 [8] Chen Shuangling, Hu Chuanmin, Barnes B B, et al. A machine learning approach to estimate surface ocean pCO2 from satellite measurements[J]. Remote Sensing of Environment, 2019, 228: 203−226. doi: 10.1016/j.rse.2019.04.019 [9] Gregor L, Gruber N. OceanSODA-ETHZ: a global gridded data set of the surface ocean carbonate system for seasonal to decadal studies of ocean acidification[J]. Earth System Science Data, 2021, 13(2): 777−808. doi: 10.5194/essd-13-777-2021 [10] Iida Y, Takatani Y, Kojima A, et al. Global trends of ocean CO2 sink and ocean acidification: an observation-based reconstruction of surface ocean inorganic carbon variables[J]. Journal of Oceanography, 2021, 77(2): 323−358. doi: 10.1007/s10872-020-00571-5 [11] Zhong Guorong, Li Xuegang, Song Jinming, et al. Reconstruction of global surface ocean pCO2 using region-specific predictors based on a stepwise FFNN regression algorithm[J]. Biogeosciences, 2022, 19(3): 845−859. doi: 10.5194/bg-19-845-2022 [12] Wang Zhixuan, Wang Guizhi, Guo Xianghui, et al. Spatial reconstruction of long-term (2003-2020) sea surface pCO2 in the South China Sea using a machine-learning-based regression method aided by empirical orthogonal function analysis[J]. Earth System Science Data, 2023, 15(4): 1711−1731. doi: 10.5194/essd-15-1711-2023 [13] Zhong Guorong, Li Xuegang, Song Jinming, et al. The Southern Ocean carbon sink has been overestimated in the past three decades[J]. Communications Earth & Environment, 2024, 5(1): 398. [14] Landschützer P, Laruelle G G, Roobaert A, et al. A uniform pCO2 climatology combining open and coastal oceans[J]. Earth System Science Data, 2020, 12(4): 2537−2553. doi: 10.5194/essd-12-2537-2020 [15] Watson A J, Schuster U, Shutler J D, et al. Revised estimates of ocean-atmosphere CO2 flux are consistent with ocean carbon inventory[J]. Nature Communications, 2020, 11(1): 4422. doi: 10.1038/s41467-020-18203-3 [16] Dickson A G, Sabine C L, Christian J R. Determination of p(CO2) in air that is in equilibrium with a discrete sample of sea water[M]//Dickson A G, Sabine C L, Christian J R. Guide to Best Practices for Ocean CO2 Measurements. Sidney: North Pacific Marine Science Organization, 2007: 7−8. [17] Lan X, Tans P, Thoning K, et al. NOAA greenhouse gas marine boundary layer reference-CO2 data sets[DB/OL]. Boulder: NOAA GML, (2023). https://doi.org/10.15138/DVNP-F961. (查阅网上资料,未找到本条文献作者、引用日期信息,请确认) [18] Woolf D K, Land P E, Shutler J D, et al. On the calculation of air-sea fluxes of CO2 in the presence of temperature and salinity gradients[J]. Journal of Geophysical Research: Oceans, 2016, 121(2): 1229−1248. doi: 10.1002/2015JC011427 [19] Wanninkhof R. Relationship between wind speed and gas exchange over the ocean[J]. Journal of Geophysical Research: Oceans, 1992, 97(C5): 7373−7382. (查阅网上资料, 本条文献与第4条文献重复, 请确认) [20] Hersbach H, Bell B, Berrisford P, et al. The ERA5 global reanalysis[J]. Quarterly Journal of the Royal Meteorological Society, 2020, 146(730): 1999−2049. doi: 10.1002/qj.3803 [21] Sweeney C, Gloor E, Jacobson A R, et al. Constraining global air-sea gas exchange for CO2 with recent bomb 14C measurements[J]. Global Biogeochemical Cycles, 2007, 21(2): GB2015. [22] Takahashi T, Sutherland S C, Wanninkhof R, et al. Climatological mean and decadal change in surface ocean pCO2, and net sea–air CO2 flux over the global oceans[J]. Deep Sea Research Part II: Topical Studies in Oceanography, 2009, 56(8/10): 554−577. [23] Ho D T, Wanninkhof R, Schlosser P, et al. Toward a universal relationship between wind speed and gas exchange: gas transfer velocities measured with 3He/SF6 during the Southern Ocean Gas Exchange Experiment[J]. Journal of Geophysical Research: Oceans, 2011, 116(C4): C00F04. [24] Woolf D K, Shutler J D, Goddijn-Murphy L, et al. Key uncertainties in the recent air‐sea flux of CO2[J]. Global Biogeochemical Cycles, 2019, 33(12): 1548−1563. doi: 10.1029/2018GB006041 [25] Dai Minhan, Su Jianzhong, Zhao Yangyang, et al. Carbon fluxes in the coastal ocean: synthesis, boundary processes, and future trends[J]. Annual Review of Earth and Planetary Sciences, 2022, 50: 593−626. doi: 10.1146/annurev-earth-032320-090746 [26] Zhang Longjun, Xue Liang, Song Meiqin, et al. Distribution of the surface partial pressure of CO2 in the southern Yellow Sea and its controls[J]. Continental Shelf Research, 2010, 30(3/4): 293−304. [27] Qu Baoxiao, Song Jinming, Yuan Huamao, et al. Air-sea CO2 exchange process in the southern Yellow Sea in April of 2011, and June, July, October of 2012[J]. Continental Shelf Research, 2014, 80: 8−19. doi: 10.1016/j.csr.2014.02.001 [28] Qu Baoxiao, Song Jinming, Yuan Huamao, et al. Summer carbonate chemistry dynamics in the Southern Yellow Sea and the East China Sea: regional variations and controls[J]. Continental Shelf Research, 2015, 111: 250−261. doi: 10.1016/j.csr.2015.08.017 [29] Xu Xuemei, Zang Kunpeng, Zhao Huade, et al. Monthly CO2 at A4HDYD station in a productive shallow marginal sea (Yellow Sea) with a seasonal thermocline: controlling processes[J]. Journal of Marine Systems, 2016, 159: 89−99. doi: 10.1016/j.jmarsys.2016.03.009 [30] Tsunogai S, Watanabe S, Nakamura J, et al. A preliminary study of carbon system in the East China Sea[J]. Journal of Oceanography, 1997, 53(1): 9−17. doi: 10.1007/BF02700744 [31] Chou Wenchen, Gong G C, Tseng C M, et al. The carbonate system in the East China Sea in winter[J]. Marine Chemistry, 2011, 123(1/4): 44−55. [32] 曲宝晓, 宋金明, 袁华茂, 等. 东海海-气界面二氧化碳通量的季节变化与控制因素研究进展[J]. 地球科学进展, 2013, 28(7): 783−793. doi: 10.11867/j.issn.1001-8166.2013.07.0783Qu Baoxiao, Song Jinming, Yuan Huamao, et al. Advances of seasonal variations and controlling factors of the air-sea CO2 flux in the East China Sea[J]. Advances in Earth Science, 2013, 28(7): 783−793. doi: 10.11867/j.issn.1001-8166.2013.07.0783 [33] Guo X H, Zhai W D, Dai M H, et al. Air–sea CO2 fluxes in the East China Sea based on multiple-year underway observations[J]. Biogeosciences, 2015, 12(18): 5495−5514. doi: 10.5194/bg-12-5495-2015 [34] Zhai Weidong, Dai Minhan, Cai Weijun, et al. The partial pressure of carbon dioxide and air–sea fluxes in the northern South China Sea in spring, summer and autumn[J]. Marine Chemistry, 2005, 96(1/2): 87−97. [35] Zhu Yu, Shang Shaoling, Zhai Weidong, et al. Satellite-derived surface water pCO2 and air–sea CO2 fluxes in the northern South China Sea in summer[J]. Progress in Natural Science, 2009, 19(6): 775−779. doi: 10.1016/j.pnsc.2008.09.004 [36] Hung J J, Wang Y J, Tseng C M, et al. Controlling mechanisms and cross linkages of ecosystem metabolism and atmospheric CO2 flux in the northern South China Sea[J]. Deep Sea Research Part I: Oceanographic Research Papers, 2020, 157: 103205. doi: 10.1016/j.dsr.2019.103205 [37] 邢建伟, 宋金明. 大气溶解有机碳湿沉降及其在海洋碳中和中的作用[J]. 中国环境科学, 2025, 45(2): 606−618. doi: 10.3969/j.issn.1000-6923.2025.02.002Xing Jianwei, Song Jinming. Wet deposition of atmospheric dissolved organic carbon and its role in marine carbon neutralization[J]. China Environmental Science, 2025, 45(2): 606−618. doi: 10.3969/j.issn.1000-6923.2025.02.002 [38] 卢汐, 宋金明, 袁华茂, 等. 黑潮与毗邻陆架海域的碳交换[J]. 地球科学进展, 2015, 30(2): 214−225.Lu Xi, Song Jinming, Yuan Huamao, et al. Carbon distribution and exchange of Kuroshio and adjacent China sea shelf: a review[J]. Advances in Earth Science, 2015, 30(2): 214−225. [39] 卢汐, 宋金明, 袁华茂, 等. 黑潮主流径海域海水中的无机碳及其对东海陆架区的影响[J]. 海洋与湖沼, 2016, 47(1): 16−28.Lu Xi, Song Jinming, Yuan Huamao, et al. Distribution of inorganic carbon parameters in Kuroshio and its impact on adjacent East China Sea shelf[J]. Oceanologia et Limnologia Sinica, 2016, 47(1): 16−28. -

计量
- 文章访问数: 28
- HTML全文浏览量: 14
- PDF下载量: 3
- 被引次数: 0
