

Observations of turbulent mixing in the Bohai Sea during weakly stratified period
-
摘要: 利用2017年9月在渤海共享航次中取得的湍流混合直接观测数据,本文研究了渤海海域湍流混合的空间分布特征及有关的影响因素。9月观测海区水体垂向层结较弱,莱州湾受黄河冲淡水影响出现高温低盐结构,位于渤海中央浅滩南北两侧洼地的双中心冷水结构依旧存在。湍流观测结果表明湍动能耗散率在10−9~10−5 W/kg之间变化,统计上满足对数正态分布。耗散率强值区出现在辽东湾及渤海湾湾口近岸处,相应的垂向湍扩散系数约为10−6~10−2 m2/s。垂向上,水体表、底层混合较强,进一步研究发现弱层化水体的平均湍动能耗散率〈ε〉与风速和正压潮流速的大小存在正相关关系。另一方面,耗散率ε与浮性频率N近似满足
$\varepsilon = 2.0 \times {10^{ - 8}} + 3.0 \times {10^{ - 7}}{({N^2}/N_0^2)^{ - 5}}$ 的拟合函数关系,反映了层化对水体垂向混合的抑制作用。Abstract: Based on the direct turbulence observations in the Bohai Sea during September 2017, this study investigates the spatial distribution of turbulent mixing in the Bohai Sea and the associated influencing factors. The water column was weakly stratified during the observation period. As influenced by the freshwater input from Yellow River, relatively warm and fresh water was found in the Laizhou Bay. The typical south-north dual-core cold bottom water structure still exited in the central Bohai Sea during the observation period. The observed turbulent kinetic energy (TKE) dissipation rate ε ranged from 10−9 to 10−5 W/kg and statistically satisfied the lognormal distribution. Intensified mixing was found at the nearshore region of the Liaodong Bay and the Bohai Bay. The corresponding vertical eddy diffusivity was about 10−6~10−2 m2/s. In the vertical direct direction, strong mixing occurred near the sea surface and bottom layers. Further analysis shows that the station-averaged TKE dissipation rate are positively related to the wind speed and barotropic tidal velocity. On the other hand, the dissipation rate and buoyancy frequency N satisfied the power function relationship of$\varepsilon = 2.0 \times {10^{ - 8}} + 3.0 \times {10^{ - 7}}{({N^2}/N_0^2)^{ - 5}}$ indicating that inhibition effect of stratification on turbulent mixing. -
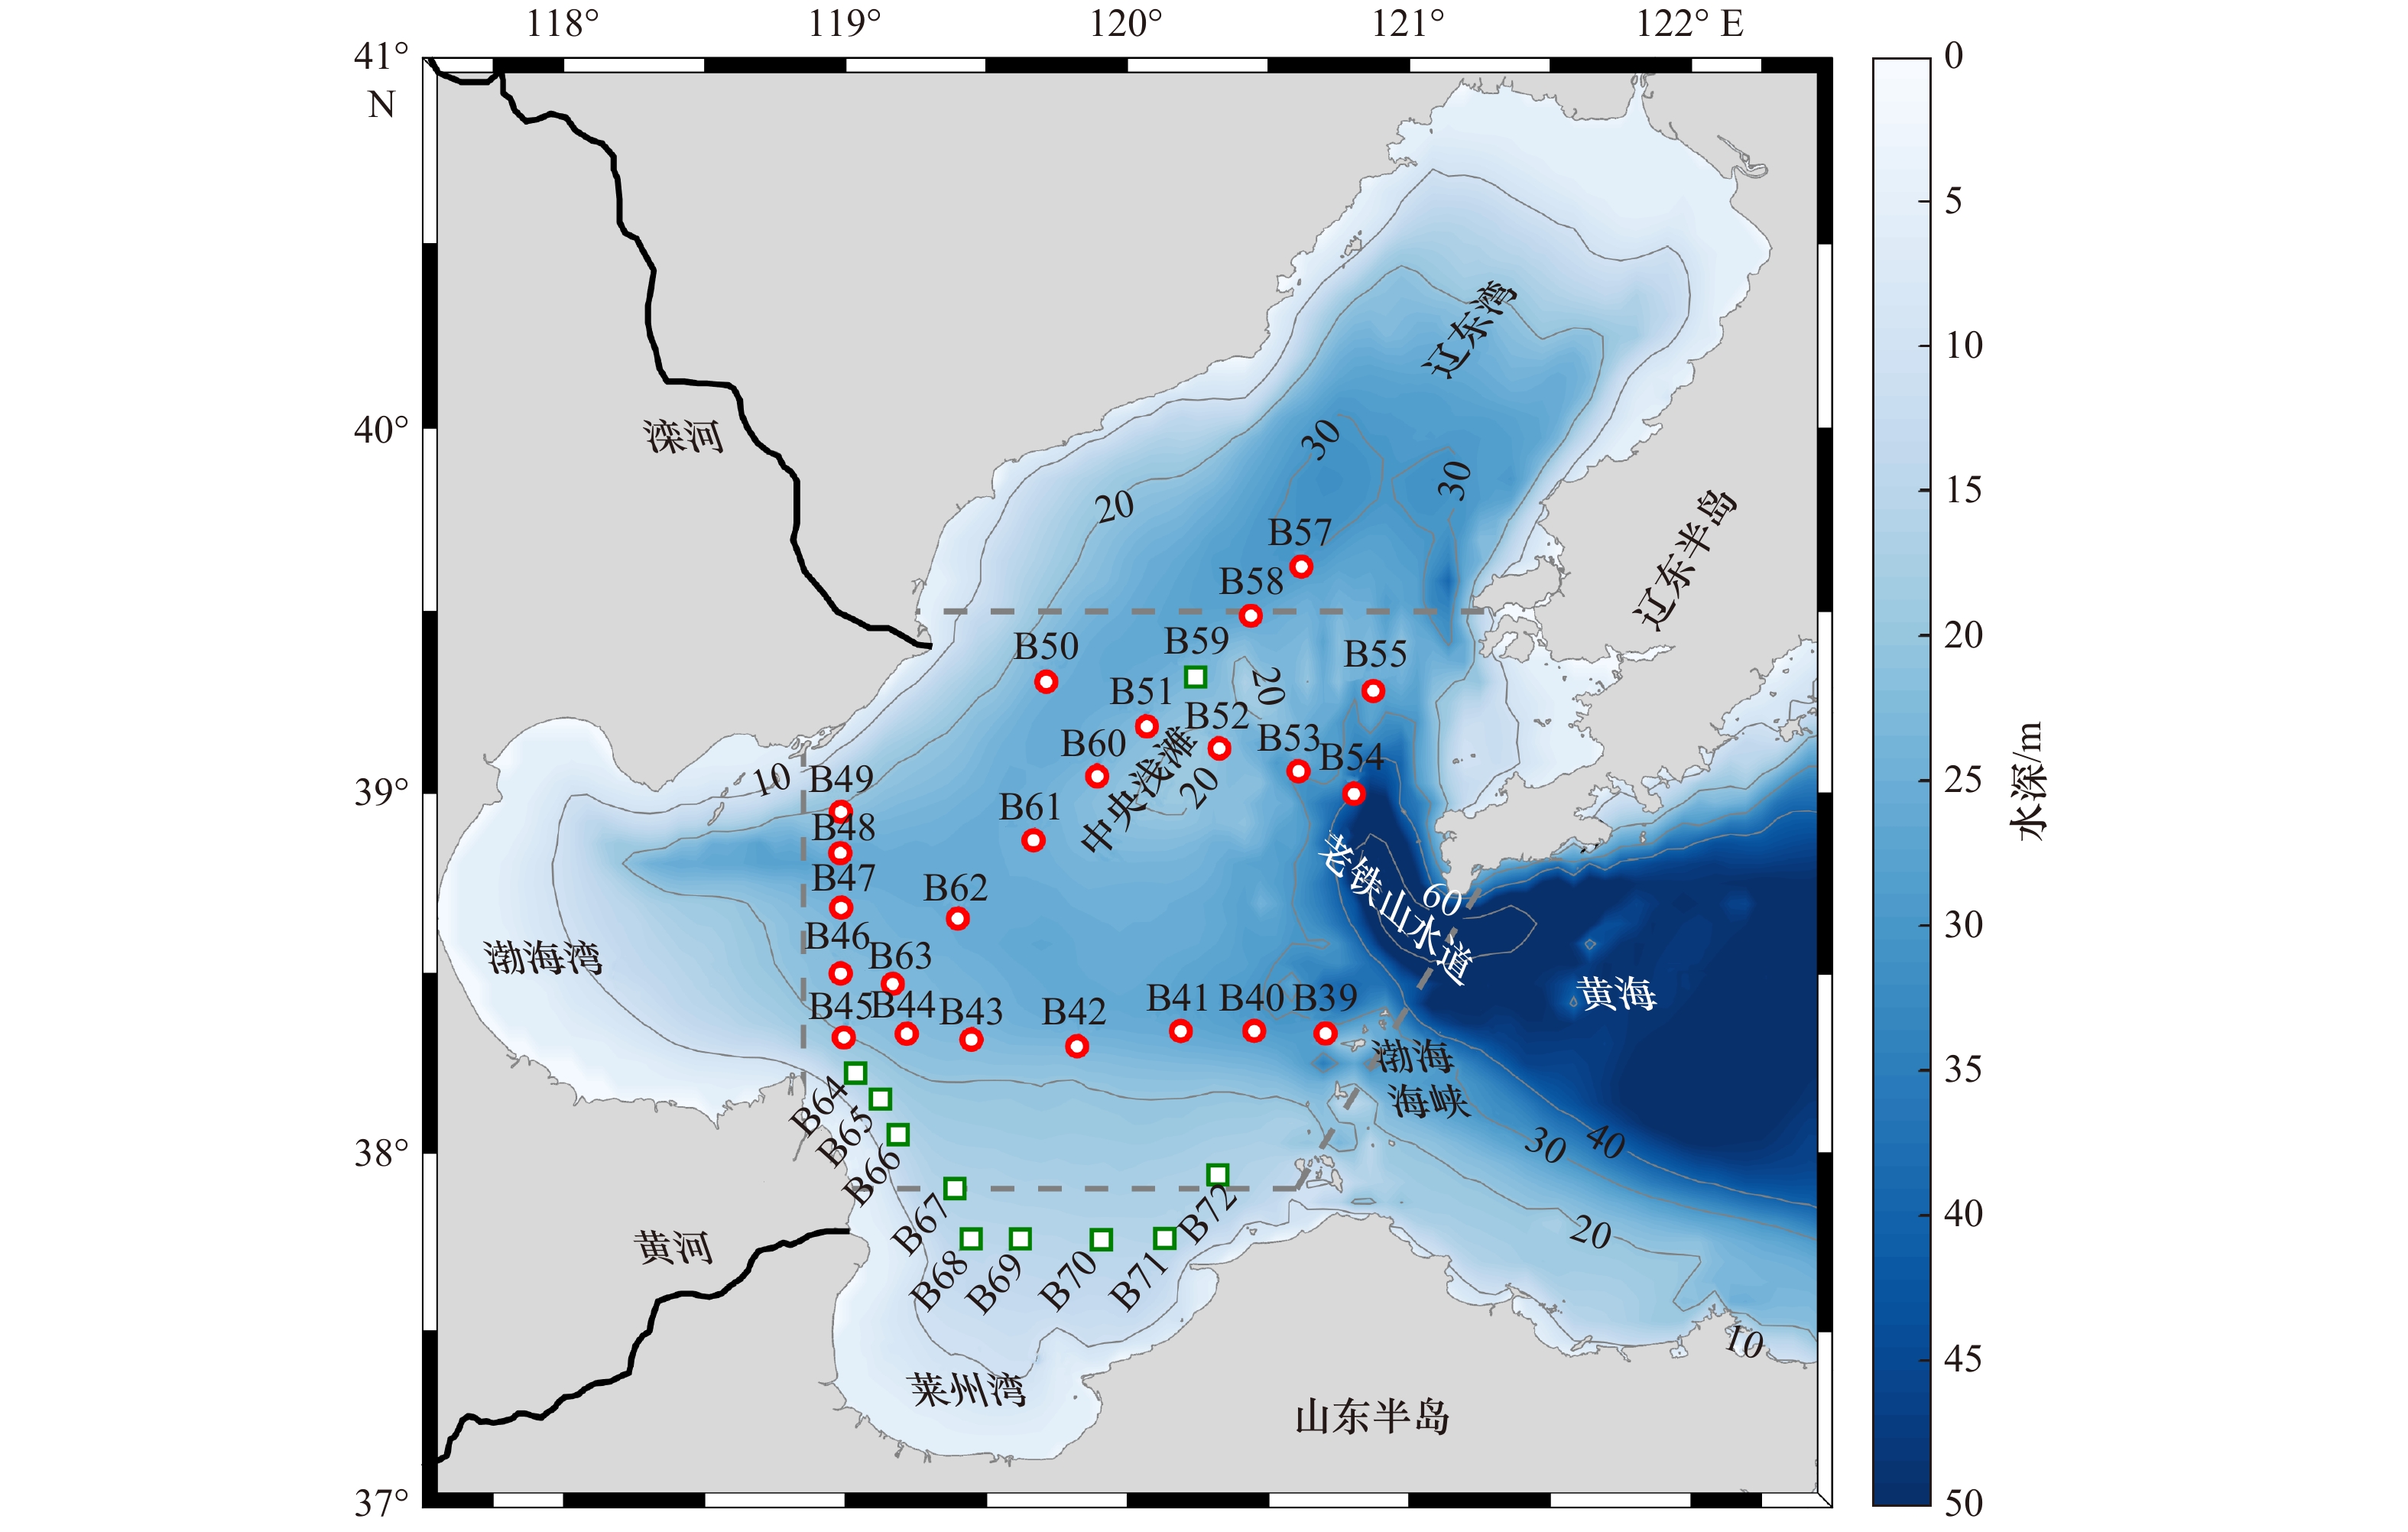
图 1 渤海观测站位分布
红色圆圈为同时包含VMP与CTD观测的站位,绿色方块为只进行CTD观测的站位,背景颜色代表水深,根据前人研究[20],用虚线框将中央海盆与莱州湾、渤海湾以及辽东湾区别开来
Fig. 1 Distribution of observation stations in the Bohai Sea
Location of the stations that have both VMP and CTD measurements are denoted by the red circles. Other stations with only CTD measurements are denoted by green squares. Consistent with the previous study[20], the dashed lines separate the Laizhou Bay, Bohai Bay, Liaodong Bay from the central region

图 2 B54站位原始剪切剖面(a);不同深度范围的实测剪切波数谱(蓝色虚线)与对应的理论Nasmyth谱(红色虚线),红色三角表示剪切谱的积分上限(b~e);耗散率
$\varepsilon $ (橘黄实线)与位势密度${\sigma _\theta }$ (灰线)剖面(f)Fig. 2 The profile of the raw shear at Station B54 (a); the shear spectra at wavenumber space (blue dashed lines) and the corresponding Nasmyth spectra (red dotted lines) calculated within different depth ranges, the red triangles indicate the upper limits of integration (b−e); the profiles of the calculated dissipation rate
$\varepsilon $ (orange line) and potential density${\sigma _\theta }$ (gray line) (f)
图 3 温度(a)、盐度(b)、位势密度(c)以及浮性频率平方N2(d)三维空间分布
Fig. 3 Spatial distribution of temperature (a), salinity(b), potential density (c) and squared buoyancy frequency N2 (d) in a 3D view
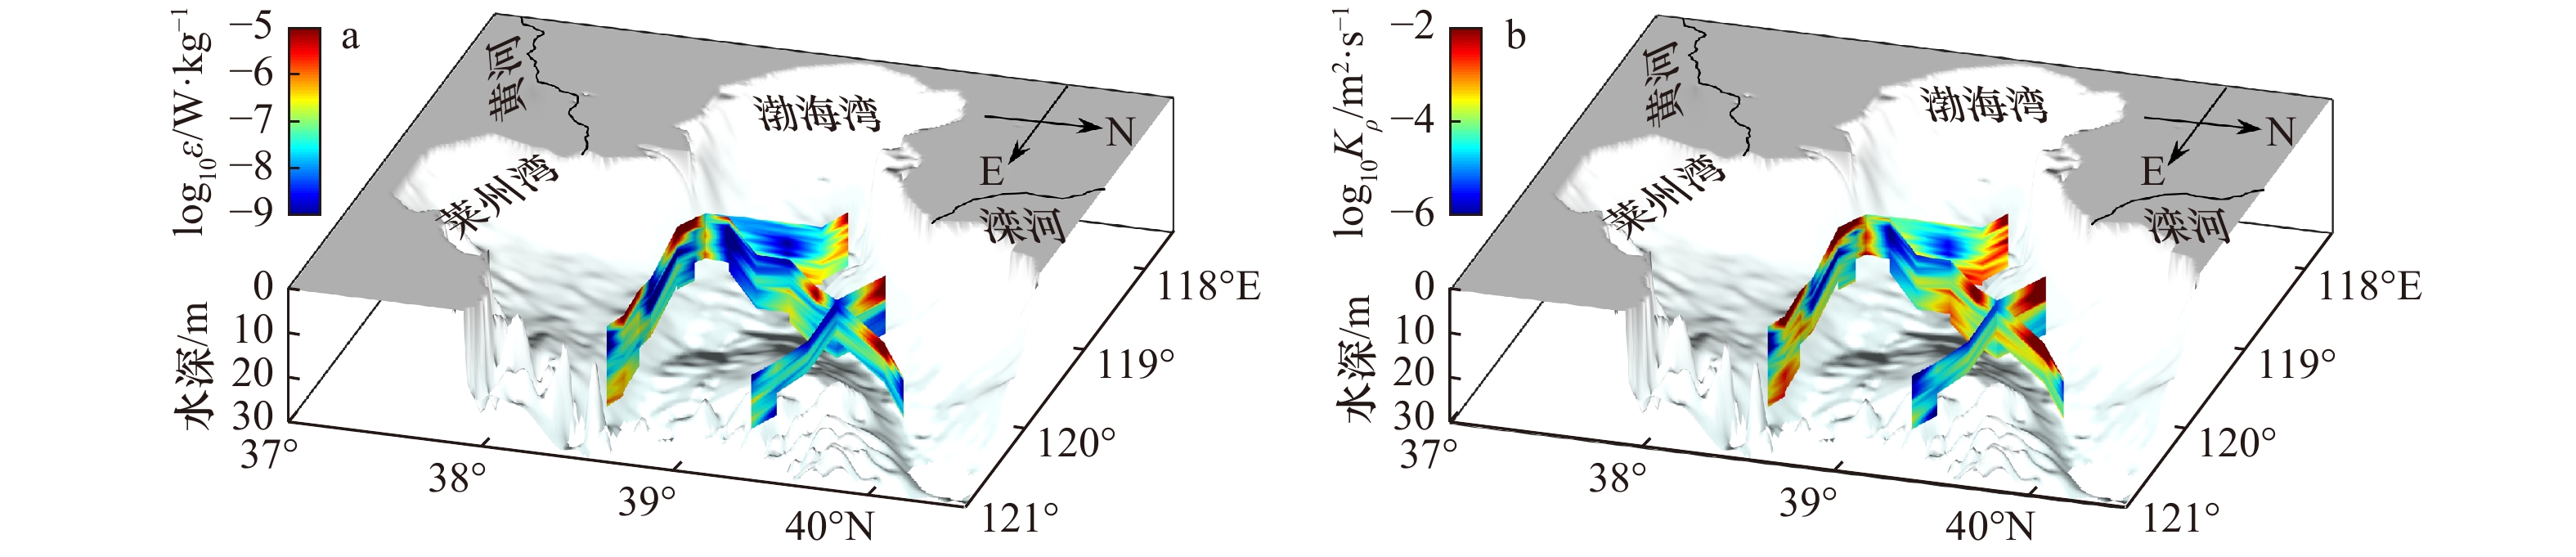
图 4 湍动能耗散率
$\varepsilon $ (a)和垂向湍扩散系数${K_\rho }$ (b)空间分布Fig. 4 Spatial distribution of turbulent kinetic energy dissipation rate
$\varepsilon $ (a) and vertical eddy diffusivity${K_\rho }$ (b) in a 3D view
图 5 从左列至右列分别代表断面位置、浮性频率平方(N2)、流速剪切平方(S2)、湍动能耗散率(
$\varepsilon $ )(黑线:等温线)以及垂向湍扩散系数(${K_\rho }$ )(灰线:等密线)的断面分布Fig. 5 From left to right are locations of the transects, cross-sectional distributions of squared buoyancy frequency N2, squared shear S2, TKE dissipation rate
$\varepsilon $ (black contours:isotherms) and vertical eddy diffusivity${K_\rho }$ (gray contours: isopycnals)
图 6 对数湍动能耗散率(
${\log _{10}}\varepsilon $ )(a)与对数湍扩散系数(${\log _{10}}{K_\rho }$ )(b)累积概率(CDF)分布红色点划线为对应的对数正态分布,黑色虚线对应对数正态分布模型的中位数
Fig. 6 The cumulative distribution functions (CDF) of
${\log _{10}}\varepsilon $ (a) and${\log _{10}}{K_\rho }$ (b)Red dot dash line is lognormal distribution,black dash lines denote the medians of the corresponding lognormal distribution
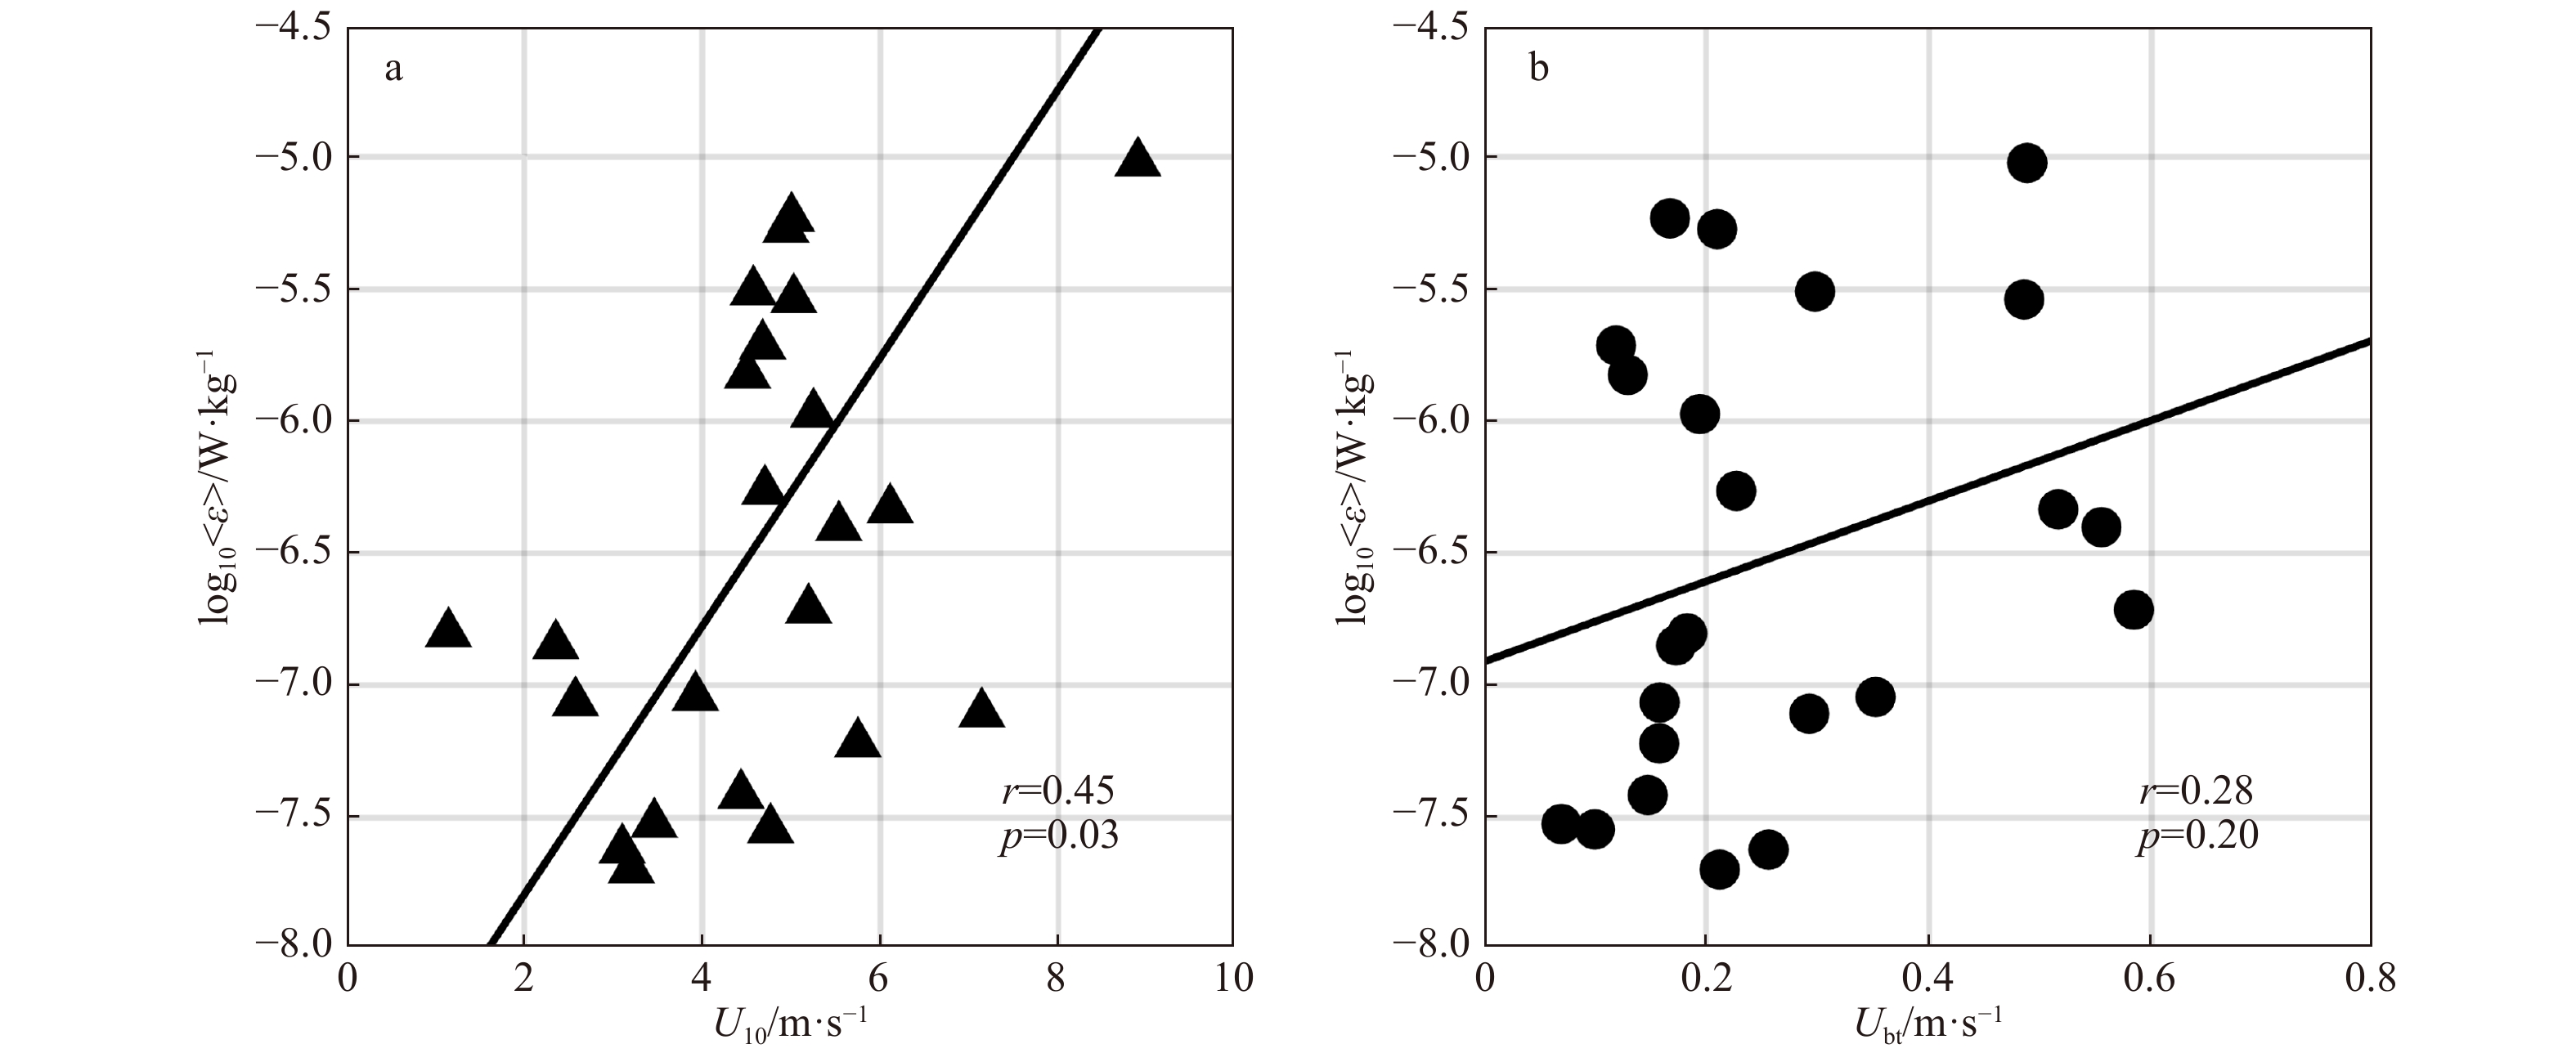
图 7 各站位平均耗散率的对数
${\log _{10}} $ 〈ε〉与海面以上10 m处风速(黑色三角)(a)和OTIS模型得到的正压潮流速(黑色实心圆)(b)的对应关系黑色实线表示最小二乘法线性拟合
Fig. 7 Station-averaged dissipation
${\log _{10}} $ 〈ε〉 versus the averaged wind speed at 10 m height during the observation period (black filled triangles) (a) and the barotropic current speed from OTIS (black filled circles) (b)The black solid lines represent the best linear least squares fit

图 8 湍动能耗散率
$\varepsilon $ 与1 m平均的归一化浮性频率平方N2(a)与2 m分辨率的归一化剪切平方S2(b)的散点分布(灰色圆点)灰色圆点为散点分布,黑点为网格中位数结果,最小二乘拟合直线用黑色实线表示,阴影表示95%置信区间
Fig. 8 The turbulent kinetic energy dissipation rate
$\varepsilon $ versus the normalized squared buoyancy frequency N2 (averaged into 1 m) (a) and the normalized squared shear S2 (averaged into 2 m) (b)The gray and black dots represent the raw and bin-median data, respectively. The best fitted lines are shown by dark solid lines with the 95% confidence intervals indicated by the gray shading
-
[1] 鲍献文, 万修全, 高郭平, 等. 渤海、黄海、东海AVHRR海表温度场的季节变化特征[J]. 海洋学报, 2002, 24(5): 125−133.Bao Xianwen, Wan Xiuquan, Gao Guoping, et al. The characteristics of the seasonal variability of the sea surface temperature field in the Bohai Sea, the Huanghai Sea and the East China Sea from AVHRR data[J]. Haiyang Xuebao, 2002, 24(5): 125−133. [2] 刘浩, 潘伟然. 渤海层化结构及潮汐锋面季节变化的数值研究[J]. 水科学进展, 2007, 18(3): 398−403. doi: 10.3321/j.issn:1001-6791.2007.03.015Liu Hao, Pan Weiran. Numerical simulation of the seasonal variations of the stratification and tidal front in the Bohai Sea[J]. Advances in Water Science, 2007, 18(3): 398−403. doi: 10.3321/j.issn:1001-6791.2007.03.015 [3] 赵保仁. 渤、黄海及东海北部强温跃层的基本特征及形成机制的研究[J]. 海洋学报, 1989, 11(4): 140−401.Zhao Baoren. Study on the basic characteristics and formation mechanism of the strong thermocline in the Bohai, the Yellow Sea and the North East China Sea[J]. Haiyang Xuebao, 1989, 11(4): 140−401. [4] 赵保仁, 曹德明, 李徽翡, 等. 渤海的潮混合特征及潮汐锋现象[J]. 海洋学报, 2001, 23(4): 113−120.Zhao Baoren, Cao Deming, Li Weifei, et al. Tidal mixing characters and tidal fronts phenomenons in the Bohai Sea[J]. Haiyang Xuebao, 2001, 23(4): 113−120. [5] 周锋, 黄大吉, 苏纪兰. 夏季渤海温跃层下的双中心冷水结构的数值模拟[J]. 科学通报, 2009, 54(11): 1591−1599. doi: 10.1360/csb2009-54-11-1591Zhou Feng, Huang Daji, Su Jilan. Numerical simulation of the dual-core structure of the Bohai Sea cold bottom water in summer[J]. Chinese Science Bulletin, 2009, 54(11): 1591−1599. doi: 10.1360/csb2009-54-11-1591 [6] Zhao H D, Kao S J, Zhai W D, et al. Effects of stratification, organic matter remineralization and bathymetry on summertime oxygen distribution in the Bohai Sea, China[J]. Continental Shelf Research, 2016, 134: 15−25. [7] 翟惟东, 赵化德, 郑楠, 等. 2011年夏季渤海西北部、北部近岸海域的底层耗氧与酸化[J]. 科学通报, 2012, 57(9): 753−758. doi: 10.1007/s11434-011-4949-2Zhai Weidong, Zhao Huade, Zheng Nan, et al. Coastal acidification in summer bottom oxygen-depleted waters in northwestern–northern Bohai Sea from June to August in 2011[J]. Chinese Science Bulletin, 2012, 57(9): 753−758. doi: 10.1007/s11434-011-4949-2 [8] 张华, 李艳芳, 唐诚, 等. 渤海底层低氧区的空间特征与形成机制[J]. 科学通报, 2016, 61(14): 1612−1620. doi: 10.1360/N972015-00915Zhang Hua, Li Yanfang, Tang Cheng, et al. Spatial characteristics and formation mechanisms of bottom hypoxia zone in the Bohai Sea during summer[J]. Chinese Science Bulletin, 2016, 61(14): 1612−1620. doi: 10.1360/N972015-00915 [9] Zhang H, Zhao L, Sun Y, et al. Contribution of sediment oxygen demand to hypoxia development off the Changjiang Estuary[J]. Estuarine Coastal and Shelf Science, 2017, 192: 149−157. doi: 10.1016/j.ecss.2017.05.006 [10] 刘志宇. 强潮驱陆架海中的湍流与混合[D]. 青岛: 中国海洋大学, 2009.Liu Zhiyu. Turbulence and mixing in tidally energetic shelf seas[D]. Qingdao: Ocean University of China, 2009. [11] Thorpe S A. An Introduction to Ocean Turbulence[M]. Cambridge: Cambridge University Press, 2007. [12] Rippeth T P, Wiles P, Palmer M R, et al. The diapcynal nutrient flux and shear-induced diapcynal mixing in the seasonally stratified western Irish Sea[J]. Continental Shelf Research, 2009, 29(13): 1580−1587. doi: 10.1016/j.csr.2009.04.009 [13] Williams C, Sharples J, Mahaffey C, et al. Wind-driven nutrient pulses to the subsurface chlorophyll maximum in seasonally stratified shelf seas[J]. Geophysical Research Letters, 2013, 40(20): 5467−5472. doi: 10.1002/2013GL058171 [14] Lee J H, Lozovatsky I, Jang S T, et al. Episodes of nonlinear internal wave in the northern East China Sea[J]. Geophysical Research Letters, 2006, 33(18): L18601. [15] Liu Zhiyu, Wei Hao, Lozovatsky I D, et al. Late summer stratification, internal waves, and turbulence in the Yellow Sea[J]. Journal of Marine Systems, 2009, 77(4): 459−472. doi: 10.1016/j.jmarsys.2008.11.001 [16] 魏传杰, 于非, 郭景松, 等. 黄海西部海洋湍流的季节变化特征分析[J]. 海洋与湖沼, 2014, 45(1): 167−171. doi: 10.11693/hyhz20121205001Wei Chuanjie, Yu Fei, Guo Jingdong, et al. Seasonal variation of ocean turbulence in the western Yellow Sea[J]. Oceanologia et Limnologia Sinica, 2014, 45(1): 167−171. doi: 10.11693/hyhz20121205001 [17] 周磊, 田纪伟, 张效谦. 东海陆架坡折小尺度过程观测[J]. 科学通报, 2005, 50(16): 1784−1788. doi: 10.3321/j.issn:0023-074X.2005.16.019Zhou Lei, Tian Jiwei, Zhang Xiaoqian. The observations of small scale processes in shelf break of East China Sea[J]. Chinese Science Bulletin, 2005, 50(16): 1784−1788. doi: 10.3321/j.issn:0023-074X.2005.16.019 [18] 赵亮, 魏皓. 渤海垂直湍流混合强度季节变化的数值模拟[J]. 中国海洋大学学报, 2001, 31(3): 313−318.Zhao Liang, Wei Hao. Annual cycle of the vertical eddy viscosity in the Bohai Sea[J]. Journal of Ocean University of Qingdao, 2001, 31(3): 313−318. [19] 梁书秀, 白波, 孙昭晨. 渤海海峡北部非层化期海洋湍流混合的微结构特征[J]. 海洋环境科学, 2013, 32(2): 190−195.Liang Shuxiu, Bai Bo, Sun Zhaochen. Microstructure characteristics of ocean turbulent mixing during non-stratification season in northern Bohai Strait[J]. Marine Environmental Science, 2013, 32(2): 190−195. [20] Liu Zhe, Wang Haiyan, Guo Xinyu, et al. The age of Yellow River water in the Bohai Sea[J]. Journal of Geophysical Research: Oceans, 2012, 117(C11): C11006. [21] Gregg M C. Uncertainties and limitations in measuring ε and x T[J]. Journal of Atmospheric and Oceanic Technology, 1999, 16(11): 1483−1490. doi: 10.1175/1520-0426(1999)016<1483:UALIMA>2.0.CO;2 [22] Wolk F, Yamazaki H, Seuront L, et al. A new free-fall profiler for measuring biophysical microstructure[J]. Journal of Atmospheric and Oceanic Technology, 2002, 19(5): 780−793. doi: 10.1175/1520-0426(2002)019<0780:ANFFPF>2.0.CO;2 [23] Roget E, Lozovatsky I, Sanchez X, et al. Microstructure measurements in natural waters: Methodology and applications[J]. Progress in Oceanography, 2006, 70(2/4): 126−148. [24] Goodman L, Levine E R, Lueck R G. On measuring the terms of the turbulent kinetic energy budget from an AUV[J]. Journal of Atmospheric and Oceanic Technology, 2006, 23(7): 977−990. doi: 10.1175/JTECH1889.1 [25] Nasmyth P W. Oceanic turbulence[D]. Vancouver: University of British Columbia, 1970. [26] Osborn T R. Estimates of the local rate of vertical diffusion from dissipation measurements[J]. Journal of Physical Oceanography, 1980, 10(1): 83−89. doi: 10.1175/1520-0485(1980)010<0083:EOTLRO>2.0.CO;2 [27] Lozovatsky I, Lee J H, Fernando H J S, et al. Turbulence in the East China Sea: The summertime stratification[J]. Journal of Geophysical Research: Oceans, 2015, 120(3): 1856−1871. doi: 10.1002/2014JC010596 [28] Lozovatsky I, Fernando H J S, Planella-Morato J, et al. Probability distribution of turbulent kinetic energy dissipation rate in ocean: observations and approximations[J]. Journal of Geophysical Research Oceans, 2017, 122(10): 8293−8308. doi: 10.1002/2017JC013076 [29] Lozovatsky I, Planella-Morato J, Shearman K, et al. Vertical mixing and elements of mesoscale dynamics over North Carolina shelf and contiguous Gulf Stream waters[J]. Ocean Dynamics, 2017, 67(6): 783−798. doi: 10.1007/s10236-017-1059-y [30] Rehmann C R, Duda T F. Diapycnal diffusivity inferred from scalar microstructure measurements near the New England shelf/slope front[J]. Journal of Physical Oceanography, 2000, 30(6): 1354−1371. doi: 10.1175/1520-0485(2000)030<1354:DDIFSM>2.0.CO;2 [31] Yamazaki H, Lueck R. Why oceanic dissipation rates are not lognormal[J]. Journal of Physical Oceanography, 1990, 20(12): 1907−1918. doi: 10.1175/1520-0485(1990)020<1907:WODRAN>2.0.CO;2 [32] Gurvich A S, Yaglom A M. Breakdown of eddies and probability distributions for small-scale turbulence[J]. Physics of Fluids, 1967, 10(10): 59−65. [33] Egbert G D, Erofeeva S Y. Efficient inverse modeling of barotropic ocean tides[J]. Journal of Atmospheric and Oceanic Technology, 2002, 19(2): 183−204. doi: 10.1175/1520-0426(2002)019<0183:EIMOBO>2.0.CO;2 -


 下载:
下载:


计量
- 文章访问数: 825
- HTML全文浏览量: 1146
- PDF下载量: 194
- 被引次数: 0
