

The turbulent dynamic mechanism of flocculation of cohesive sediment in the Zhujiang River Estuary
-
摘要: 本文利用2010年枯季在珠江口进行的大、中、小潮LISST剖面及底边界层观测资料,分析了磨刀门河口枯季稳定存在的絮团三峰结构,即构建絮团的基本粒子的平均粒径约为8.3~9.0 μm,小絮团为36~100 μm,大絮团大于180 μm。小潮期,盐跃层捕集的悬浮泥沙以强絮凝过程为主,大絮团含量占优;中、大潮期,平均粒径普遍增大,絮凝占优。潮内的动力变化对絮团多峰结构及形态参数的影响不明显,絮凝与解凝处于动态平衡。结合坐底三角架的湍流资料和简化的群体平衡模型(Population Balance Equation,PBE),进一步揭示了絮团变化的湍流动力机制。高流速下的强紊动剪切力,直接导致大絮团被破坏形成小絮凝体,絮凝体平均粒径减小,反之絮凝强于解凝作用。同时,基于高斯矩积分方法求解PBE,得到的粒径分布基本与观测值吻合,说明在有较好的现场湍流与粒径观测资料的条件下,PBE包含的湍流动力机制可以用来研究黏性泥沙的絮凝过程。Abstract: This thesis aimed to analyze the stable multimodal (3-peaked) particle size distributions (PSDs) of flocs in the Zhujiang River Estuary with the field observation data getting by LISST and the bottom boundary layer observation system during the dry season in 2010. The results show that the mean diameter of the basic building blocks of flocs, so-called primary particle, is about 8.3–9.0 μm; the mean diameter of microflocs in a range of 36–100 μm, and macroflocs have a size range of 180 μm to thousands of micrometers. In the neap tidal periods, the suspension sediment of halocline is dominated by the macroflocs with strong flocculation process; the mean diameter of flocs is increases and is controlled by flocs during the moderate and spring tide. The dynamic change of the tide has little impact on the multimodal PSDs and morphological parameters, with aggregation and breakage of the flocculation in the dynamic equilibrium. Study results further demonstrate the turbulent dynamic mechanism of flocculation by combining the turbulence data collected by the bottom tripod and the simplified Population Balance Equation (PBE). It is that, the high shear of the peak flow would enhance breakage of macroflocs to microflocs and decrease the mean diameter of flocs, on the contrary, aggregation is much stronger than breakage. It also shows that PSDs are in according with observation by solving PBE based on gaussian moment integral method. It turns out that PBE which containes the turbulent dynamic mechanism can be used to study the flocculation of cohesive sediment with turbulence and PSDs data.
-
Key words:
- Zhujiang River Estuary /
- flocculation /
- turbulence /
- population balance equation
-

图 1 磨刀门河口在珠江三河口湾中的位置(a)及2010年12月15–24日磨刀门水道水文观测站位分布(b)
Fig. 1 The Zhujiang River Estuary and research area (a) and the distribution of observation stations from December 15, 2010 to December 24, 2010 at Modaomen Estuary (b)
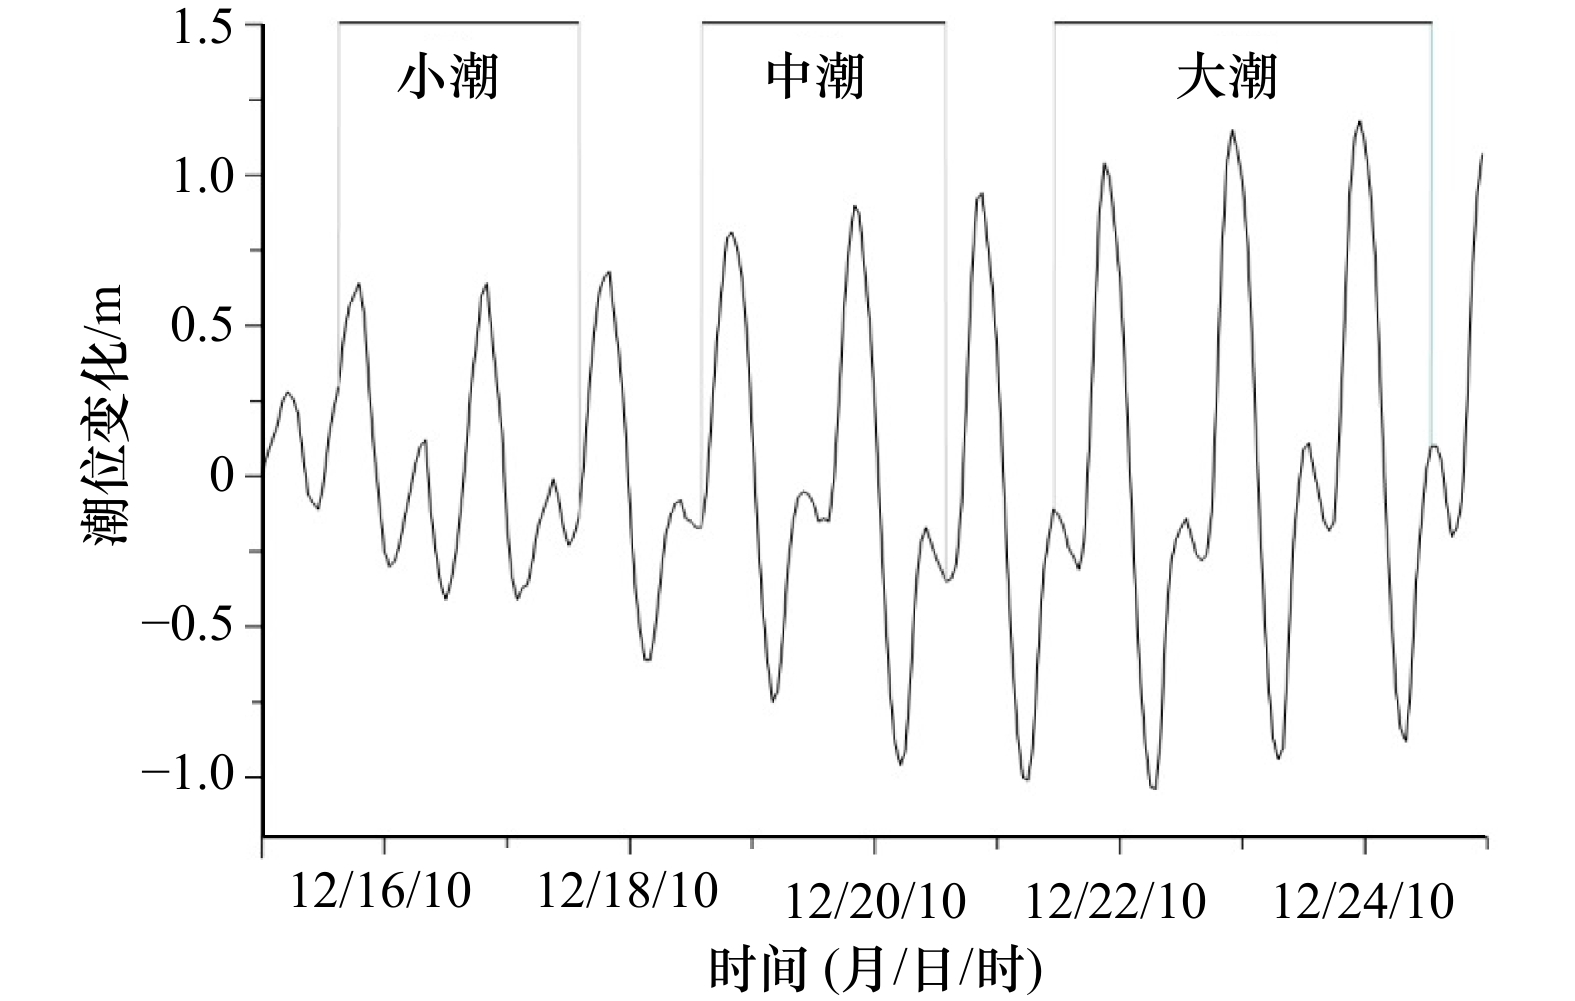
图 2 灯笼山站边界层的3个观测测次时间与对应的潮型
Fig. 2 Three observations of the bottom boundary layer and corresponding tide types at Denglongshan Station
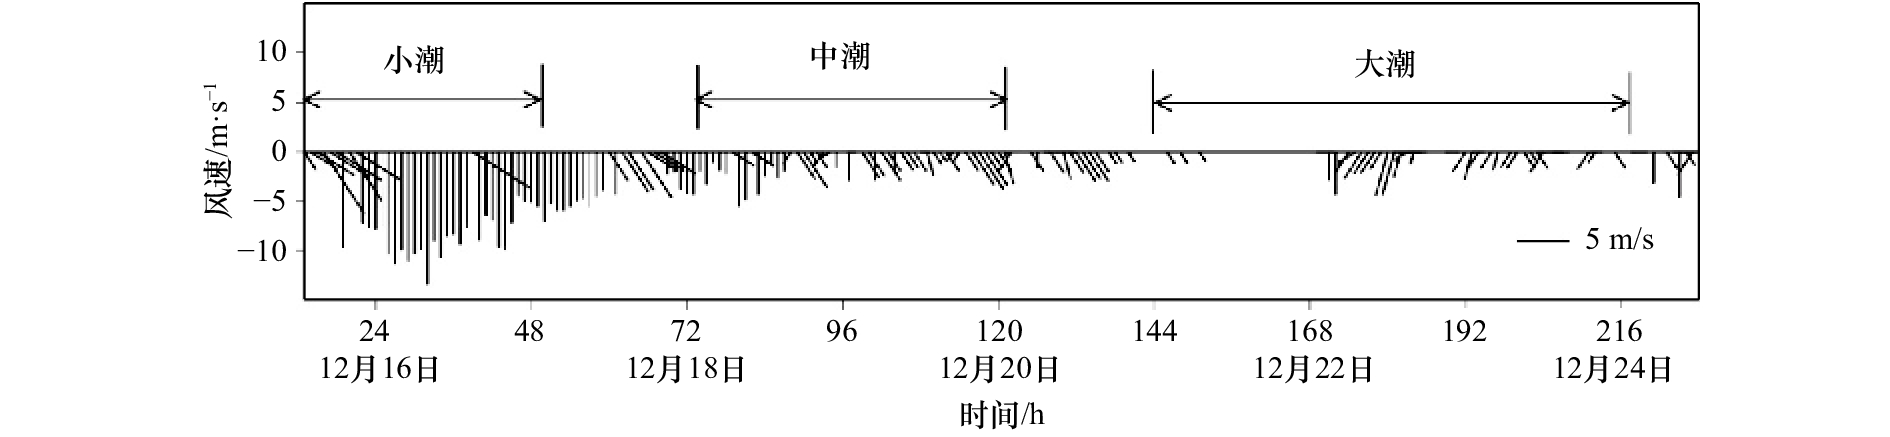
图 3 观测期间风速风向过程曲线
Fig. 3 The time process of wind direction and speed during the observation

图 4 M2站剖面轴向流速(a),盐度(b),体积浓度(c),絮团粒径(d)分布
图中轴向流速的正值表示涨潮,负值表示落潮
Fig. 4 The profile distribution of velocity (a), salinity (b), volume concentration (c) and diameter of flocs (d) at M2 Station
The positive (+), negative (-) values of the axial velocity represent the flood tide, ebb tide, respectively
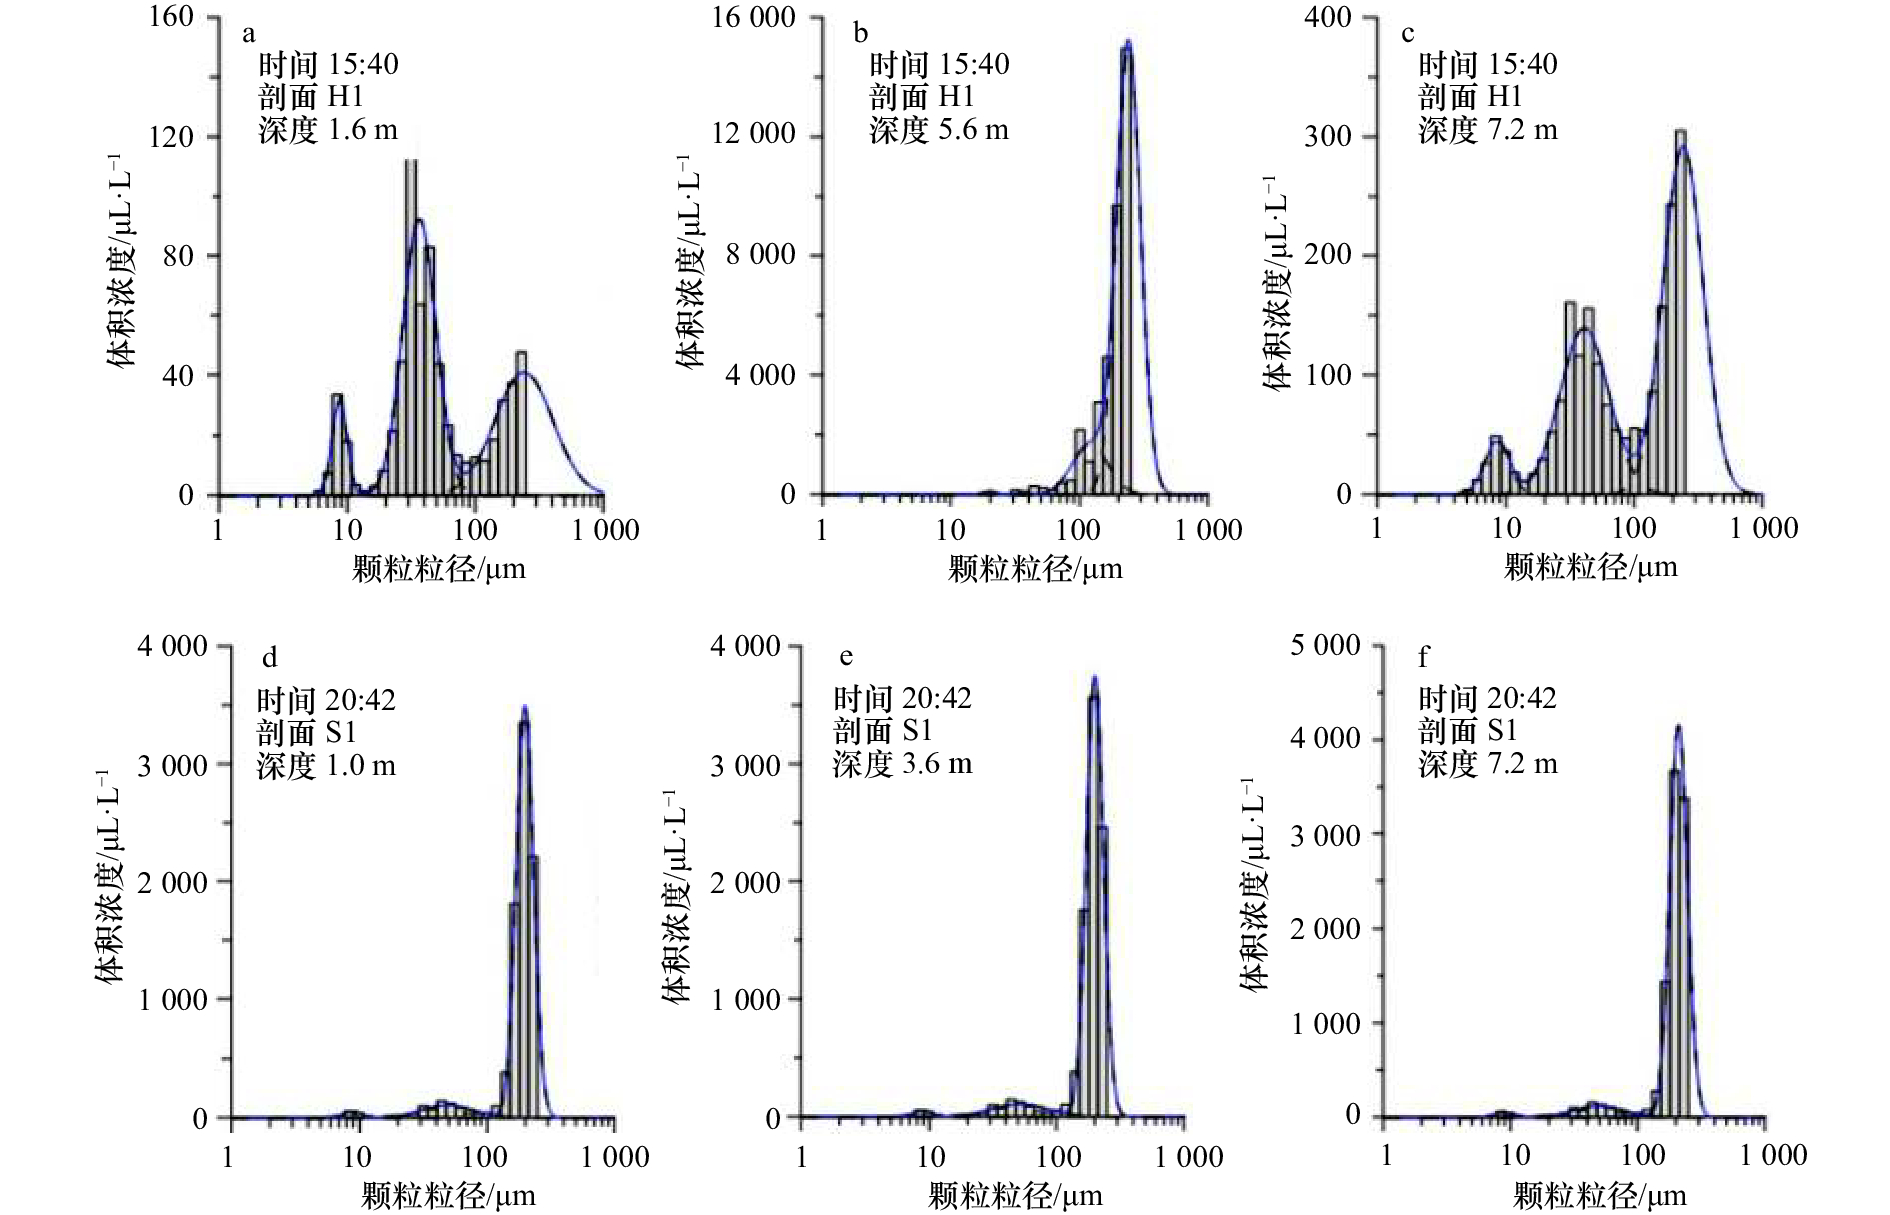
图 5 H1剖面的粒径分布(a, b, c)和S1剖面的粒径分布(d, e, f)(a, d为表层;b, e为中层或跃层;c, f为底层)
Fig. 5 Particle size distributions of surface (a, d), middle/halocline (b, e) and bottom (c, f) layers in H1 (a, b and c) and S1(d, e and f) profiles
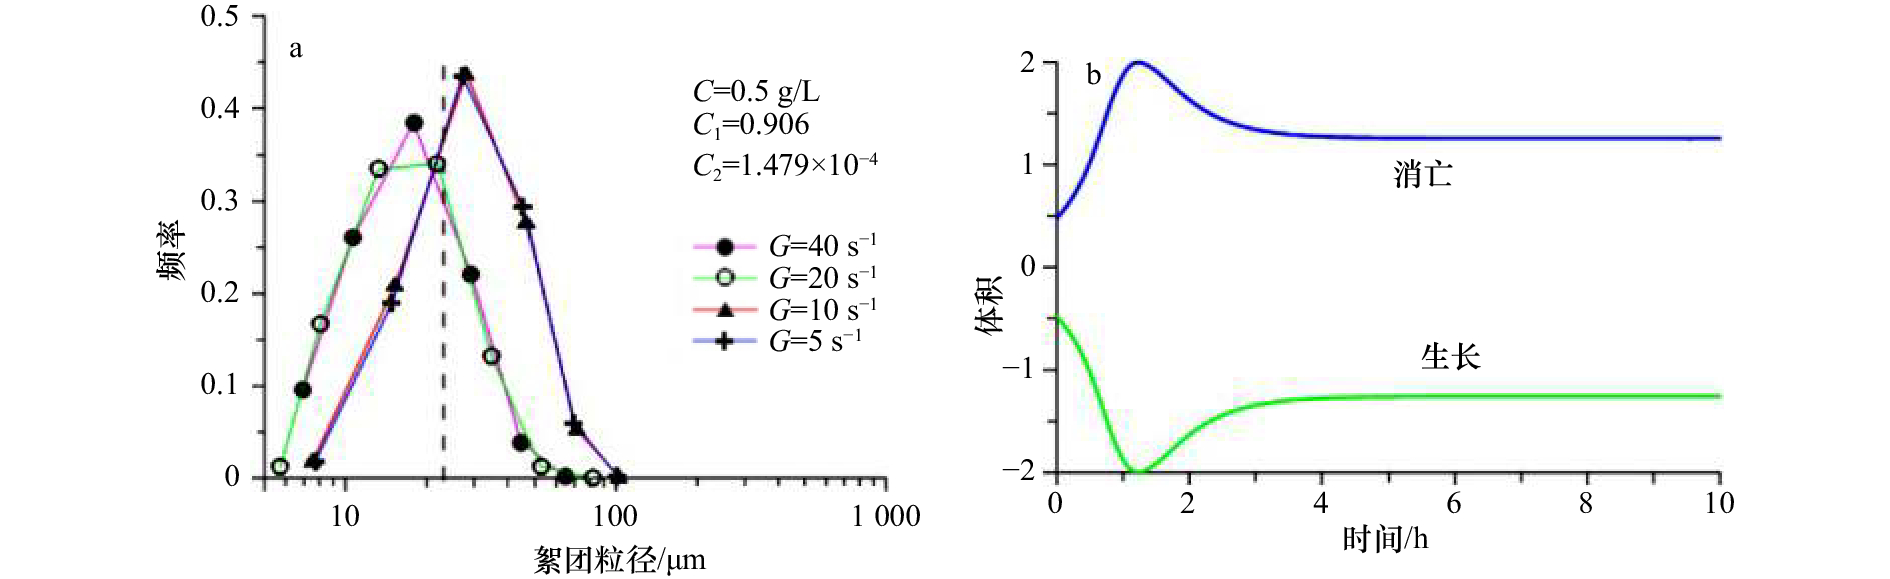
图 6 不同剪切率下的粒径分布(a)及粒径随时间演化过程(b)
图a中C1与C2分别表示碰撞效率与破坏频率参数,C是泥沙浓度[32]
Fig. 6 Experimentally obtained steady-state particle size distributions with different shear rate (a) and time process of flocs evolution (b)
C1 and C2 represent collision efficiency and failure frequency parameters, respectively; C is the sediment concentration[32]
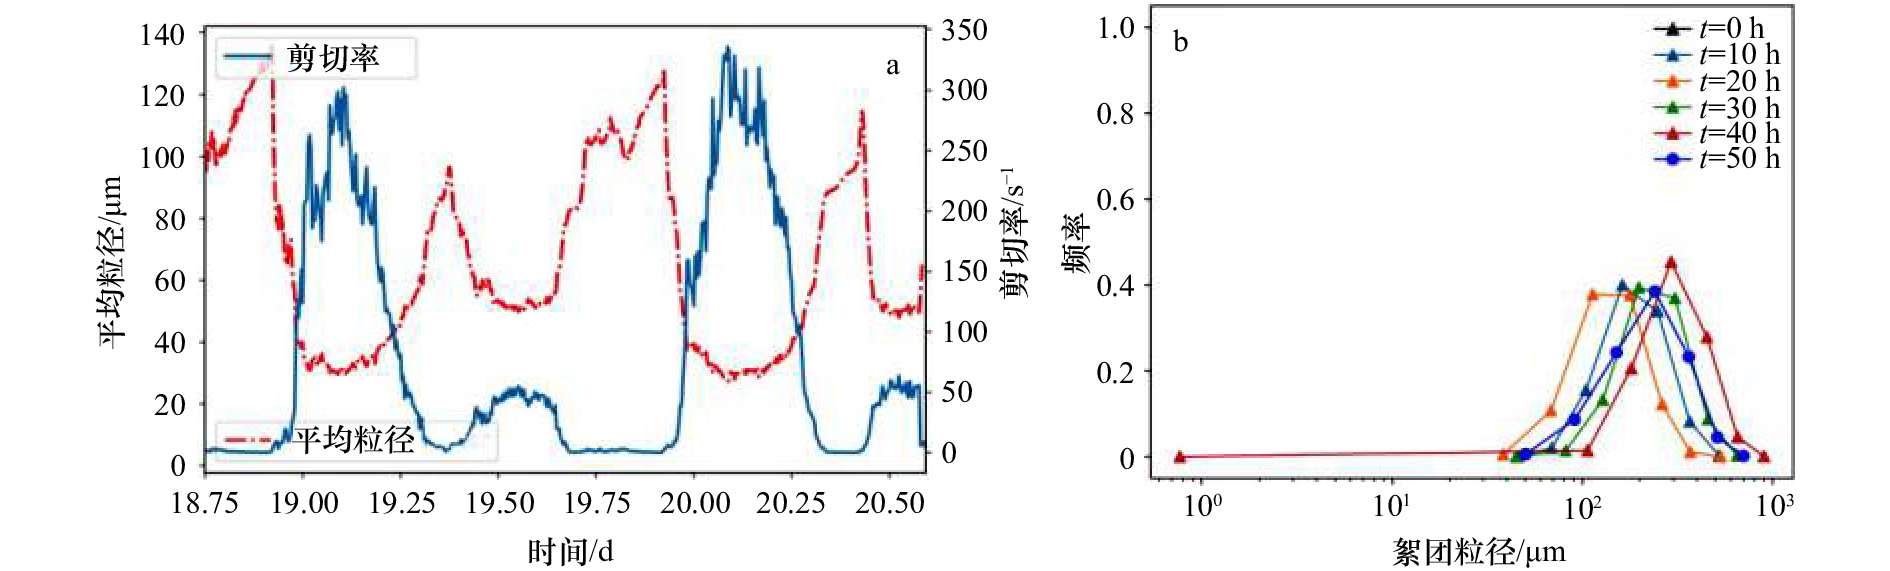
图 7 M2站观测期间的剪切率与模拟的平均粒径(a)及颗粒粒径分布(b)
Fig. 7 The time process of shear rate and simulated mean diameter of particles (a) and particle size distributions (b) at M2 Station
表 1 观测仪器设置参数
Tab. 1 The parameters set of the observation instruments
观测方式 仪器 参数设置 测量项目 船载系统 LISST-100B 整点下放,采样频率为1 Hz 剖面泥沙粒径分布 CTD 整点下放,采样频率为1 Hz 温、盐、深 座底观测 ADV 采样频率为64 Hz,测量间隔为5 min,采样时间为3 min,位置分别为0.25 mab、1.35 mab 单点三维高频流速、声强 OBS 采样间隔1 min采样,平均时间为10 s,位置分别为0.4 mab、0.9 mab 单点浊度 RBR-CTD 采样频率为1 Hz,位置为0.5 mab 温、盐、深 PC-ADP 测量间隔为5 min,采样频率为1 Hz,每次测量180个剖面,盲区为0.10 m,位置为1.3 mab 剖面流速 注:mab表示离床面的高度,单位:m。  下载: 导出CSV
表 2 特征剖面多峰结构的絮团拟合参数
Tab. 2 A summary of flocs fitting parameters for particle size distributions at typical profiles
剖面(观测时间) 层位 观测值 曲线拟合:平均粒径/μm 曲线拟合:体积浓度/μL·L–1 曲线拟合:几何标准差 H/m V/μL·L–1 D/μm m1 m2 m3 m1 m2 m3 m1 m2 m3 H1(2010年10月15日16时) S 1.6 47.5 47.1 8.5 36 230 4.4 30.1 21.9 1.3 1.59 1.41 H 5.5 2 674 178.3 43 100 237 43 1 824 1 836 1.21 1.2 1.27 B 7.2 140 71 8.6 41 230 40 67 103 1.43 1.29 1.32 H2(2010年10月15日21时) S 1.6 46 48 8.5 36 159 4 26 18 1.05 1.24 1.68 H 5.6 3 883 155 50 99 178 154 521 3 294 1.42 1.06 1.2 B 6.6 95.6 55.4 8.6 37 230 40 23 33 1.38 1.78 1.35 S1(2010年10月20日17时) S 1 623 164 8.8 49 198 9 53 600 1.17 1.59 1.17 H 3.6 655.2 165 8.9 51 200 9 58 633 1.17 1.66 1.17 B 7.2 697 171 8.9 49 209 9 57 725 1.17 1.58 1.17 S2(2010年10月21日4时) S 1 898 136 8.8 48 228 31 109 1 069 1.34 1.7 1.27 H 3.2 910 133 8.8 49 238 31 180 1 219 1.34 1.72 1.29 B 6.5 1 332 135 8.3 50 240 29 277 1 776 1.31 1.93 1.23 注:S、H、B分别代表表层、跃层或中层、底层;V和D表示观测的总体积浓度和平均粒径;m1、m2、m3分别为3个分解模态;H表示水深。
下载: 导出CSV
-
[1] Krone R B. Flume studies of the transport of sediment in estuarial shoaling process[R]. Berkeley, California: University of California, 1962: 1–110. [2] Gibbs R J. Estuarine flocs: their size, settling velocity and density[J]. Journal of Geophysical Research: Oceans, 1985, 90(C2): 3249−3251. doi: 10.1029/JC090iC02p03249 [3] Fettweis M. Uncertainty of excess density and settling velocity of mud flocs derived from in situ measurements[J]. Estuarine, Coastal and Shelf Science, 2008, 78(2): 426−436. doi: 10.1016/j.ecss.2008.01.007 [4] Manning A J, Bass S J, Dyer K R. Floc properties in the turbidity maximum of a mesotidal estuary during neap and spring tidal conditions[J]. Marine Geology, 2006, 235(1/4): 193−211. [5] Lee B J, Toorman E, Fettweis M. Multimodal particle size distributions of fine-grained sediments: mathematical modeling and field investigation[J]. Ocean Dynamics, 2014, 64(3): 429−441. doi: 10.1007/s10236-014-0692-y [6] van Leussen W. Estuarine macroflocs and their role in fine-grained sediment transport[D]. Utrecht: University of Utrecht, 1994: 1–484. [7] Winterwerp J C, van Kesteren W G M. Introduction to the Physics of Cohesive Sediment in the Marine Environment[M]. Amsterdam: Elsevier, 2004: 109–117. [8] Sternberg R W, Berhane I, Ogston A S. Measurement of size and settling velocity of suspended aggregates on the northern California continental shelf[J]. Marine Geology, 1999, 154(1/4): 43−53. [9] Agrawal Y C, Pottsmith H C. Instruments for particle size and settling velocity observations in sediment transport[J]. Marine Geology, 2000, 168(1/4): 89−114. [10] Agrawal Y C, Traykovski P. Particles in the bottom boundary layer: concentration and size dynamics through events[J]. Journal of Geophysical Research: Oceans, 2001, 106(C5): 9533−9542. doi: 10.1029/2000JC900160 [11] Christiansen C, Bartholdy J, Sørensen C. Composition and size distributions of local and advected sediment trapped over a tidal flat during moderate and storm conditions[J]. Geografisk Tidsskrift: Danish Journal of Geography, 2006, 106(1): 1−11. doi: 10.1080/00167223.2006.10649541 [12] Mikkelsen O A, Hill P S, Milligan T G. Single-grain, microfloc and macrofloc volume variations observed with a LISST-100 and a digital floc camera[J]. Journal of Sea Research, 2006, 55(2): 87−102. doi: 10.1016/j.seares.2005.09.003 [13] Lee B J, Fettweis M, Toorman E, et al. Multimodality of a particle size distribution of cohesive suspended particulate matters in a coastal zone[J]. Journal of Geophysical Research: Oceans, 2012, 117(C3): C03014. [14] Eisma D. Flocculation and de-flocculation of suspended matter in estuaries[J]. Netherlands Journal of Sea Research, 1986, 20(2/3): 183−199. [15] Andrews S, Nover D, Schladow S G. Using laser diffraction data to obtain accurate particle size distributions: the role of particle composition[J]. Limnology and Oceanography: Methods, 2010, 8(10): 507−526. doi: 10.4319/lom.2010.8.507 [16] Alldredge A L, Silver M W. Characteristics, dynamics and significance of marine snow[J]. Progress in Oceanography, 1988, 20(1): 41−82. doi: 10.1016/0079-6611(88)90053-5 [17] Manning A J, Bass S J. Variability in cohesive sediment settling fluxes: observations under different estuarine tidal conditions[J]. Marine Geology, 2006, 235(1/4): 177−192. [18] Verney R, Lafite R, Brun-Cottan J C, et al. Behaviour of a floc population during a tidal cycle: laboratory experiments and numerical modelling[J]. Continental Shelf Research, 2011, 31(S10): S64−S83. [19] Shen Xiaoteng. Modeling flocculation and deflocculation processes of cohesive sediments[D]. Williamsburg, VA: College of William and Mary, 2016: 1–319. [20] Von Smoluchowski M. Versuch einer mathematischen Theorie der Koagulationskinetik kolloider Lösungen[J]. Zeitschrift Für Physikalische Chemie, 1917, 92: 129−168. [21] Maggi F, Mietta F, Winterwerp J C. Effect of variable fractal dimension on the floc size distribution of suspended cohesive sediment[J]. Journal of Hydrology, 2007, 343(1/2): 43−55. [22] Lee B J, Toorman E, Molz F J, et al. A two-class population balance equation yielding bimodal flocculation of marine or estuarine sediments[J]. Water Research, 2011, 45(5): 2131−2145. doi: 10.1016/j.watres.2010.12.028 [23] Shen Xiaoteng, Maa J P Y. Modeling floc size distribution of suspended cohesive sediments using quadrature method of moments[J]. Marine Geology, 2015, 359: 106−119. doi: 10.1016/j.margeo.2014.11.014 [24] Hussein T, Maso M D, Petäjä T, et al. Evaluation of an automatic algorithm for fitting the particle number size distributions[J]. Boreal Environment Research, 2005, 10(5): 337−355. [25] Mäkelä J M, Koponen I K, Aalto P, et al. One-year data of submicron size modes of tropospheric background aerosol in Southern Finland[J]. Journal of Aerosol Science, 2000, 31(5): 595−611. doi: 10.1016/S0021-8502(99)00545-5 [26] Whitby K T. The physical characteristics of sulfur aerosols[J]. Atmospheric Environment, 1978, 12(1/3): 135−159. [27] Kariwala V, Cao Yi, Nagy Z K. Automatic differentiation-based quadrature method of moments for solving population balance equations[J]. AIChE Journal, 2012, 58(3): 842−854. doi: 10.1002/aic.v58.3 [28] 苏军伟, 顾兆林, Xu X Y. 离散相系统群体平衡模型的求解算法[J]. 中国科学: 化学, 2010, 40(2): 144−160.Su Junwei, Gu Zhaolin, Xu X Y. Advances of solution methods of population balance equation for disperse phase system[J]. Scientia Sinica Chimica, 2010, 40(2): 144−160. [29] Ren Jie, Wu Jiaxue. Sediment trapping by haloclines of a river plume in the Pearl River Estuary[J]. Continental Shelf Research, 2014, 82: 1−8. doi: 10.1016/j.csr.2014.03.016 [30] Xia X M, Li Y, Yang H, et al. Observations on the size and settling velocity distributions of suspended sediment in the Pearl River Estuary, China[J]. Continental Shelf Research, 2004, 24(16): 1809−1826. doi: 10.1016/j.csr.2004.06.009 [31] 程江, 何青, 夏小明. 长江口徐六泾悬浮细颗粒泥沙絮凝体特性[J]. 海洋与湖沼, 2007, 38(4): 304−313. doi: 10.3321/j.issn:0029-814X.2007.04.003Cheng Jiang, He Qing, Xia Xiaoming. Characteristics of suspended fine sediment flocs in Changjiang (Yangtze) Estuary[J]. Oceanologia et Limnologia Sinica, 2007, 38(4): 304−313. doi: 10.3321/j.issn:0029-814X.2007.04.003 [32] Kusuda T, Yamanishi H, Spearman J, et al. Sediment and Ecohydraulics: INTERCOH 2005[M]. Amsterdam: Elsevier, 2008. -

计量
- 文章访问数: 351
- HTML全文浏览量: 58
- PDF下载量: 225
- 被引次数: 0
