

The study of trophic niche and potential food sources of benthic animals in mangrove from Yanpu Bay
-
摘要: 红树林是滨海生产力最高的生态系统,林内有机碳来源多元化,使得底栖食物网营养结构较为复杂。本研究以沿浦湾红树林底栖动物(鱼类、贝类、甲壳类)为研究对象,采用稳定同位素技术结合贝叶斯标准椭圆模型(SIBER模型)和稳定同位素溯源混合模型(Simmr模型)分析底栖动物群落营养结构,并确定潜在食物来源。研究表明:底栖动物碳稳定同位素(δ13C)值范围为−22.04‰~−11.27‰,氮稳定同位素(δ15N)值范围为5.86‰~16.21‰,营养级介于1.00(红树拟蟹守螺)~3.62(大鳍弹涂鱼)之间。其中,鱼类的营养级偏高,为2.05~3.62,甲壳类为2.28~3.19,而贝类相对偏低,介于1.00~2.83之间,这与不同类群的食性偏好差异有关。由营养生态位分析可知,鱼类的食物链长度和营养多样性高于甲壳类和贝类,甲壳类的食物来源多样性和营养均匀度均最高,而贝类的营养多样性和营养相似性最高。总体上,鱼类、甲壳类和贝类之间的核心营养生态位出现不同程度上重叠。基于贝叶斯混合模型分析底栖动物潜在食物来源发现,沉积有机物(Soil organic matter, SOM)为主要碳源,占78.2%,其次是浮游植物,占21.6%,而凋落物和悬浮有机质(Particulate organic matter, POM)最低,分别为3.7%和3.3%。研究结果完善了我国北缘红树林底栖动物营养关系,有助于更好地从营养调控角度开展红树林生物多样性保护与修复工作。Abstract: Mangroves represent the most productive ecosystem along the coastline. The mangrove forest is a source of diverse organic carbon, which contributes to the complexity of the trophic structure of the benthic food web. This study employed the benthic animals in the mangroves along Yanpu Bay as the research object, analysing the community trophic structure and determining the potential food sources through the utilisation of the stable isotope technique in conjunction with the Stable Isotope Bayesian Ellipses (SIBER) model and the Stable Isotope Mixing Models (Simmr). The study demonstrated that the carbon stable isotope (δ13C) values of benthic animals ranged from −22.04‰ to −11.27‰, while the nitrogen stable isotope (δ15N) values ranged the trophic levels ranged from 1.33 (Cerithidea rhizophorarum) to 3.95 (Periophthalmus cantonensis), with carbon stable isotope (δ13C) values from 5.86‰ to 16.21‰. The trophic level of fish is relatively high, ranging from 2.38 to 3.95, while that of crustaceans is 2.61 to 3.52. In contrast, the trophic level of mollusc is relatively low, ranging from 1.33 to 3.15. These differences are related to the feeding preferences of the different groups. The analysis of the nutritional structure indicates that the length of the food chain and the nutritional diversity of fish are greater than those of crustaceans and mollusc. The diversity of food sources and nutritional uniformity of crustaceans are the highest, while the nutritional diversity and similarity of mollusc are the highest. Overall, there is a varying degree of overlap between the core nutritional niches of fish, crustaceans and mollusc. An analysis of the potential food sources of benthic animals based on a Simmr mixed model revealed that SOM was the primary carbon source, accounting for 78.2% of the total, followed by phytoplankton, which constituted 21.6% of the total, while litter and POM represented the lowest proportions, at 3.7% and 3.3%, respectively. The findings of this study enhance our comprehension of the trophic relationships of benthic animals in mangrove ecosystems along the northern coast of China. They will facilitate more effective conservation and restoration of mangrove biodiversity from a trophic regulation perspective.
-
Key words:
- mangrove /
- benthic animals /
- trophic niche /
- food sources
-
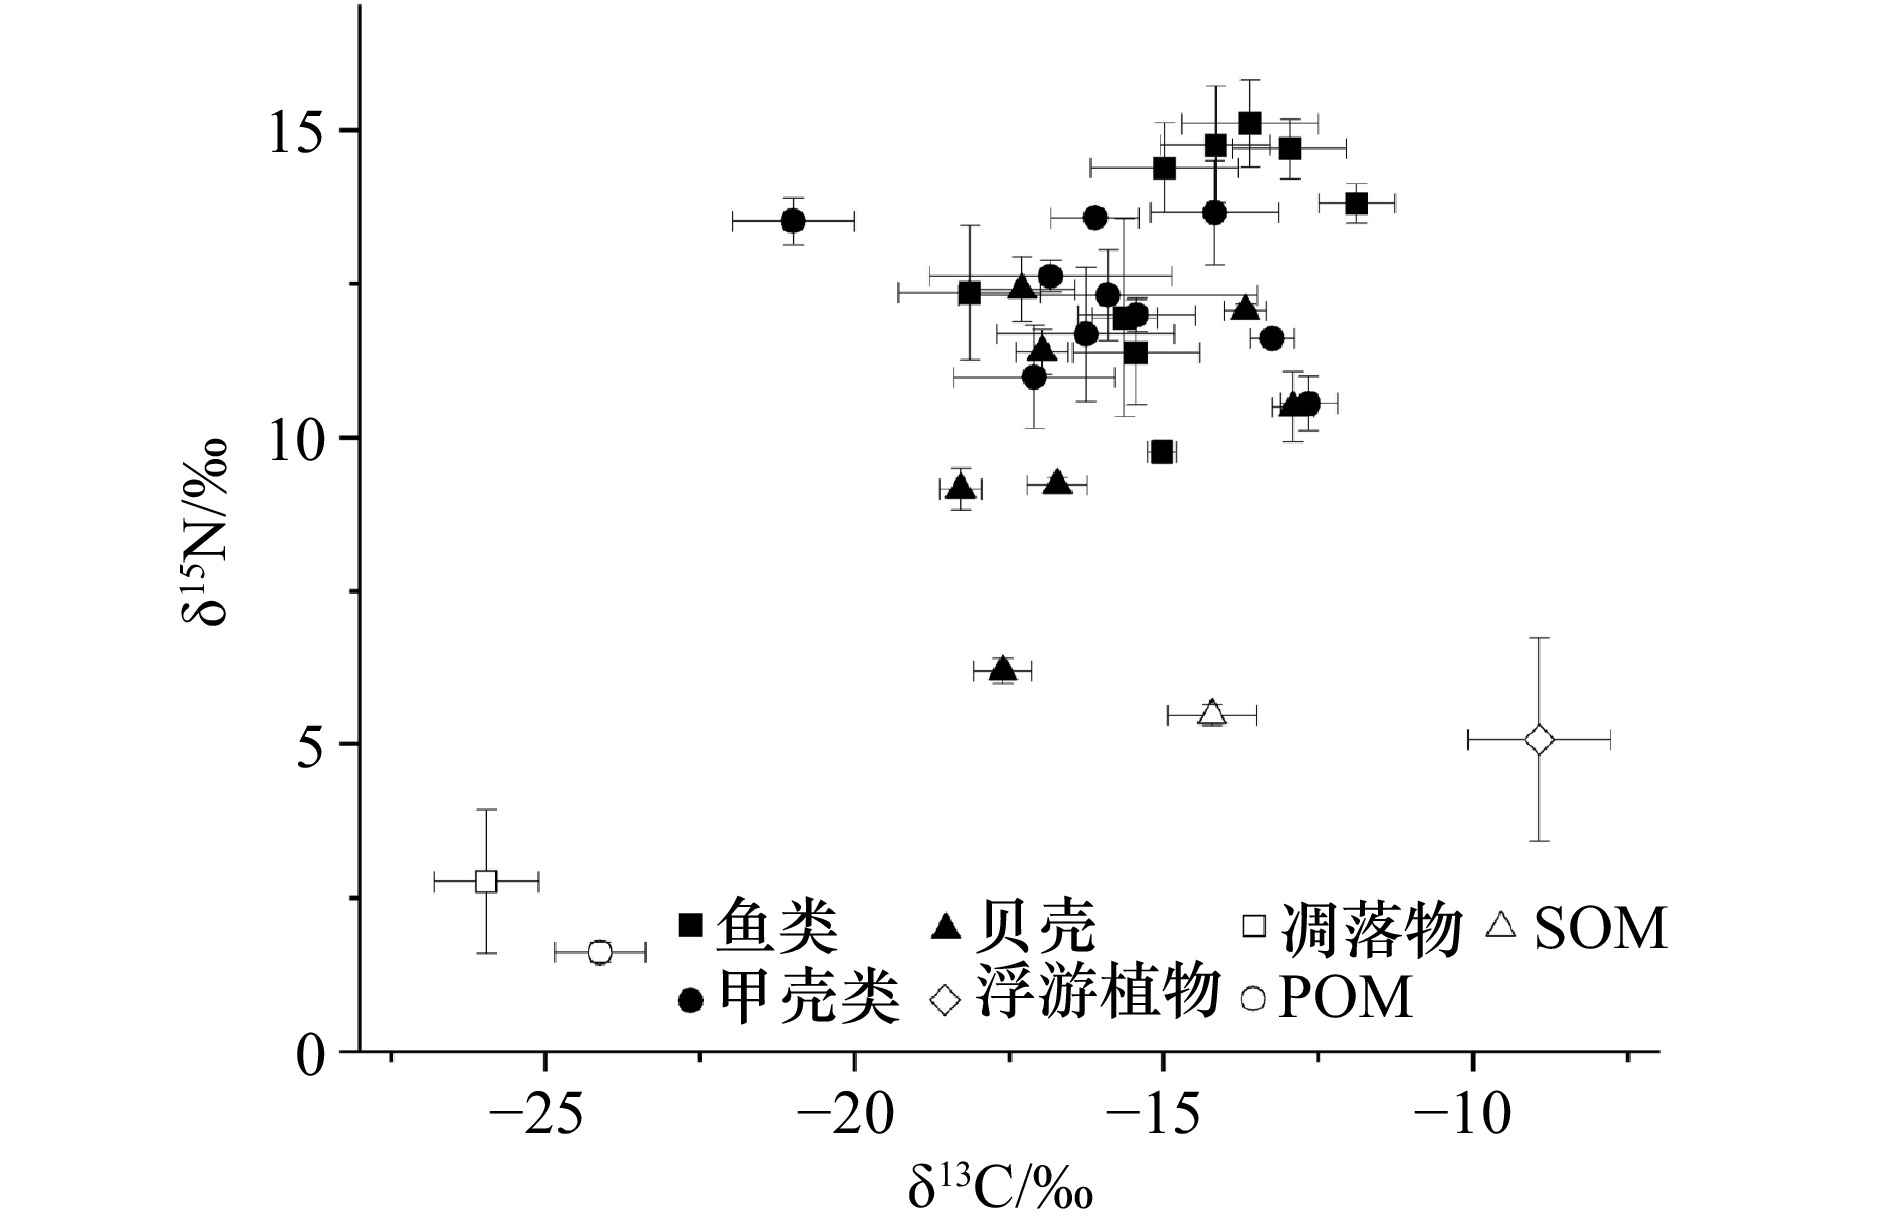
图 2 沿浦湾红树林底栖动物及其潜在碳源δ13C和δ15N分布
Fig. 2 δ13C and δ15N values of benthos and potential sources of carbon in mangrove from Yanpu Bay

图 3 沿浦湾红树林底栖动物连续营养谱
Fig. 3 Continuous trophic profiles of macrobenthos in mangrove from Yanpu Bay
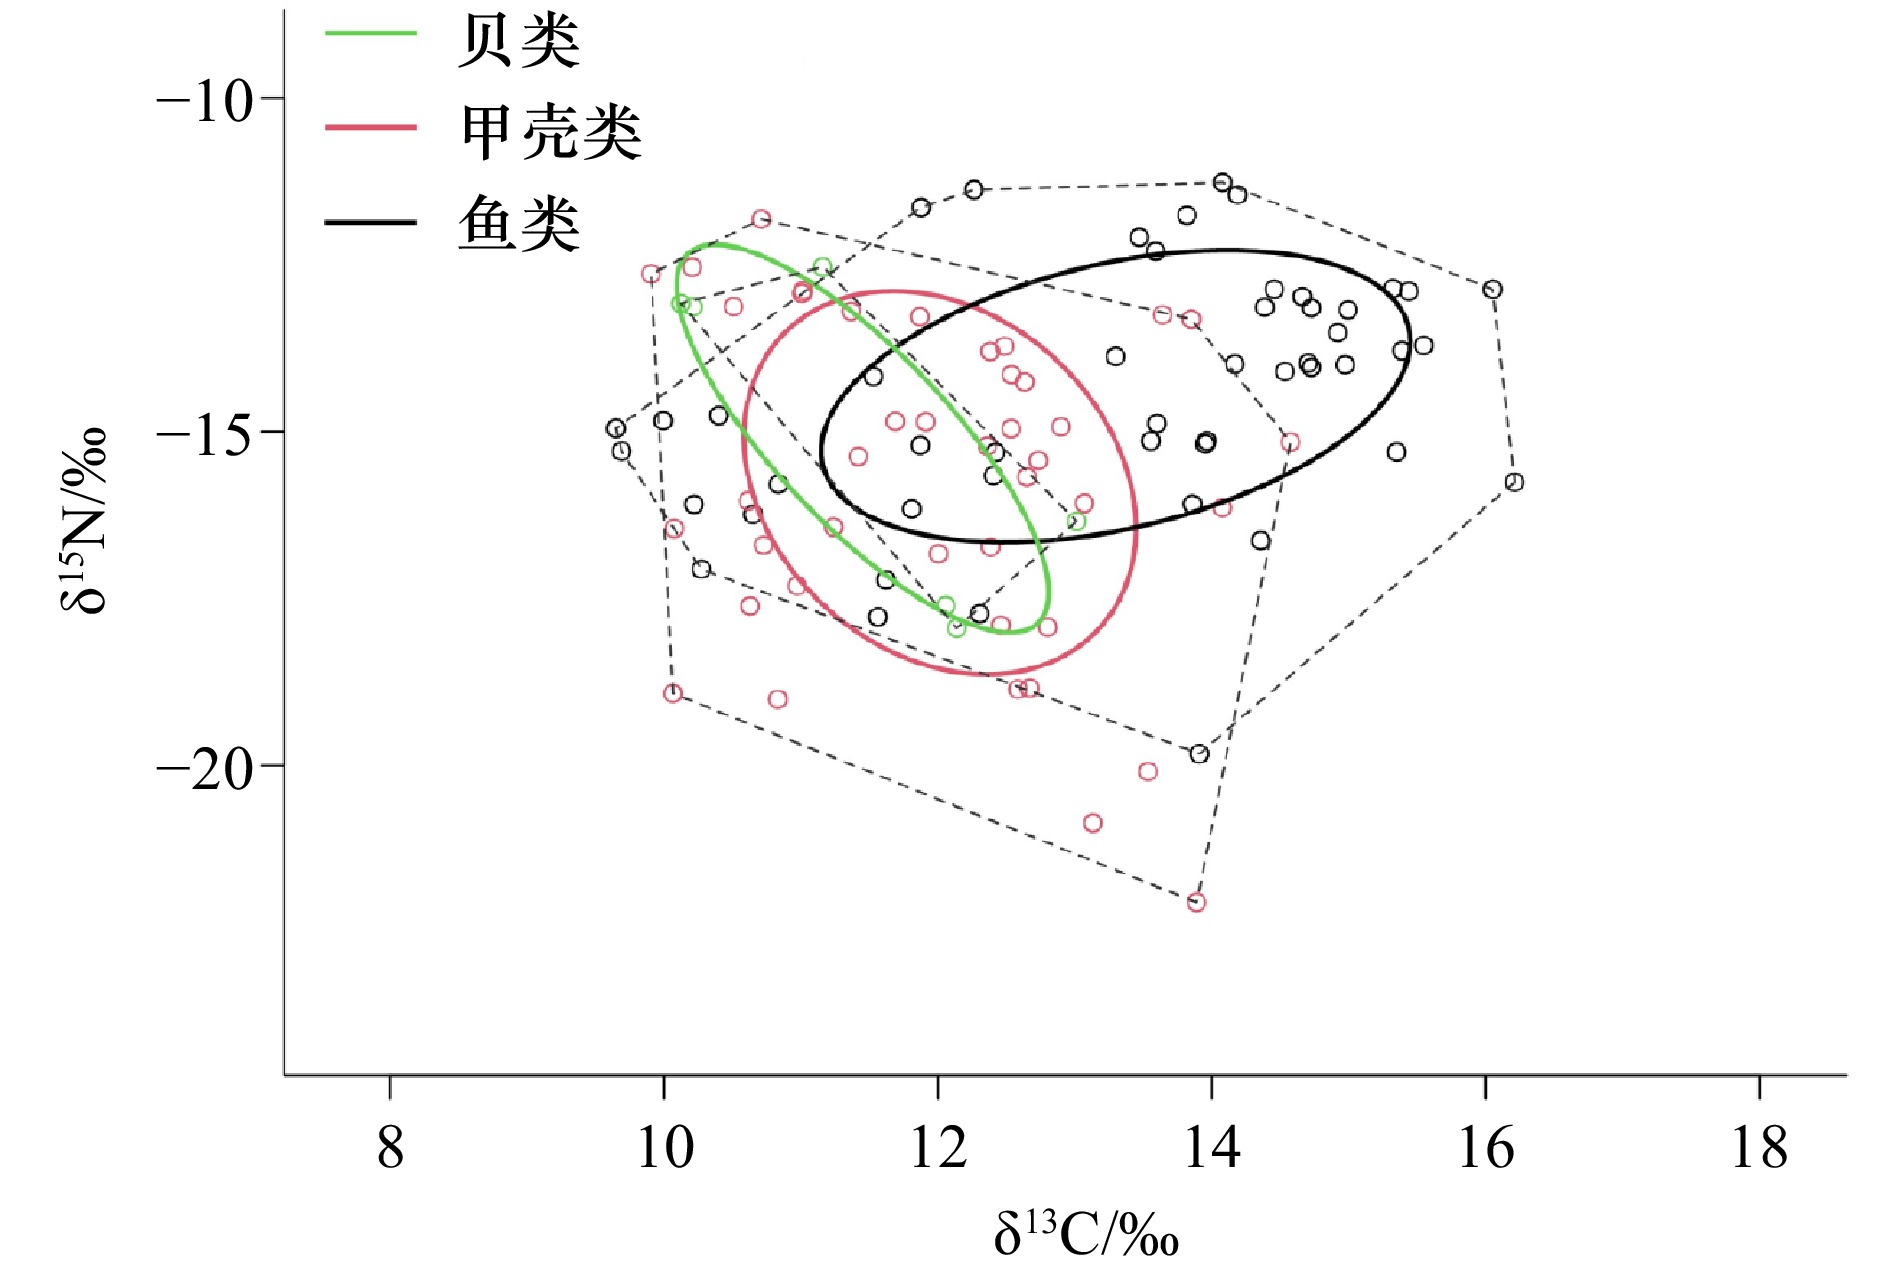
图 4 沿浦湾红树林底栖动物多边形面积(虚线)和矫正后的标准椭圆面积(实线)
Fig. 4 Corrected standard polygon area (dashed line) and ellipse area (solid line) of macrobenthos in mangrove from Yanpu Bay

图 5 沿浦湾红树林底栖动物碳源占比(左)和碳源对各类群贡献率(右)
Fig. 5 Contribution percentage of carbon sources to macrobenthos in the Yanpu Bay (left) and contribution percentage of carbon sources to each group (right)
表 1 沿浦湾底栖动物及基础碳源稳定同位素信息
Tab. 1 Isotopic information of macrobenthos and carbon sources in mangrove from Yanpu Bay
物种 拉丁名 样本数 δ13C/‰ δ15N/‰ 体长范围/mm 体重范围/g 鲻 Mugil cephalus 3 −15.02 ± 0.24 9.77 ± 0.19 50.73~55.11 1.26~1.71 鮻 Planiliza haematocheila 6 −15.44 ± 1.03 11.38 ± 0.86 63.50~79.60 1.80~4.79 花鲈 Lateolabrax maculatus 6 −15.63 ± 0.53 11.94 ± 1.61 60.00~138.80 1.67~27.76 尖吻蛇鳗 Ophichthus apicalis 4 −18.13 ± 1.15 12.35 ± 1.09 73.80~299.80 1.71~6.19 青弹涂鱼 Scartelaos histophorus 4 −11.9 ± 0.37 13.76 ± 0.32 127.30~132.20 6.14~6.70 斑尾刺鰕虎鱼 Acanthogobius ommaturus 6 −14.98 ± 1.20 14.38 ± 0.72 51.00~115.60 1.08~11.35 弹涂鱼 Periophthalmus modestus 6 −12.96 ± 0.93 14.69 ± 0.49 62.00~75.80 2.37~4.50 中华乌塘鳢 Bostrychus sinensis 6 −14.16 ± 0.88 14.76 ± 0.95 14.39~104.02 5.21~30.35 大鳍弹涂鱼 Periophthalmus magnuspinnatus 8 −13.6 ± 1.11 15.1 ± 0.71 48.20~138.20 0.70~14.33 弧边招潮蟹 Uca arcuata 6 −12.65 ± 0.46 10.55 ± 0.44 14.27~28.61 5.01~9.93 红螯螳臂相手蟹 Chiromantes haematocheir 6 −17.09 ± 1.30 10.98 ± 0.84 17.25~26.13 2.85~8.40 日本大眼蟹 Macrophthalmus japonicus 2 −13.24 ± 0.35 11.61 ± 0.06 23.57~26.51 5.89~6.33 天津厚蟹 Helice tientsinensis 6 −16.26 ± 1.44 11.68 ± 1.09 19.75~32.50 2.51~16.10 长足长方蟹 Metaplax longipes 4 −15.43 ± 0.94 11.99 ± 0.28 19.30~25.00 0.95~5.00 鲜明鼓虾 Alpheus distinguendus 6 −15.9 ± 2.41 12.31 ± 0.73 27.00~49.00 0.92~3.05 脊尾白虾 Exopalaemon carinicauda 3 −16.83 ± 1.97 12.62 ± 0.26 37.50~59.20 0.40~1.20 字纹弓蟹 Varuna litterata 3 −20.99 ± 0.99 13.51 ± 0.38 27.50~35.89 11.22~14.08 四齿大额蟹 Metopograpsus quadridentatus 2 −16.1 ± 0.71 13.57 ± 0.05 25.64~27.89 7.67~8.02 拟穴青蟹 Scvlla paramamosain 4 −14.17 ± 1.03 13.65 ± 0.84 71.00~90.80 61.20~115.49 红树拟蟹守螺 Cerithidea rhizophorarum 2 −17.6 ± 0.47 6.19 ± 0.21 15.56~21.97 1.56~2.67 黑口拟滨螺 Littoraria melanostoma 2 −18.28 ± 0.34 9.16 ± 0.34 18.36~21.77 5.61~5.89 缢蛏 Sinonovacula lamarcki 2 −16.72 ± 0.48 9.23 ± 0.12 22.56~35.82 12.68~19.89 尖锥拟蟹守螺 Cerithidea largillierti 4 −12.91 ± 0.33 10.49 ± 0.57 5.66~20.65 1.41~20.10 粗糙拟滨螺 Littoraria scabra 2 −16.96 ± 0.41 11.39 ± 0.36 20.56~21.97 28.94~31.46 珠带拟蟹守螺 Cerithidea cingulata 2 −13.68 ± 0.34 12.06 ± 0.11 12.68~15.69 1.09~2.07 文蛤 Meretrix meretrix 3 −17.29 ± 0.84 12.4 ± 0.53 32.56~33.86 24.46~29.09 POM — 3 −24.11 ± 0.73 1.61 ± 0.16 — — 凋落物 — 6 −25.95 ± 0.83 2.76 ± 1.17 — — 浮游植物 — 3 −8.92 ± 1.15 5.07 ± 5.65 — — SOM — 6 −14.21 ± 0.72 5.46 ± 0.17 — —  下载: 导出CSV
表 2 沿浦湾红树林底栖动物不同类群营养结构特征
Tab. 2 Trophic structure characteristics of different groups of macrobenthos in mangrove from Yanpu Bay
营养指标 鱼类 甲壳类 贝类 δ15N值范围(NR) 6.23 3.09 6.21 δ13C值范围(CR) 4.99 8.34 5.36 平均离心距离(CD) 2.28 1.92 2.56 平均最近相邻距离(MNND) 1.02 1.37 1.68 最邻距离标准差(SDNND) 0.71 1.08 0.66 多边形总面积(TA) 3.73 3.39 2.46 标准椭圆面积(SEAC) 1.01 0.92 1.35
下载: 导出CSV
-
[1] 石莉. 中国红树林及其生态环境功能的综合分析与研究[D]. 青岛: 中国海洋大学, 2003.Shi Li. Comprehensive analysis of mangrove in China and its eco-environmental functions[D]. Qingdao: Ocean University Of China, 2003. [2] Mattone C, Sheaves M. Mangrove forest ecological function is influenced by the environmental settings and the benthic fauna composition[J]. Estuarine, Coastal and Shelf Science, 2024, 309: 108959. doi: 10.1016/j.ecss.2024.108959 [3] 严丽君, 王普, 施启龙, 等. 动物食性分析在生态学中的应用研究进展——基于DNA宏条形码技术[J]. 生态学报, 2023, 43(8): 3007−3019.Yan Lijun, Wang Pu, Shi Qilong, et al. Applications of animal diet analysis based on DNA metabarcoding in ecological research[J]. Acta Ecologica Sinica, 2023, 43(8): 3007−3019. [4] Zhao Yongsong, Yang Tao, Shan Xiujuan, et al. Stable isotope analysis of food web structure and the contribution of carbon sources in the sea adjacent to the Miaodao Archipelago (China)[J]. Fishes, 2023, 7(1): 32. [5] Giarrizzo T, Schwamborn R, Saint-Paul U. Utilization of carbon sources in a northern Brazilian mangrove ecosystem[J]. Estuarine, Coastal and Shelf Science, 2011, 95(4): 447−457. doi: 10.1016/j.ecss.2011.10.018 [6] Noghabi N A, Shojaei M G, Farahani M M, et al. Stable isotopes reveal the food sources of benthic macroinvertebrates in the arid mangrove ecosystem of the persian gulf[J]. Estuaries and Coasts, 2022, 45(7): 2241−2253. doi: 10.1007/s12237-022-01083-9 [7] Bouillon S, Koedam N, Raman A, et al. Primary producers sustaining macro-invertebrate communities in intertidal mangrove forests[J]. Oecologia, 2002, 130(3): 441−448. doi: 10.1007/s004420100814 [8] Layman C A, Arrington D A, Montaña C G, et al. Can stable isotope ratios provide for community-wide measures of trophic structure?[J]. Ecology, 2007, 88(1): 42−48. doi: 10.1890/0012-9658(2007)88[42:CSIRPF]2.0.CO;2 [9] 张欢, 谢平, 吴功果, 等. 日本沼虾与秀丽白虾的营养生态位[J]. 环境科学研究, 2013, 26(1): 22−26.Zhang Huan, Xie Ping, Wu Gongguo, et al. Studies on trophic niches of macrobrachium nipponensis and exopalaemon modestus[J]. Research of Environmental Sciences, 2013, 26(1): 22−26. [10] Jackson A L, Inger R, Parnell A C, et al. Comparing isotopic niche widths among and within communities: SIBER - Stable Isotope Bayesian Ellipses in R[J]. Journal of Animal Ecology, 2011, 80(3): 595−602. doi: 10.1111/j.1365-2656.2011.01806.x [11] Muro-Torres V M, Amezcua F, Soto-Jiménez M, et al. Primary sources and food web structure of a tropical wetland with high density of mangrove forest[J]. Water, 2020, 12(11): 3105. doi: 10.3390/w12113105 [12] 上官明珠, 胡成业, 王晶, 等. 我国北缘红树林大型底栖动物群落beta多样性格局及其驱动因素[J/OL]. 水产学报, 1−13[2024−12−26]. http://kns.cnki.net/kcms/detail/31.1283.S.20231206.1637.002.html.Shangguan Mingzhu, Hu Chengye, Wang Jing, et al. Beta diversity patterns and its driving factors of the northern margin mangrove macrobenthos community in China[J/OL]. Journal of Fisheries of China, 1−13[2024−12−26]. http://kns.cnki.net/kcms/detail/31.1283.S.20231206.1637.002.html. [13] 范魏丰, 唐荣叶, 俞越, 等. 潮汕海岸带红树林小型底栖动物的群落特征及生态环境质量评价[J]. 海洋学报, 2024, 46(5): 68−80.Fan Weifeng, Tang Rongye, Yu Yue, et al. Meiofaunal community and eco-environment quality evaluation in mangroves off Chaoshan coastal zone[J]. Haiyang Xuebao, 2024, 46(5): 68−80. [14] Post M D. Individual variation in the timing of ontogenetic niche shifts in largemouth bass[J]. Ecology, 2003, 84(5): 1298−1310. doi: 10.1890/0012-9658(2003)084[1298:IVITTO]2.0.CO;2 [15] Fry B. Food web structure on Georges Bank from stable C, N, and S isotopic compositions[J]. Limnology and Oceanography, 1988, 33(5): 1182−1190. doi: 10.4319/lo.1988.33.5.1182 [16] Ben-David M, Flaherty E A. Stable isotopes in mammalian research: a beginner's guide[J]. Journal of Mammalogy, 2012, 93(2): 312−328. doi: 10.1644/11-MAMM-S-166.1 [17] Cabana G, Rasmussen J B. Comparison of aquatic food chains using nitrogen isotopes[J]. Proceedings of the National Academy of Sciences of the United States of America, 1996, 93(20): 10844−10847. doi: 10.1073/PNAS.93.20.10844 [18] Post D M. Using stable isotopes to estimate trophic position: models, methods, and assumptions[J]. Ecology, 2002, 83(3): 703−718. doi: 10.1890/0012-9658(2002)083[0703:USITET]2.0.CO;2 [19] 徐军, 张敏, 谢平. 氮稳定同位素基准的可变性及对营养级评价的影响[J]. 湖泊科学, 2010, 22(1): 8−20. doi: 10.18307/2010.0102Xu Jun, Zhang Min, Xie Ping. Variability of stable nitrogen isotopic baselines and its consequence for trophic modeling[J]. Journal of Lake Sciences, 2010, 22(1): 8−20. doi: 10.18307/2010.0102 [20] Abrantes K, Sheaves M. Incorporation of terrestrial wetland material into aquatic food webs in a tropical estuarine wetland[J]. Estuarine, Coastal and Shelf Science, 2008, 80(3): 401−412. doi: 10.1016/j.ecss.2008.09.009 [21] 贺泽华. 珠江口淇澳红树林水域主要鱼类营养生态位和耳石微化学研究[D]. 大连: 大连海洋大学, 2024.He Zehua. Trophic niche and otolith microchemistry of major fish in the pearl river estuary qi'ao mangrove water area[D]. Dalian: Dalian Ocean University, 2024. [22] 蒋日进. 枸杞岛近岸海域食物网结构研究[D]. 上海: 上海海洋大学, 2015.Jiang Rijin. Research on the food web structure in the costal areas of Gouqi island[D]. Shanghai: Shanghai Ocean University, 2015. [23] 陆亚楠, 张瑞, 张虎, 等. 应用稳定同位素技术研究江苏近海食物网营养结构的季节性变化[J]. 海洋学报, 2022, 44(2): 1−10. doi: 10.12284/j.issn.0253-4193.2022.2.hyxb202202001Lu Ya’nan, Zhang Rui, Zhang Hu, et al. Seasonal variation in the trophic structure of food webs in coastal waters of Jiangsu Province based on stable isotope techniques[J]. Haiyang Xuebao, 2022, 44(2): 1−10. doi: 10.12284/j.issn.0253-4193.2022.2.hyxb202202001 [24] 彭彪彪, 王思凯, 赵峰, 等. 长江口盐沼湿地3种亚生境中国花鲈的碳、氮稳定同位素特征及基础食源差异[J]. 中国水产科学, 2022, 29(2): 295−303.Peng Biaobiao, Wang Sikai, Zhao Feng, et al. Carbon and nitrogen isotopic characteristics and food source differences of Lateolabrax maculatus in three sub habitats of salt marsh wetland in the Yangtze River Estuary[J]. Journal of Fishery Sciences of China, 2022, 29(2): 295−303. [25] Hobson K A. Trophic relationships among high Arctic seabirds: insights from tissue-dependent stable-isotope models[J]. Marine Ecology Progress Series, 1993, 95(1/2): 7−18. [26] Kamimura S, Tsuchiya M. The effect of feeding behavior of the gastropods Batillaria zonalis and Cerithideopsilla cingulata on their ambient environment[J]. Marine Biology, 2004, 144(4): 705−712. doi: 10.1007/s00227-003-1238-x [27] Wang Sikai, Chu Tianjiang, Huang Danqing, et al. Incorporation of exotic Spartina alterniflora into diet of deposit-feeding snails in the Yangtze river estuary salt marsh: stable isotope and fatty acid analyses[J]. Ecosystems, 2014, 17(4): 567−577. doi: 10.1007/s10021-013-9743-3 [28] 王瑁, 高雪芹, 丁弈朋, 等. 海南清澜港不同栖息位置红树林软体动物的食物来源[J]. 湿地科学, 2015, 13(2): 171−176. doi: 10.13248/j.cnki.wetlandsci.2015.02.006Wang Mao, Gao Xueqin, Ding Yipeng, et al. Identification of the food sources of mangrove molluscs from different microhabitats at Qinglangang, Hainan[J]. Wetland Science, 2015, 13(2): 171−176. doi: 10.13248/j.cnki.wetlandsci.2015.02.006 [29] Kjeldgaard M K, Hewlett J A, Eubanks M D. Widespread variation in stable isotope trophic position estimates: patterns, causes, and potential consequences[J]. Ecological Monographs, 2021, 91(3): e01451. doi: 10.1002/ecm.1451 [30] Zanden M J V, Rasmussen J B. Variation in δ15N and δ13C trophic fractionation: implications for aquatic food web studies[J]. Limnology and Oceanography, 2001, 46(8): 2061−2066. doi: 10.4319/lo.2001.46.8.2061 [31] Ziółkowska M, Sokołowski A. Variation of food web structure in macrobenthic communities in low diversity system as determined by stable isotope-based community-wide metrics[J]. Estuarine, Coastal and Shelf Science, 2022, 274: 107931. doi: 10.1016/j.ecss.2022.107931 [32] 游欣欣, 卞超, 陈洁明, 等. 弹涂鱼两栖习性的基因组学研究进展[J]. 海洋渔业, 2015, 37(5): 479−484.You Xin Xin, Bian Chao, Chen Jieming et al. Recent advances in genomic study on amphibious mudskippers[J]. Marine Fisheries, 2015, 37(5): 479−484. [33] Ponce T, Cubillos L A, Ciancio J, et al. Isotopic niche and niche overlap in benthic crustacean and demersal fish associated to the bottom trawl fishing in south-central Chile[J]. Journal of Sea Research, 2021, 173: 102059. doi: 10.1016/j.seares.2021.102059 [34] 程济生, 朱金声. 黄海主要经济无脊椎动物摄食特征及其营养层次的研究[J]. 海洋学报, 1997, 19(6): 117−126.Cheng Jisheng, Zhu Jinsheng. Study on the feeding habit and trophic level ofmain economic invertebrates in the Yellow Sea[J]. Acta Oceanologica Sinica, 1997, 19(6): 117−126. [35] 谢斌, 李云凯, 张虎, 等. 基于稳定同位素技术的海州湾海洋牧场食物网基础及营养结构的季节性变化[J]. 应用生态学报, 2017, 28(7): 2292−2298. doi: 10.13287/j.1001-9332.201707.019Xie Bin, Li Yunkai, Zhang Hu, et al. Food web foundation and seasonal variation of trophic structure based on the stable isotopic technique in the marine ranching of Haizhou Bay, China[J]. Chinese Journal of Applied Ecology, 2017, 28(7): 2292−2298. doi: 10.13287/j.1001-9332.201707.019 [36] 张丽源. 沿浦湾大型底栖动物优势种生境适宜性研究[D]. 舟山: 浙江海洋大学, 2022.Zhang Liyuan. Habitat suitability of dominant macrobenthic species in Yanpu Bay[D]. Zhoushan: Zhejiang Ocean University, 2022. [37] 马荣荣, 宋超, 王妤, 等. 崇明东滩南部大弹涂鱼食源的稳定同位素分析[J]. 海洋渔业, 2017, 39(4): 419−426. doi: 10.13233/j.cnki.mar.fish.2017.04.007Ma Rongrong, Song Chao, Wang Yu, et al. Stable isotope analysis of food source of Boleophthalmus pectinirostris collected from the south of Chongming Dongtan saltmarsh[J]. Marine Fisheries, 2017, 39(4): 419−426. doi: 10.13233/j.cnki.mar.fish.2017.04.007 [38] 丁福红, 毛守康, 雷霁霖, 等. 我国植物食性海水鱼类养殖发展前景[J]. 海洋科学, 2014, 38(11): 131−137.Ding Fuhong, Mao Shoukang, Lei Jilin, et al. Prospect of herbivorous fish in marine aquaculture of China[J]. Marine Sciences, 2014, 38(11): 131−137. [39] 杨睿尧. 海漂垃圾堆积对九龙江口红树林大型底栖动物群落结构及食源的影响[D]. 上海: 上海海洋大学, 2023, doi: 10.27314/d.cnki.gsscu.2023.000381.Yang Ruiyao. Effects of marine debris accumulation on community structure and food sources of mangrove macrobenthos in Jiulong river estuary[D]. Shanghai: Shanghai Ocean University, 2023, doi: 10.27314/d.cnki.gsscu.2023.000381. [40] 宋建达. 北部湾拟穴青蟹食源分析及摄食不同饵料对其生长的影响[D]. 济南: 山东大学, 2022.Song Jianda. Analysis of focd source of mud crab (Scylla paramamosain) in Beibu Gulf and effect of different baits on its growth[D]. Ji’nan: Shandong University, 2022. [41] 吕聪聪, 马亚东, 水柏年, 等. 瓯江口红树林沉积物有机碳埋藏及来源特征和影响因素[J]. 应用生态学报, 2024, 35(10): 2688−2696. doi: 10.13287/j.1001-9332.202410.012Lyu Congcong, Ma Yadong, Shui Bonian, et al. Burial, source characteristics and influencing factors of organic carbon in mangrove sediments at the mouth of the Oujiang River Estuary, China[J]. Chinese Journal of Applied Ecology, 2024, 35(10): 2688−2696. doi: 10.13287/j.1001-9332.202410.012 [42] Kristensen E, Bouillon S, Dittmar T, et al. Organic carbon dynamics in mangrove ecosystems: a review[J]. Aquatic Botany, 2008, 89(2): 201−219. doi: 10.1016/j.aquabot.2007.12.005 [43] 王宗林, 吴沿友, 邢德科, 等. 泉州湾红树林湿地土壤CO2通量周期性变化特征[J]. 应用生态学报, 2014, 25(9): 2563−2568. doi: 10.13287/j.1001-9332.20140611.004Wang Zonglin, Wu Yanyou, Xing Deke, et al. Periodic characteristics of soil CO2 flux in mangrove wetland of Quanzhou Bay, China[J]. Chinese Journal of Applied Ecology, 2014, 25(9): 2563−2568. doi: 10.13287/j.1001-9332.20140611.004 [44] Vizzini S, Mazzola A. Sources and transfer of organic matter in food webs of a Mediterranean coastal environment: evidence for spatial variability[J]. Estuarine, Coastal and Shelf Science, 2006, 66(3/4): 459−467. [45] Hadwen W L, Russell G L, Arthington A H. Gut content- and stable isotope-derived diets of four commercially and recreationally important fish species in two intermittently open estuaries[J]. Marine and Freshwater Research, 2007, 58(4): 363−375. doi: 10.1071/MF06157 [46] Henriques M, Granadeiro J P, Piersma T, et al. Assessing the contribution of mangrove carbon and of other basal sources to intertidal flats adjacent to one of the largest West African mangrove forests[J]. Marine Environmental Research, 2021, 169: 105331. doi: 10.1016/j.marenvres.2021.105331 -


计量
- 文章访问数: 426
- HTML全文浏览量: 392
- PDF下载量: 60
- 被引次数: 0
