

A study on the shoreline change of the Jiehe Beach in the northeastern Laizhou Bay over the past 40 years based on a large number of satellite images
-
摘要: 近几十年来,位于莱州湾东北部的界河两侧海滩(以下简称“界河海滩”)在河流入海泥沙减少背景下发生严重侵蚀,再加上裕龙岛(一个大型离岸人工岛)等沿海工程建设的影响,界河海滩的海岸线演变异常复杂。本文使用1984−2024年的
1186 幅卫星图像,采用聚焦剖面方法和亚像素海岸线识别技术研究界河海滩的海岸线演变,评估河流输沙和沿海工程的影响。结果显示界河海滩早期(1984−2004年)的演变主要受界河河口的封闭和打开、沙嘴的沿岸运移以及沙坝的向岸运移控制,总体上发生侵蚀;界河海滩后期(2004−2024年)的演变主要受裕龙岛等沿海工程建造影响,总体上发生淤进。在沿海开发日益加剧的今天,合理布局沿海工程有望减缓海滩侵蚀。Abstract: In recent decades, the beaches on both sides of the Jiehe River (hereinafter referred to as Jiehe Beach) in the northeastern part of Laizhou Bay have suffered severe erosion due to reduced riverine sediment input to the sea. Additionally, the construction of coastal engineering projects such as Yulong Island (a large artificial offshore island) has made the evolution of the Jiehe Beach shoreline exceptionally complex. This paper utilizes1186 satellite images from 1984 to 2024, employing a transect-focused method and sub-pixel shoreline recognition technology to study the evolution of the Jiehe Beach shoreline and assess the impacts of river sediment discharge and coastal engineering. The results show that the early evolution (1984−2004) of Jiehe Beach was primarily controlled by the closure and opening of the Jiehe River estuary, the alongshore movement of sand spits, and the onshore movement of sandbars, with overall erosion occurring. The later evolution (2004−2024) of Jiehe Beach was mainly influenced by the construction of coastal engineering projects such as Yulong Island, with overall accretion occurring. In today’s era of intensifying coastal development, the rational layout of coastal engineering is expected to mitigate beach erosion.-
Key words:
- remote sensing /
- Shandong Peninsula /
- shoreline /
- estuary closure /
- artificial offshore island
-

图 1 界河海滩及其周边主要沿海工程(a),界河海滩在山东半岛的位置(b)
Fig. 1 Jiehe Beach and its surrounding major coastal projects (a), the location of Jiehe Beach in Shandong Peninsula (b)

图 2 1984−2024年界河海滩Landsat和Sentinel-2卫星图像的时间和类型(a)、每年数量(b)和拍摄时的瞬时水位(c)
Fig. 2 Date and type (a), annual number (b) and instantaneous water level at the shooting time (c) of Landsat and Sentinel-2 satellite images of Jiehe Beach from 1984 to 2024

图 3 计算机辅助海岸线位置识别软件(CASPRS)的操作界面
Fig. 3 Operating interface of the computer-aided shoreline position recognition software (CASPRS)

图 4 线状固定地物在检查剖面C1和C2上的位置的相关性
a. Sentinel图像,b. Landsat图像。μ-平均值,σ-标准偏差,单位均为m
Fig. 4 Correlationship between the positions of linear fixed objects on check transect C1 and C2
a. Sentinel image, b. Landsat image. μ-average, σ-standard deviation, all units are m

图 5 1984−2024年界河海滩平均潮位线在研究剖面J1−J26上的位置变化
Fig. 5 Position change of the mean water line of Jiehe Beach on study transects J1−J26 from 1984 to 2024
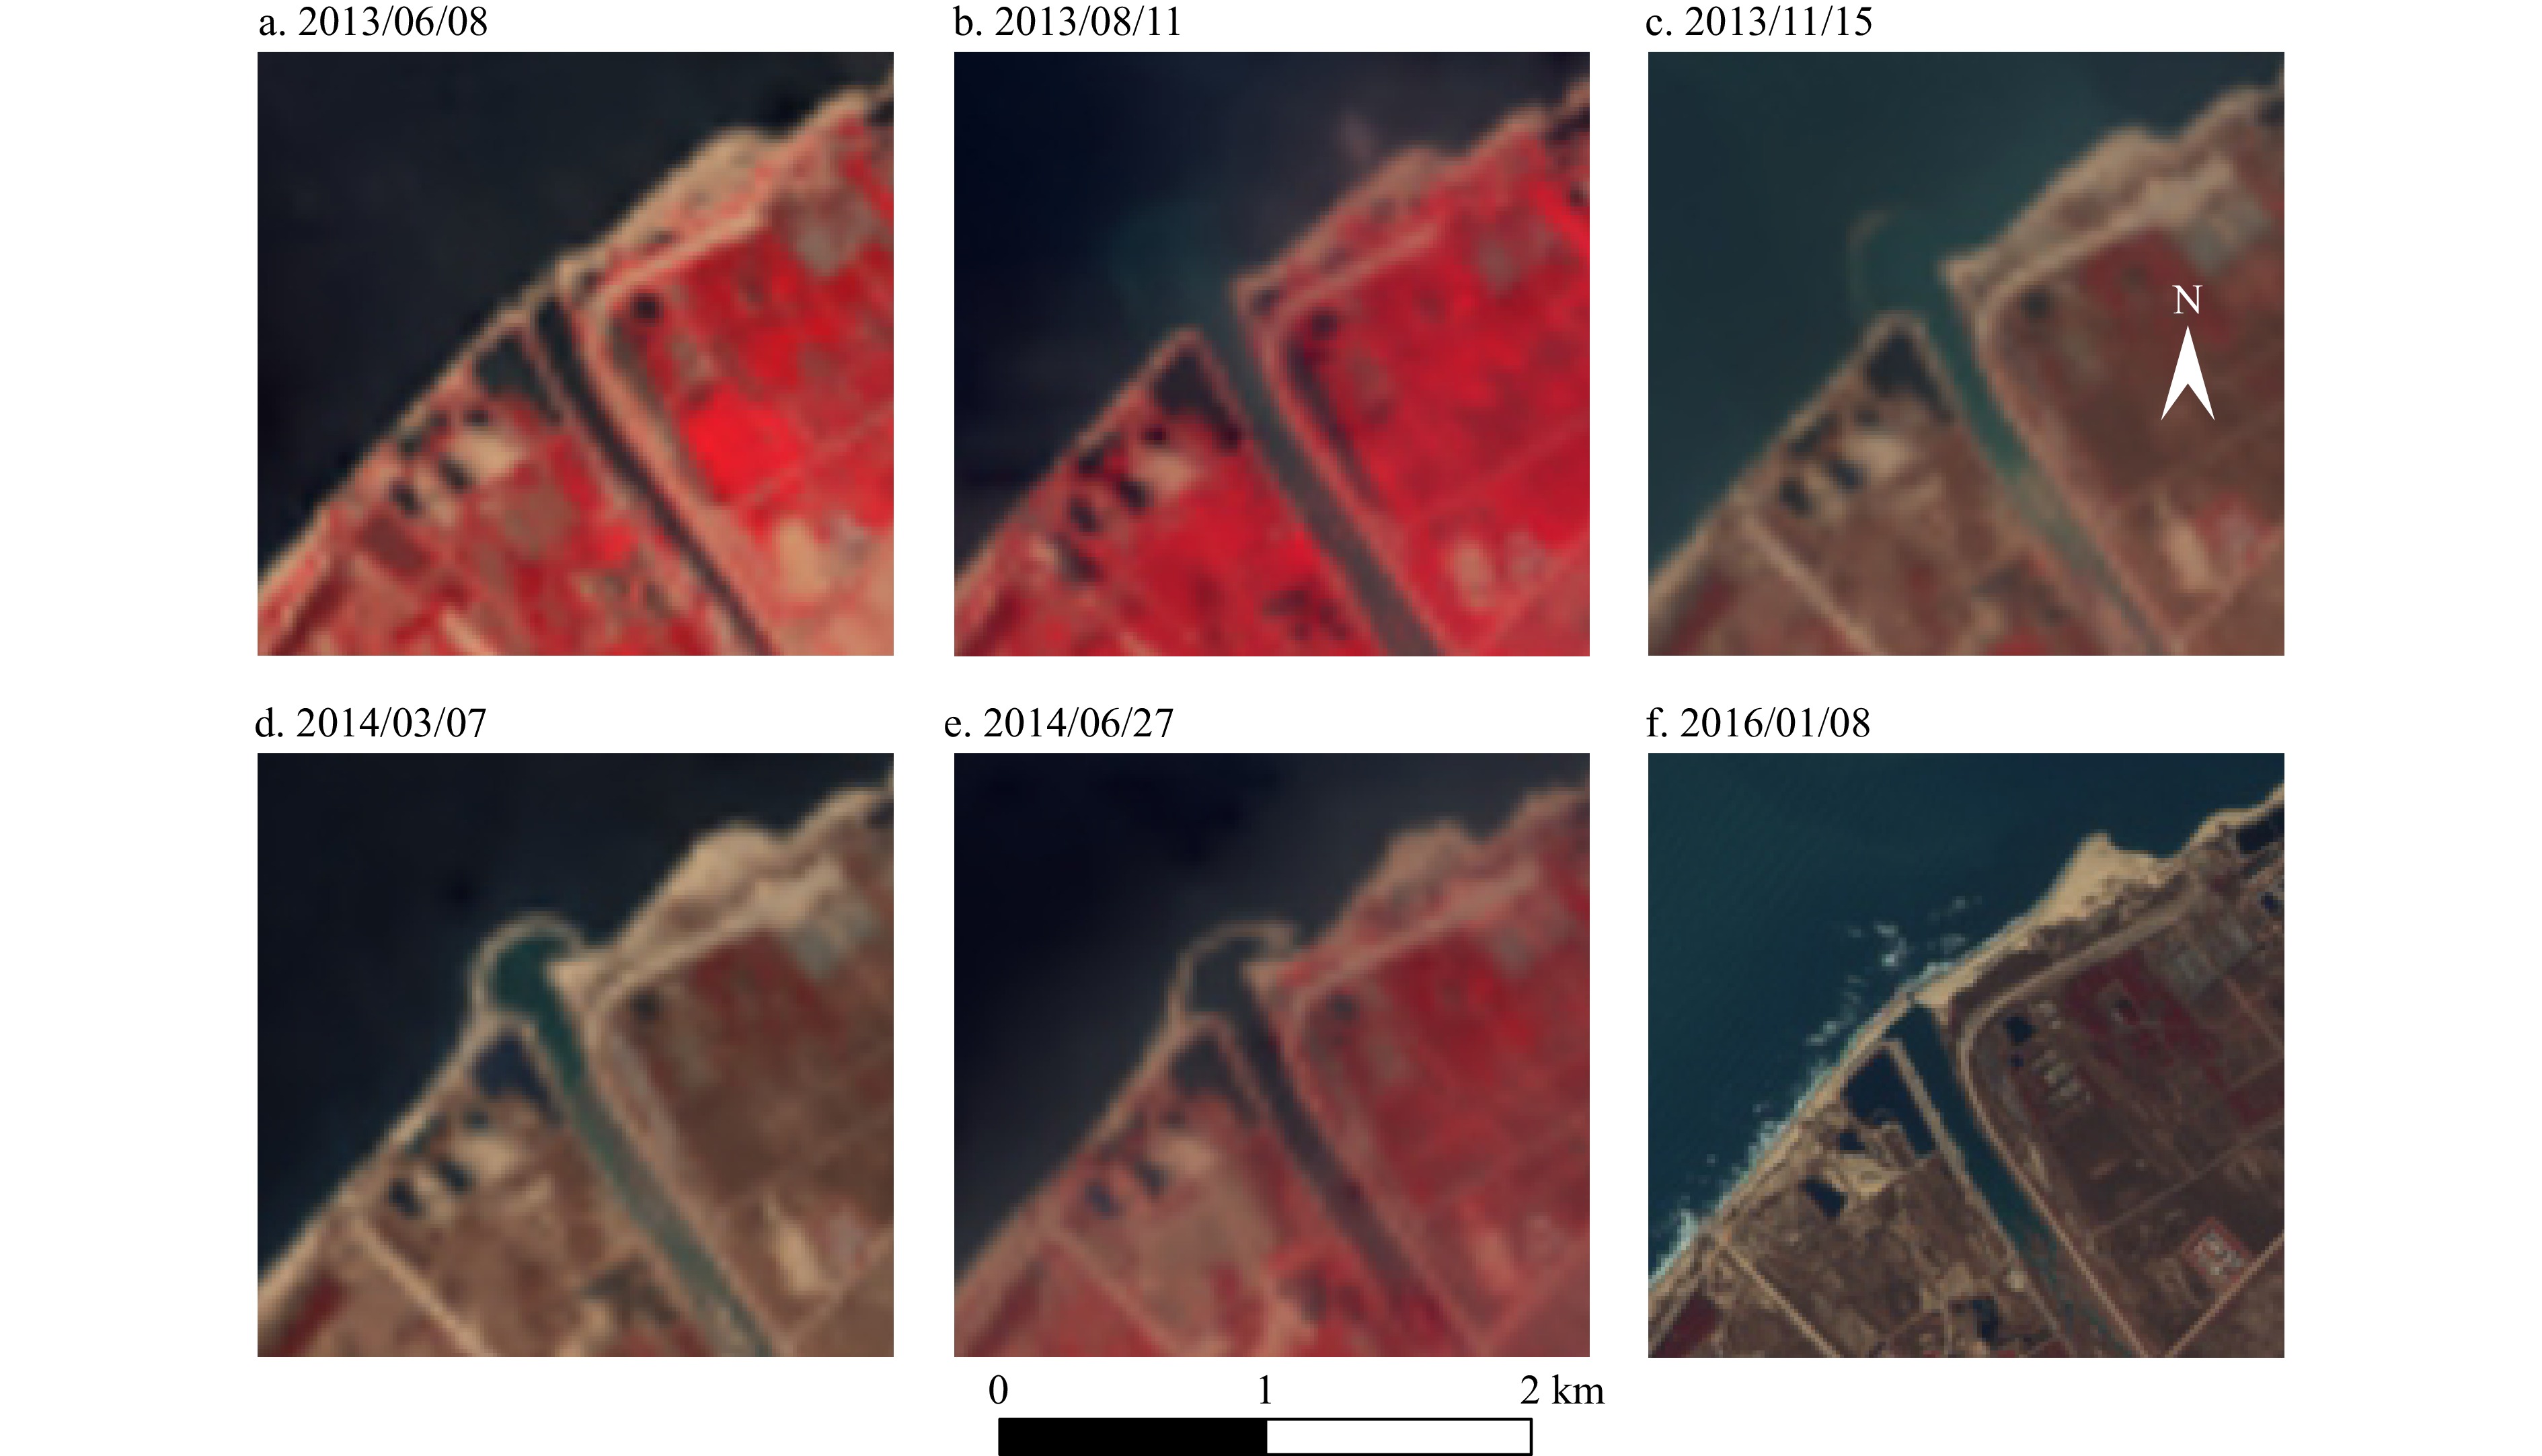
图 6 界河河口在2013−2016年的打开和封闭过程
a. 2013/06/08(河口封闭);b. 2013/08/11(河口打开);c. 2013/11/15(环形河口沙坝初步形成);d. 2014/03/07(环形河口沙坝形成);e. 2014/06/27(环形沙坝向岸运移);f. 2016/01/08(河口沙坝与周边岸线平齐)
Fig. 6 Open and close process of Jiehe Estuary from 2013 to 2016
a. 2013/06/08 (closure of the estuary); b. 2013/08/11 (opening of the estuary); c. 2013/11/15 (initial formation of the circular estuary sandbar); d. 2014/03/07 (formation of the circular estuary sandbar); e. 2014/06/27 (transport of the circular sandbar towards the shore); f. 2016/01/08 (alignment of the estuary sandbar with the surrounding shoreline)
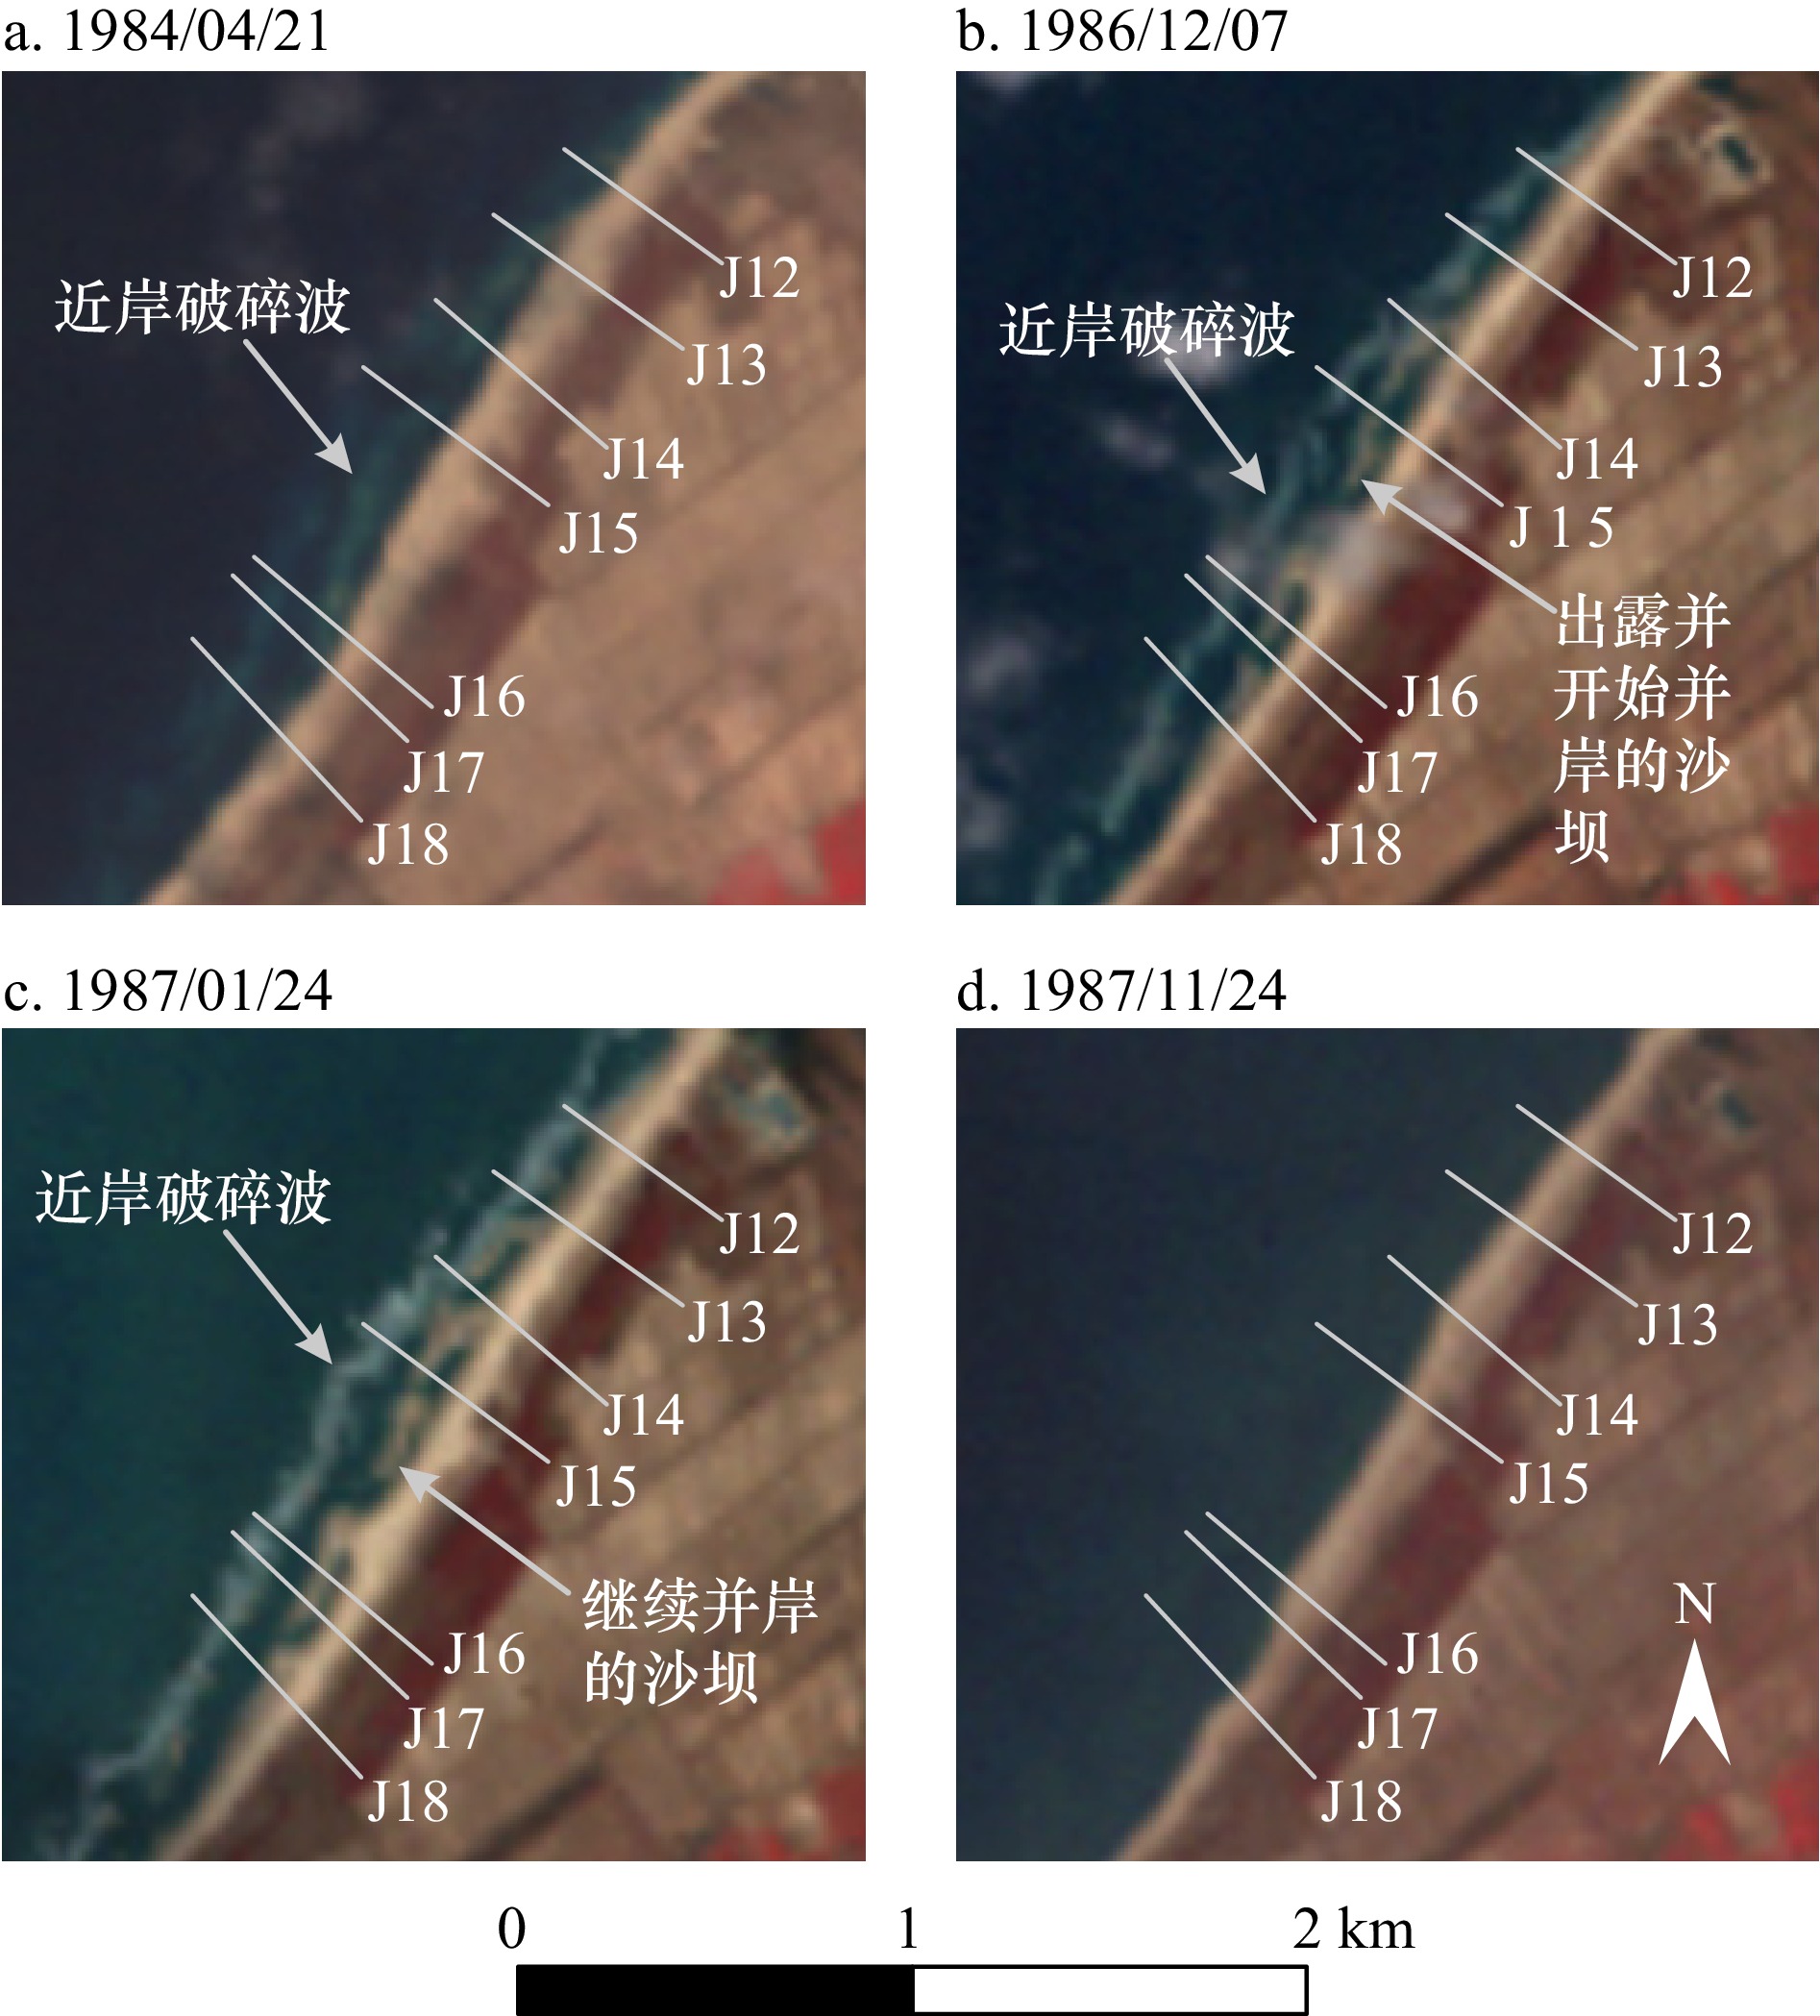
图 7 剖面J12−J18附近沿岸沙坝在1984−1987年的向岸输运和并岸过程
a. 1984/04/21(近岸破碎波指示了两条水下沙坝的位置和形态);b. 1986/12/07(离岸较近的沙坝在潮位较低时出露,局部与海滩连接);c. 1987/01/24(沙坝向岸移动);d. 1987/11/24(沙坝并岸后的海岸线明显向海突出)
Fig. 7 Onshore migration and merging process of the coastal sandbars near transect J12−J18 from 1984 to 1987
a. 1984/04/21 (nearshore breaking waves indicate the location and shape of two underwater sandbars); b. 1986/12/07 (the sandbar near the shore is exposed when the tide level is low, and partially connected to the beach); c. 1987/01/24 (sandbar moving to shore); d. 1987/11/24 (the shoreline after the sandbars merged was obviously protruding to the sea)
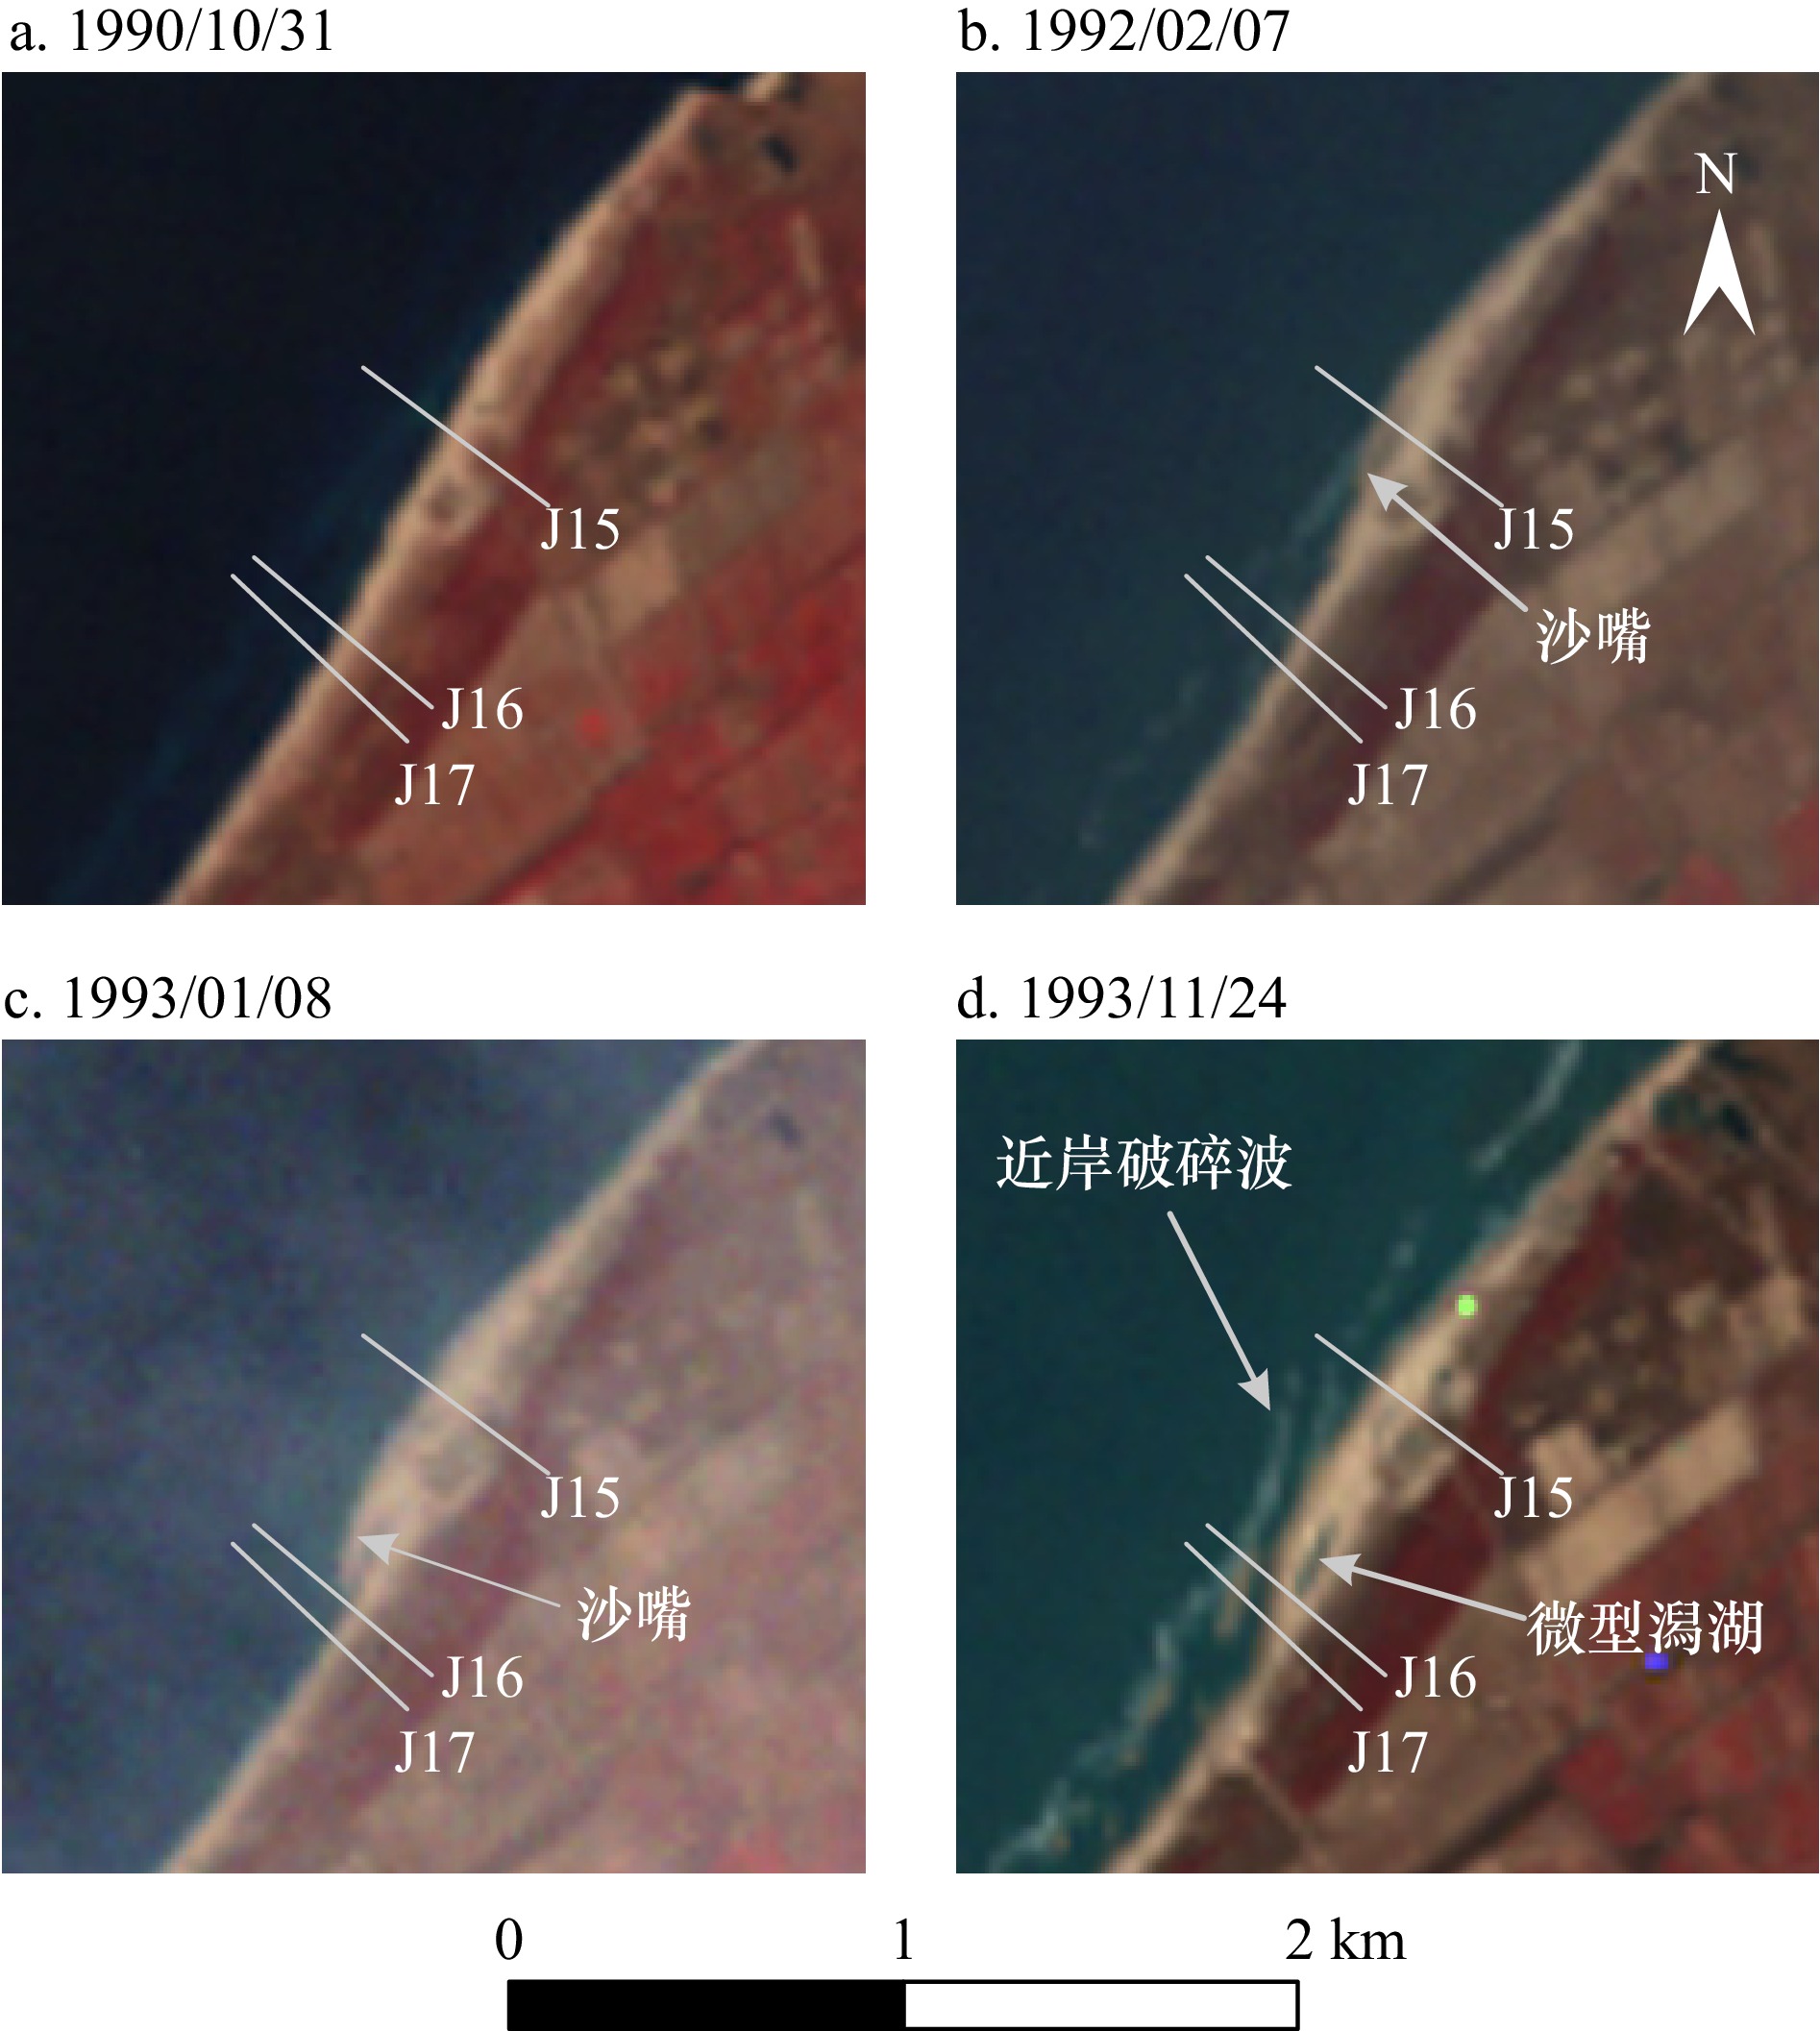
图 8 剖面J15−J17附近的沿岸沙嘴在1990−1993年的形成和并岸过程
a. 1990/10/31(沙嘴未形成);b. 1992/02/07(沙嘴开始形成);c. 1993/01/08(沙嘴向西南方向运移);d. 1993/11/24(沙嘴前锋在J17剖面处并岸,在滩面形成微型潟湖)
Fig. 8 Formation and merging process of the coastal spit near the transect J15−J17 from 1990 to 1993
a. 1990/10/31 (the sand spit not formed); b. 1992/02/07 (the sand spit began to form); c. 1993/01/08 (the sand spit migrated to the southwest); d. 1993/11/24 (the front of sand spit merged at the J17 section and formed a micro-lagoon on the beach)
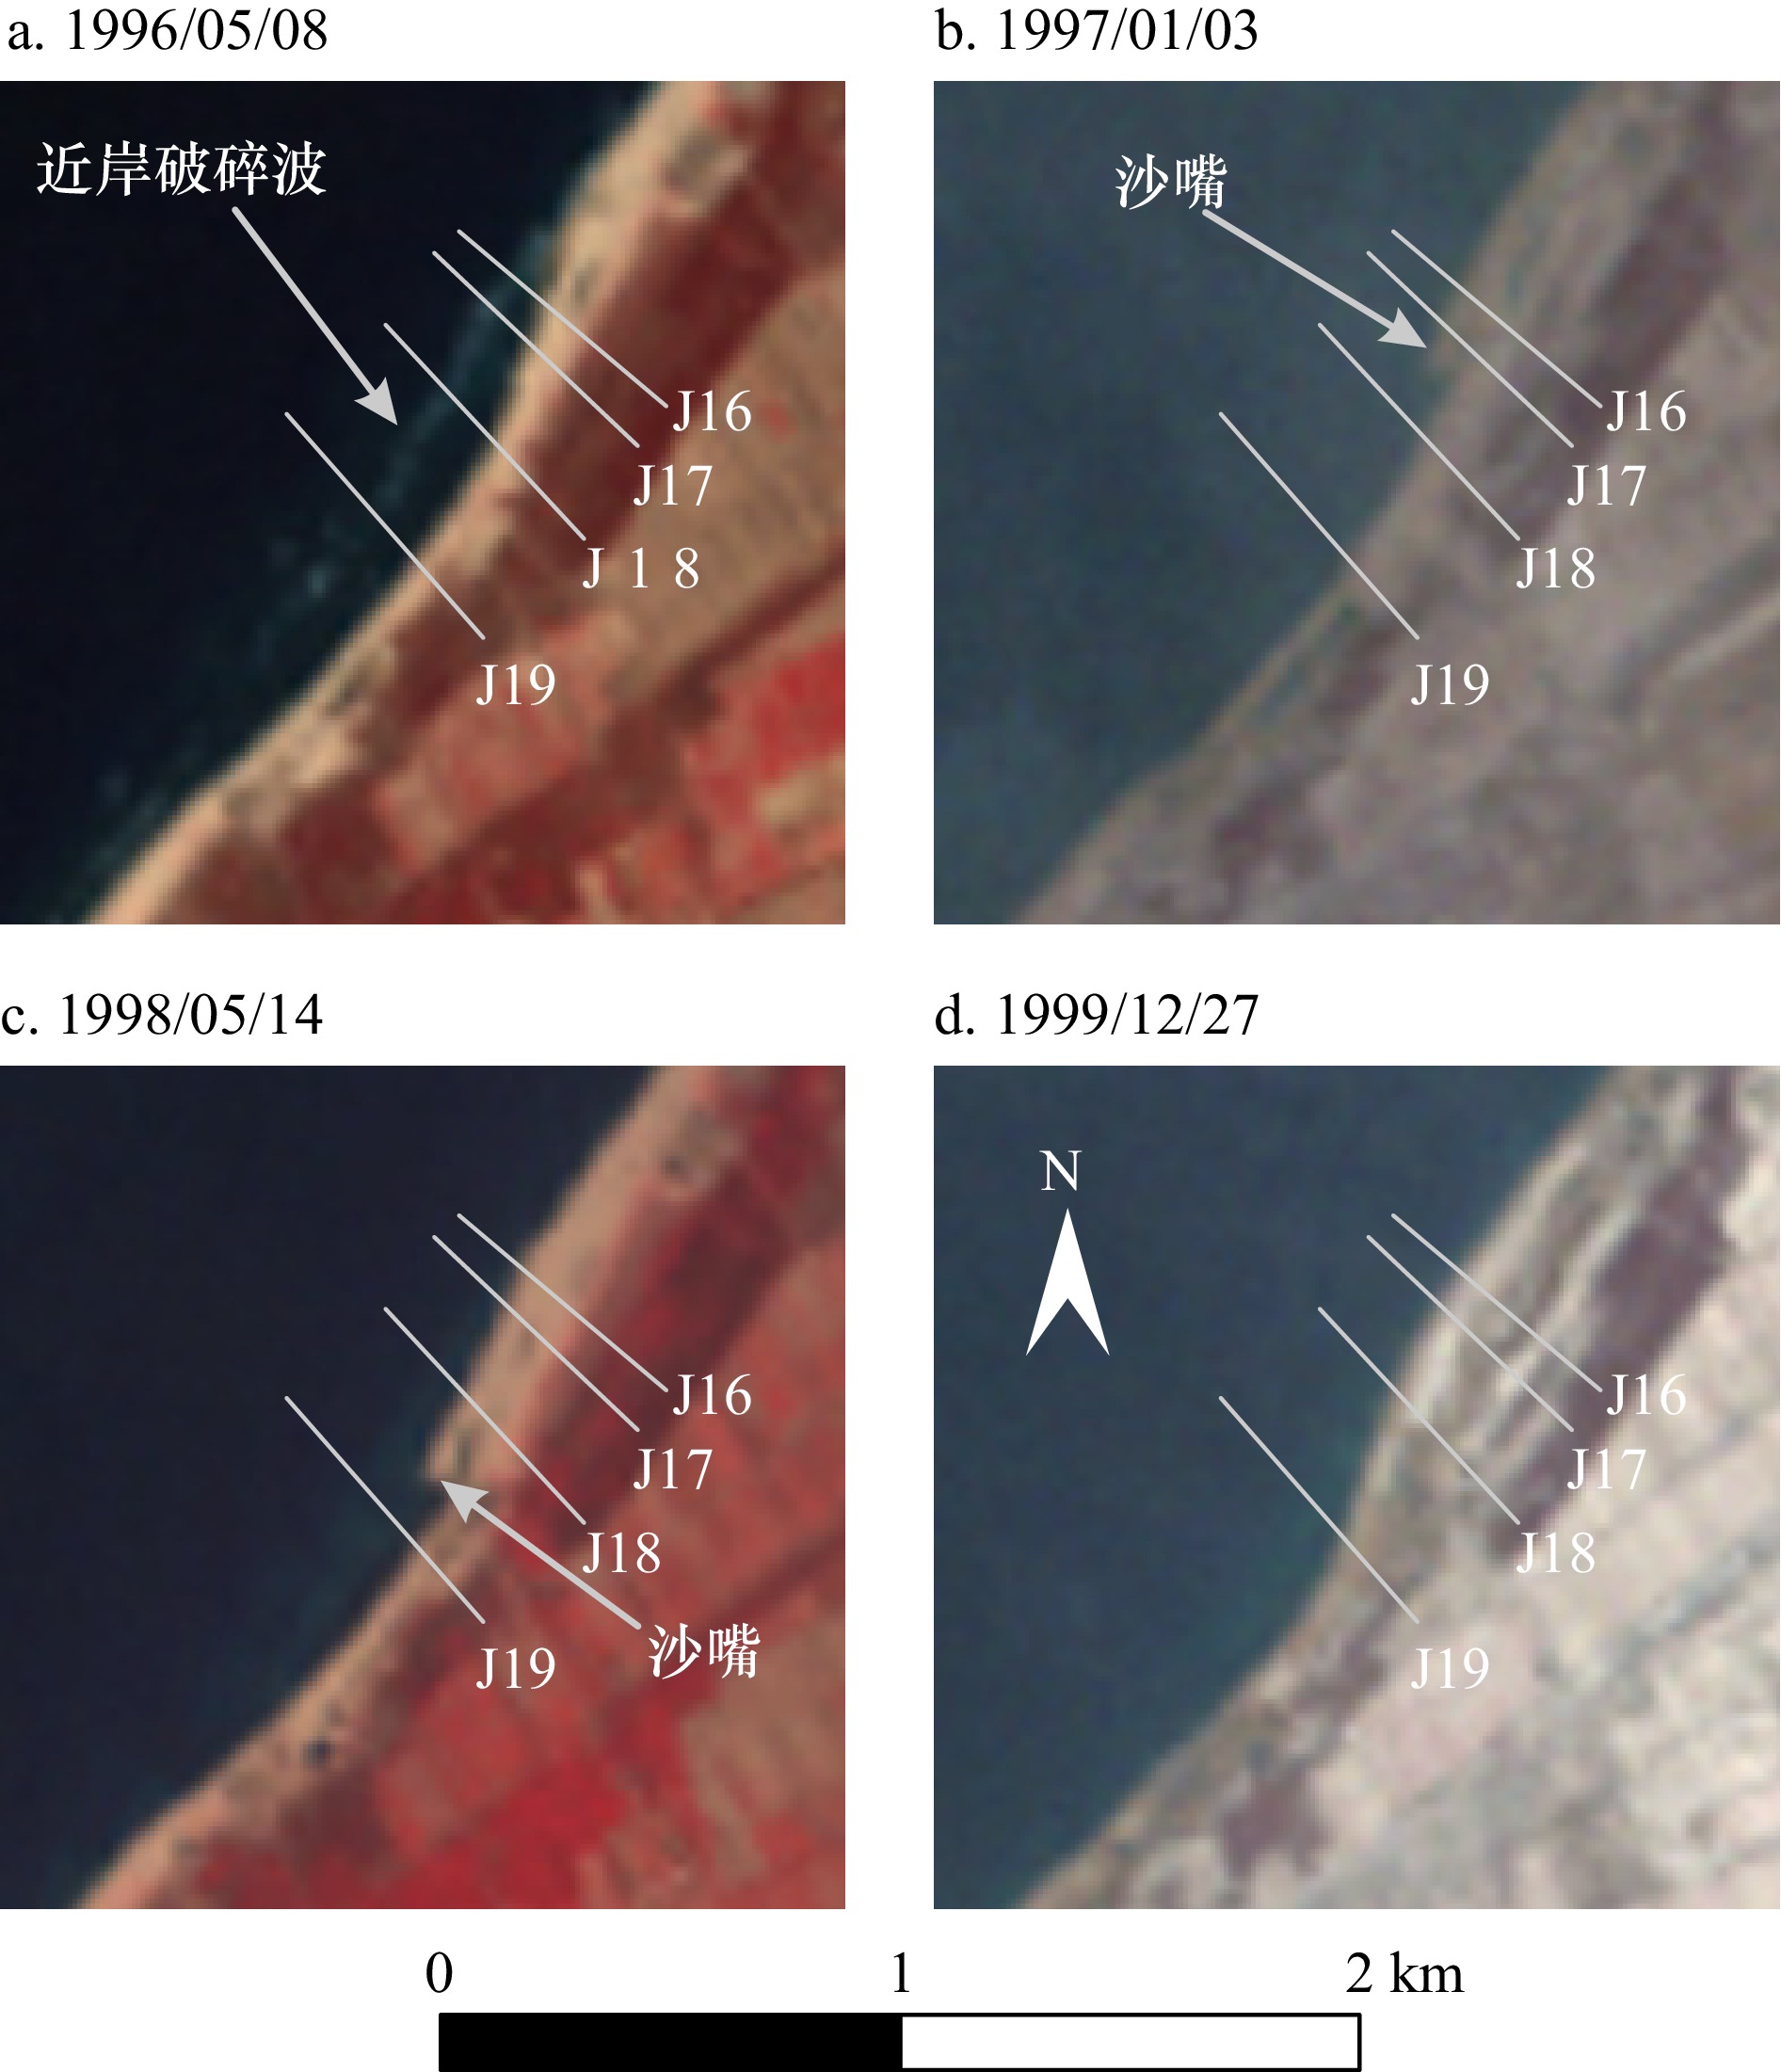
图 9 剖面J16−J19附近的沿岸沙嘴在1996−1999年的形成和并岸过程
a. 1996/05/08(沙嘴未形成);b. 1997/01/03(沙嘴开始形成);c. 1998/05/14(沙嘴向西南方向运移);d. 1999/12/27(沙嘴在J19剖面附近并岸)
Fig. 9 Formation and merging process of the coastal spit near the transect J16−J19 from 1996 to 1999
a. 1996/05/08 (sand spits not formed); b. 1997/01/03 (sand spits began to form); c. 1998/05/14 (sand spits migration to the southwest); d. 1999/12/27 (sand spits merged near the J19 section)
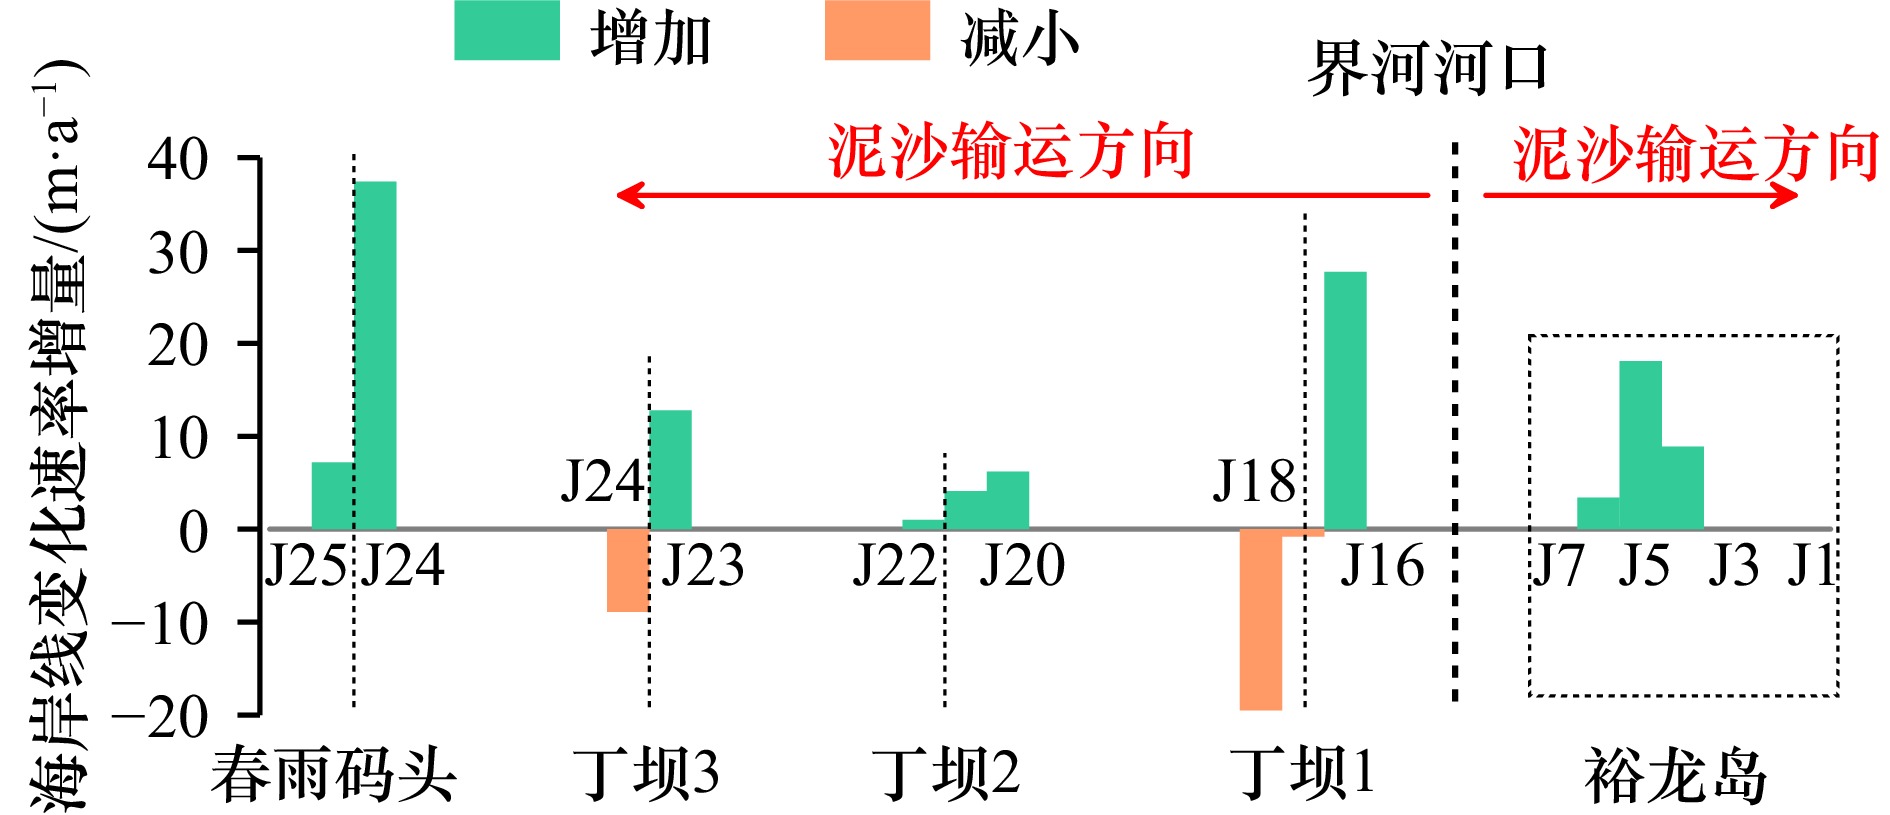
图 10 界河海滩海岸线变化速率在沿海工程建造后的增量
Fig. 10 Increment of the shoreline change rate of Jiehe Beach after the construction of coastal engineering projects

图 11 界河海滩平均潮位线在不同历史时期的移动量
a. 1984−2004年;b. 2004−2024年;c. 1984−2024年
Fig. 11 Cumulative movement of the mean water line of Jiehe Beach in different historical periods
a. 1984−2004; b. 2004−2024; c. 1984−2024
表 1 海岸线位置的随机误差(单位:m)
Tab. 1 Random error of satellite-derived shoreline position (unit: m)
剖面 未校正的海岸线
(水边线)地理校正后
的海岸线地理、潮位校正后的海岸线
(平均潮位线)J1 5.4 5.2 4.8 J2 5.4 5.0 4.7 J3 4.8 4.4 4.2 J4 5.0 4.8 4.5 J5 4.9 4.7 4.6 J6 4.8 4.6 4.4 J7 6.1 5.9 5.6 J8* 9.5 9.3 9.0 J9* 11.9 11.9 11.9 J10 5.7 5.4 5.1 J11 5.4 5.3 4.9 J12 6.3 6.1 5.8 J13 5.3 5.1 4.8 J14 5.2 5.0 4.7 J15 5.8 5.5 5.3 J16 5.4 5.3 5.2 J17 5.9 5.9 5.7 J18 5.3 5.2 5.1 J19 6.1 6.0 5.7 J20 5.9 5.7 5.3 J21 6.1 5.9 5.5 J22 5.8 5.7 5.3 J23 5.4 5.2 4.9 J24 7.0 6.7 6.2 J25 5.5 5.2 5.0 J26 5.0 4.8 4.6 平均 6.0 5.8 5.5 注:* J8和J9剖面的较大位置误差主要是界河河口沙坝剧烈变化所致。  下载: 导出CSV
表 2 沿海工程建设前后邻近海滩的海岸线变化速率
Tab. 2 Shoreline change rates at the adjacent beaches of the coastal projects before and after their construction
剖面 沿海工程 建设时间 建设前海岸线变化速率/(m·a−1) 建设后海岸线变化速率/(m·a−1) 海岸线变化速率增量/(m·a−1) 影响时长/a J4 裕龙岛 2011 −1.0 7.9 8.9 3 J5 裕龙岛 2011 −3.0 15.1 18.1 6 J6 裕龙岛 2011 1.4 4.8 3.4 9 J16 丁坝1 2010 −5.6 22.1 27.7 2 J17 丁坝1 2010 −0.8 −1.6 −0.8 3 J18 丁坝1 2010 0.5 −19.0 −19.5 3 J20 丁坝2 2017 −3.1 3.1 6.2 6 J21 丁坝2 2017 −0.5 3.6 4.1 6 J22 丁坝2 2017 −1.7 −0.7 1.0 6 J23 丁坝3 2006 0.4 13.2 12.8 5 J24 丁坝3 2006 0.2 −8.7 −8.9 5 J24 春雨码头 2011 −8.7 28.7 37.4 4 J25 春雨码头 2011 0.2 7.4 7.2 4
下载: 导出CSV
-
[1] Turner I L, Harley M D, Almar R, et al. Satellite optical imagery in coastal engineering[J]. Coastal Engineering, 2021, 167: 103919. doi: 10.1016/j.coastaleng.2021.103919 [2] Vitousek S, Vos K, Splinter K D, et al. A model integrating satellite-derived shoreline observations for predicting fine-scale shoreline response to waves and sea-level rise across large coastal regions[J]. Journal of Geophysical Research: Earth Surface, 2023, 128(7): e2022JF006936. [3] Zhang Xiaodong, Wu Chuang, Hu Rijun, et al. Can satellite-derived beach images resolve the responses to human activities?[J]. Journal of Geophysical Research: Earth Surface, 2024, 129(2): e2023JF007339. doi: 10.1029/2023JF007339 [4] Luijendijk A, Hagenaars G, Ranasinghe R, et al. The state of the world’s beaches[J]. Scientific Reports, 2018, 8(1): 6641. doi: 10.1038/s41598-018-24630-6 [5] Murray N J, Phinn S R, Dewitt M, et al. The global distribution and trajectory of tidal flats[J]. Nature, 2019, 565(7738): 222−225. [6] Vousdoukas M I, Ranasinghe R, Mentaschi L, et al. Sandy coastlines under threat of erosion[J]. Nature Climate Change, 2020, 10(3): 260−263. doi: 10.1038/s41558-020-0697-0 [7] Cai Feng, Cao Chao, Qi Hongshuai, et al. Rapid migration of China’s mainland coastal erosion vulnerability due to anthropogenic changes[J]. Journal of Environmental Management, 2022, 319: 115632. doi: 10.1016/j.jenvman.2022.115632 [8] Moussaid J, Fora A A, Zourarah B, et al. Using automatic computation to analyze the rate of shoreline change on the Kenitra coast, Morocco[J]. Ocean Engineering, 2015, 102: 71−77. doi: 10.1016/j.oceaneng.2015.04.044 [9] Valderrama-Landeros L, Flores-De-Santiago F. Assessing coastal erosion and accretion trends along two contrasting subtropical rivers based on remote sensing data[J]. Ocean & Coastal Management, 2019, 169: 58−67. [10] Zhang Xiaodong, Tan Xiawei, Hu Rijun, et al. Using a transect-focused approach to interpret satellite images and analyze shoreline evolution in Haiyang Beach, China[J]. Marine Geology, 2021, 438: 106526. doi: 10.1016/j.margeo.2021.106526 [11] Zhang Xiaodong, Wu Chuang, Zhang Yongchang, et al. Using free satellite imagery to study the long-term evolution of intertidal bar systems[J]. Coastal Engineering, 2022, 174: 104123. doi: 10.1016/j.coastaleng.2022.104123 [12] Cai Feng, Su Xianze, Liu Jianhui, et al. Coastal erosion in China under the condition of global climate change and measures for its prevention[J]. Progress in Natural Science, 2009, 19(4): 415−426. [13] Rangel-Buitrago N, Williams A T, Anfuso G. Hard protection structures as a principal coastal erosion management strategy along the Caribbean coast of Colombia. A chronicle of pitfalls[J]. Ocean & Coastal Management, 2018, 156: 58−75. [14] Tak W J, Jun K W, Kim S D, et al. Using drone and LiDAR to assess coastal erosion and shoreline change due to the construction of coastal structures[J]. Journal of Coastal Research, 2020, 95(sp1): 674−678. doi: 10.2112/SI95-131.1 [15] Sujivakand J, Samarasekara R S M, Siriwardana H P A M, et al. Unmanned aerial vehicles (UAVs) for coastal protection assessment: a study of detached breakwater and groins at Marawila Beach, Sri Lanka[J]. Regional Studies in Marine Science, 2024, 69: 103282. [16] 黎奕宏. 我国三类典型海岸工程对相邻海滩的影响研究[D]. 厦门: 国家海洋局第三海洋研究所, 2018.Li Yihong. Study on the influence of three types of typical coastal structures to the adjacent beach in China[D]. Xiamen: Third Institute of Oceanography, State Oceanic Administration, 2018. [17] 何岩雨, 朱君, 戚洪帅, 等. 人工岛影响下的海滩修复对策研究——以海口西海岸为例[J]. 应用海洋学学报, 2021, 40(1): 2−11.He Yanyu, Zhu Jun, Qi Hongshuai, et al. Beach restoration strategy influenced by artificial island: a case study on the west coast of Haikou[J]. Journal of Applied Oceanography, 2021, 40(1): 2−11. [18] 张达恒, 时连强, 龚照辉, 等. 冬季波浪与人工岛联合作用下日月湾海滩冲淤演变特征[J]. 热带海洋学报, 2022, 41(4): 71−81. doi: 10.11978/2021150Zhang Daheng, Shi Lianqiang, Gong Zhaohui, et al. Evolution characteristics of beach erosion and accretion at the Riyue Bay under the combined impacts of winter waves and artificial island[J]. Journal of Tropical Oceanography, 2022, 41(4): 71−81. doi: 10.11978/2021150 [19] 戚洪帅, 冯威, 刘根, 等. 人工岛影响下养护海滩演变特征研究——以海口湾为例[J]. 海洋学报, 2024, 46(2): 79−92.Qi Hongshuai, Feng Wei, Liu Gen, et al. Study on the evolution of nourished beaches under the influence of artificial islands: taking Haikou Bay as an example[J]. Haiyang Xuebao, 2024, 46(2): 79−92. [20] Liu Gen, Qi Hongshuai, Cai Feng, et al. Initial morphological responses of coastal beaches to a mega offshore artificial island[J]. Earth Surface Processes and Landforms, 2022, 47(6): 1355−1370. doi: 10.1002/esp.5320 [21] Hu Rijun, Fan Yingjie, Zhang Xiaodong. Satellite-derived shoreline changes of an urban beach and their relationship to coastal engineering[J]. Remote Sensing, 2024, 16(13): 2469. doi: 10.3390/rs16132469 [22] Li Songzhe, Lv Biao, Yang Yunping, et al. Effects of offshore artificial islands on beach stability of sandy shores: case study of Hongtang Bay, Hainan Province[J]. Frontiers of Earth Science, 2022, 16(4): 876−889. [23] Qu Kaicheng, Chen Kefeng, Wang Nairui, et al. Geomorphological processes following the construction of an offshore artificial island in the radial sand ridges of the South Yellow Sea[J]. Coastal Engineering, 2024, 192: 104545. doi: 10.1016/j.coastaleng.2024.104545 [24] Pradeep J, Shaji E, Chandran C S S, et al. Assessment of coastal variations due to climate change using remote sensing and machine learning techniques: a case study from west coast of India[J]. Estuarine, Coastal and Shelf Science, 2022, 275: 107968. doi: 10.1016/j.ecss.2022.107968 [25] Fogarin S, Zanetti M, Dal Barco M K, et al. Combining remote sensing analysis with machine learning to evaluate short-term coastal evolution trend in the shoreline of Venice[J]. Science of the Total Environment, 2023, 859: 160293. doi: 10.1016/j.scitotenv.2022.160293 [26] Mbezi J, Mango J, Lubida A, et al. Exploring shoreline changes and their implications in coastal communities using GIS and remote sensing techniques: the case of eastern beaches of Unguja island, Tanzania[J]. Regional Studies in Marine Science, 2024, 75: 103566. doi: 10.1016/j.rsma.2024.103566 [27] Palanisamy P, Sivakumar V, Velusamy P, et al. Spatio-temporal analysis of shoreline changes and future forecast using remote sensing, GIS and kalman filter model: a case study of Rio de Janeiro, Brazil[J]. Journal of South American Earth Sciences, 2024, 133: 104701. doi: 10.1016/j.jsames.2023.104701 [28] Hagenaars G, De Vries S, Luijendijk A P, et al. On the accuracy of automated shoreline detection derived from satellite imagery: a case study of the sand motor mega-scale nourishment[J]. Coastal Engineering, 2018, 133: 113−125. doi: 10.1016/j.coastaleng.2017.12.011 [29] Pardo-Pascual J E, Almonacid-Caballer J, Ruiz L A, et al. Automatic extraction of shorelines from Landsat TM and ETM+ multi-temporal images with subpixel precision[J]. Remote Sensing of Environment, 2012, 123: 1−11. doi: 10.1016/j.rse.2012.02.024 [30] Pardo-Pascual J E, Sánchez-García E, Almonacid-Caballer J, et al. Assessing the accuracy of automatically extracted shorelines on microtidal beaches from Landsat 7, Landsat 8 and Sentinel-2 imagery[J]. Remote Sensing, 2018, 10(2): 326. [31] Vos K, Harley M D, Splinter K D, et al. Sub-annual to multi-decadal shoreline variability from publicly available satellite imagery[J]. Coastal Engineering, 2019, 150: 160−174. doi: 10.1016/j.coastaleng.2019.04.004 [32] Zhang Xiaodong. Computer-aided shoreline position recognition software[EB/OL]. (2023-11-26) [2024-05-01]. https://doi.org/10.6084/m9.figshare.23731110. [33] 吴闯, 张晓东, 许淑梅, 等. 山东青岛灵山湾南部海滩的时空演变及其影响因素[J]. 古地理学报, 2022, 24(1): 152−163. doi: 10.7605/gdlxb.2022.01.012Wu Chuang, Zhang Xiaodong, Xu Shumei, et al. Spatial and temporal evolution of Lingnan Beach in Qingdao of Shandong Province and its influencing factors[J]. Journal of Palaeogeography, 2022, 24(1): 152−163. doi: 10.7605/gdlxb.2022.01.012 [34] 张晓东, 姚雨涵, 朱龙海, 等. 基于大量卫星图像研究青岛汇泉湾海滩近40年的地形地貌演变[J]. 海洋与湖沼, 2022, 53(3): 578−589. doi: 10.11693/hyhz20211100286Zhang Xiaodong, Yao Yuhan, Zhu Longhai, et al. Topographic and geomorphological evolution of Huiquan Beach of Qingdao in past 40 years using massive satellite images[J]. Oceanologia et Limnologia Sinica, 2022, 53(3): 578−589. doi: 10.11693/hyhz20211100286 [35] 董卫卫. 莱州湾东岸冲淤演变分析与防护[D]. 青岛: 中国海洋大学, 2008.Dong Weiwei. The erosion and deposition evolution development and the protection in the east coast of Laizhou[D]. Qingdao: Ocean University of China, 2008. [36] 周广镇. 莱州湾东岸近岸海域规划用海实施后冲淤演变预测[D]. 青岛: 中国海洋大学, 2012.Zhou Guangzhen. Evolution prediction of erosion and deposition in the east coast of Laizhou Bay after the implementation of the coastal planning[D]. Qingdao: Ocean University of China, 2012. [37] 伊善堂, 尹东晓, 朱龙海, 等. 招远砂质海岸岸滩演化特征[J]. 海洋地质前沿, 2017, 33(9): 47−52.Yi Shantang, Yin Dongxiao, Zhu Longhai, et al. Evolutionary features of the Zhaoyuan sandy beach[J]. Marine Geology Frontiers, 2017, 33(9): 47−52. [38] 庄振业, 陈卫民, 许卫东, 等. 山东半岛若干平直砂岸近期强烈蚀退及其后果[J]. 青岛海洋大学学报, 1989, 19(1): 90−98.Zhuang Zhenye, Chen Weimin, Xu Weidong, et al. Retrogression of straight sandy beaches in the Shandong peninsula and its results[J]. Journal of Ocean University of Qingdao, 1989, 19(1): 90−98. [39] 王庆, 杨华, 仲少云, 等. 山东莱州浅滩的沉积动态与地貌演变[J]. 地理学报, 2003, 58(5): 749−756. doi: 10.3321/j.issn:0375-5444.2003.05.014Wang Qing, Yang Hua, Zhong Shaoyun, et al. Sedimentary dynamics and geomorphic evolution of the Laizhou shoal[J]. Acta Geographica Sinica, 2003, 58(5): 749−756. doi: 10.3321/j.issn:0375-5444.2003.05.014 [40] 常瑞芳, 庄振业, 吴建政. 山东半岛西北海岸的蚀退与防护[J]. 青岛海洋大学学报, 1993, 23(3): 60−68.Chang Ruifang, Zhuang Zhenye, Wu Jianzheng. Retrogression and protection of the north-west coast of the Shandong peninsula[J]. Journal of Ocean University of Qingdao, 1993, 23(3): 60−68. [41] 中国海湾志编纂委员会. 中国海湾志(第三分册): 山东半岛北部和东部海湾[M]. 北京: 海洋出版社, 1991.Editorial Board of China Bay Survey. Survey of China Bays (Vol. 3): Northern and Eastern Gulf of Shandong Peninsula[M]. Beijing: China Ocean Press, 1991. [42] 安永宁, 吴建政, 朱龙海, 等. 龙口湾冲淤特性对人工岛群建设的响应[J]. 海洋地质动态, 2010, 26(10): 24−30.An Yongning, Wu Jianzheng, Zhu Longhai, et al. Response of erosion-deposition pattern to artificial islands construction in Longkou Bay[J]. Marine Geology Letters, 2010, 26(10): 24−30. [43] 任鹏, 孙志高, 王传远, 等. 人工岛建设对龙口湾表层沉积物粒度及黏土矿物组成特征的影响[J]. 海洋科学进展, 2016, 34(4): 578−587. doi: 10.3969/j.issn.1671-6647.2016.04.014Ren Peng, Sun Zhigao, Wang Chuanyuan, et al. Impacts of construction of artificial islands on the flow-sediment regulation scheme on grain and clay compositions in the Longkou Bay[J]. Advances in Marine Science, 2016, 34(4): 578−587. doi: 10.3969/j.issn.1671-6647.2016.04.014 [44] 刘波, 胡日军, 李毅, 等. 夏季潮流作用下龙口湾海域悬浮泥沙时空变化特征及其输运机制[J]. 海洋地质前沿, 2020, 36(3): 20−30.Liu Bo, Hu Rijun, Li Yi, et al. Spatio-temporal variation characteristics and transport mechanism of suspended sediments in Longkou Bay under the influence of summer tidal current[J]. Marine Geology Frontiers, 2020, 36(3): 20−30. [45] 费成鹏, 胡日军, 雒敏义, 等. 龙口湾水动力特征及其对人工岛群建设的响应[J]. 海洋地质与第四纪地质, 2022, 42(1): 81−95.Fei Chengpeng, Hu Rijun, Luo Minyi, et al. Hydrodynamic characteristics of Longkou Bay and its response to artificial island groups[J]. Marine Geology & Quaternary Geology, 2022, 42(1): 81−95. [46] 王超, 姜胜辉, 王世臣, 等. 山东裕龙岛跨河道工程对沉积动力环境影响研究[J]. 海洋地质与第四纪地质, 2024, 44(1): 191−202.Wang Chao, Jiang Shenghui, Wang Shichen, et al. Study on the impact of cross-river engineering on sedimentary dynamic environment in Yulong Island, Shandong[J]. Marine Geology & Quaternary Geology, 2024, 44(1): 191−202. [47] Boak E H, Turner I L. Shoreline definition and detection: a review[J]. Journal of Coastal Research, 2005, 21(4): 688−703. [48] Matsumoto K, Takanezawa T, Ooe M. Ocean tide models developed by assimilating TOPEX/POSEIDON altimeter data into hydrodynamical model: a global model and a regional model around Japan[J]. Journal of oceanography, 2000, 56(5): 567−581. -

计量
- 文章访问数: 684
- HTML全文浏览量: 264
- PDF下载量: 96
- 被引次数: 0
