

Assessment of 210Po, 210Bi and 210Pb in aerosols and their deposition fluxes in the nearshore region of the East China Sea
-
摘要: 大气210Po、210Bi和210Pb的沉降通量是海洋中核素示踪颗粒物动力学过程(颗粒有机碳输出、颗粒物输运)的基础参数,为揭示我国近海地区210Po、210Bi和210Pb活度浓度的时空变化规律并估算其沉降入海通量,本文于2016年9月至翌年2月和2021年9−11月分别对上海及厦门地区近地表大气气溶胶中210Po、210Pb和210Bi的活度浓度进行了连续观测;基于210Po-210Pb活度比(210Po/210Pb)和210Bi-210Pb活度比(210Bi/210Pb)两种示踪法计算了气溶胶颗粒物的滞留时间,并利用一维简单气溶胶沉降速率模型估算了3种核素以大气沉降方式输入东海的通量。结果显示,2016年上海秋、冬两季210Po、210Bi、210Pb 3种核素活度浓度的变化范围分别为0.11~1.27 mBq/m3、0.45~1.83 mBq/m3和1.12~6.10 mBq/m3;2021年秋季厦门210Po、210Bi、210Pb 3种核素活度浓度的变化范围分别为0.05~0.85 mBq/m3、0.83~2.52 mBq/m3和0.17~1.32 mBq/m3,上海近地表气溶胶中3种核素的活度浓度秋季平均值比厦门地区高。利用210Po/210Pb和210Bi/210Pb计算得到上海和厦门近地面大气的气溶胶滞留时间存在显著差异,基于210Po/210Pb计算上海气溶胶滞留时间均值为(94 ± 54)d,基于210Bi/210Pb计算上海气溶胶滞留时间均值为(6.4 ± 4.8)d,造成这种差异的原因很可能是两种示踪法本身具有的系统性差异。本文基于一维简易气溶胶沉降速率模型估算了上海地区的210Pb、210Bi和210Po的大气沉降入东海的通量,其在秋季期间的变化范围分别为0.1~26.35 Bq/(m2·d)、0.04~7.91 Bq/(m2·d)和0.01~5.49 Bq/(m2·d)。基于模型估算的210Po、210Bi和210Pb沉降通量与研究区域的实际观测值接近一致,表明利用一维简易气溶胶沉降速率模型间接估算法在替代观测站直测核素的沉降入海通量方面具有一定可行性。Abstract: The deposition fluxes of 210Po, 210Bi and 210Pb in atmosphere are the basis for the application of radionuclide tracing in the ocean. In order to reveal the spatio-temporal variation of the activity of 210Po, 210Bi and 210Pb in nearshore areas and estimate their deposition fluxes into the sea, in this paper, sampling observation and analysis of two typical areas near the East China Sea in Shanghai and Xiamen in different periods are carried out. A time series study was conducted on the the aerosol activities of 210Po, 210Pb and 210Bi in Shanghai and Xiamen from September 2016 to February 2017 and from September to November 2021, respectively. The residence time of aerosol particle was calculated based on 210Po/210Pb and 210Bi/210Pb. Deposition fluxes of three nuclides were also estimated. This paper reported the activity of 210Po, 210Bi and 210Pb in Shanghai in autumn and winter of 2016. The activity ranges of 210Po, 210Pb and 210Bi were 0.11−1.27 mBq/m3, 0.45−1.83 mBq/m3 and 1.12−6.10 mBq/m3, respectively. In the fall of 2021, the activity ranges of 210Po, 210Bi and 210Pb in Xiamen were 0.05−0.85 mBq/m3, 0.83−2.52 mBq/m3 and 0.17−1.32 mBq/m3, respectively. The aerosol activity of each nuclide in Shanghai was higher than that in Xiamen. The estimated residence time based on 210Po-210Pb and 210Bi-210Pb methods are significantly different, for example, in Shanghai area, the averaged aerosol residence time based on 210Po-210Pb method was calculated to be (94 ± 54) d, which is much higher than the result from 210Bi-210Pb method. The main reason for this difference is most likely due to the difference in the properties of the tracing isotopes we used. In this paper, based on a one-dimensional simple aerosol deposition rate model, the atmospheric deposition fluxes of 210Pb, 210Bi and 210Po over Shanghai area into the East China Sea are estimated, and their variation ranges are 0.1−26.35 Bq/(m2·d), 0.04−7.91 Bq/(m2·d) and 0.01−5.49 Bq/(m2·d), respectively. The deposition fluxes of 210Po, 210Bi and 210Pb estimated based on the model are close to the actual observed values in the study area during the same period in winter within a certain range. The feasibility of estimating the deposition flux of nuclide into the sea with a simple one dimensional aerosol deposition rate model is verified.
-
Key words:
- nearshore region of the East China Sea /
- 210Po /
- 210Bi /
- 210Pb /
- residence time /
- deposition flux
-
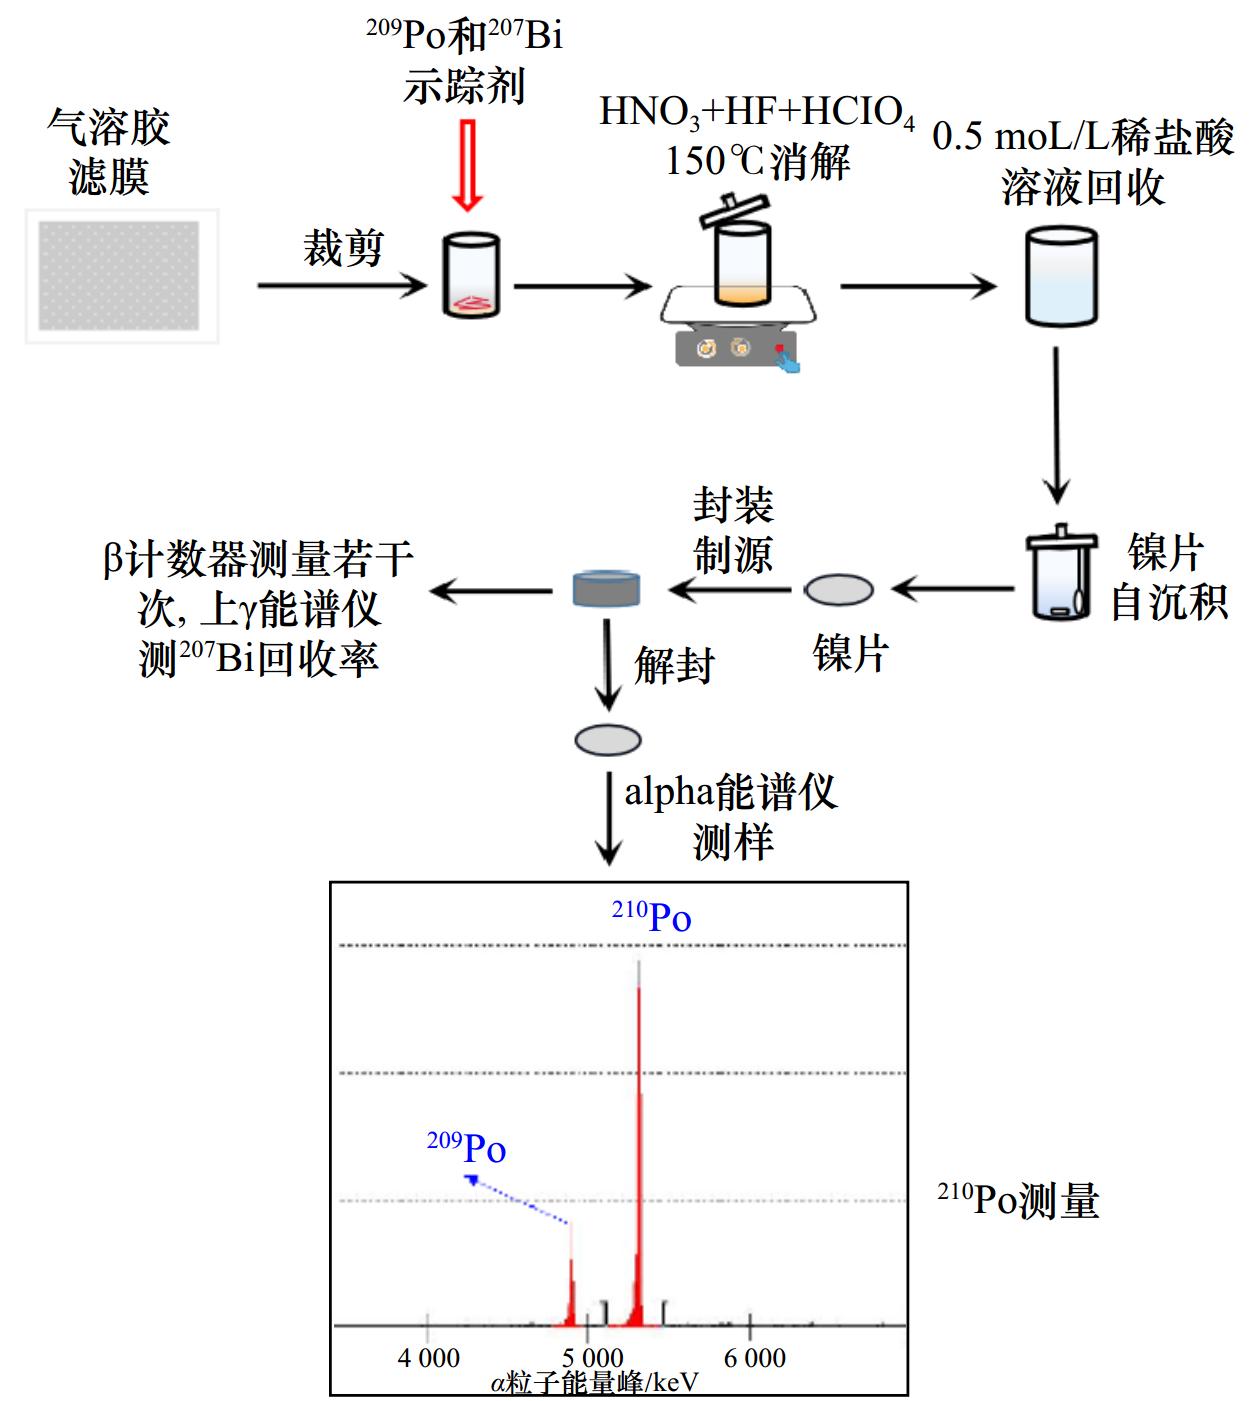
图 1 气溶胶中210Po和210Bi活度的联合分析
Fig. 1 Joint analysis of 210Po and 210Bi activity in aerosols
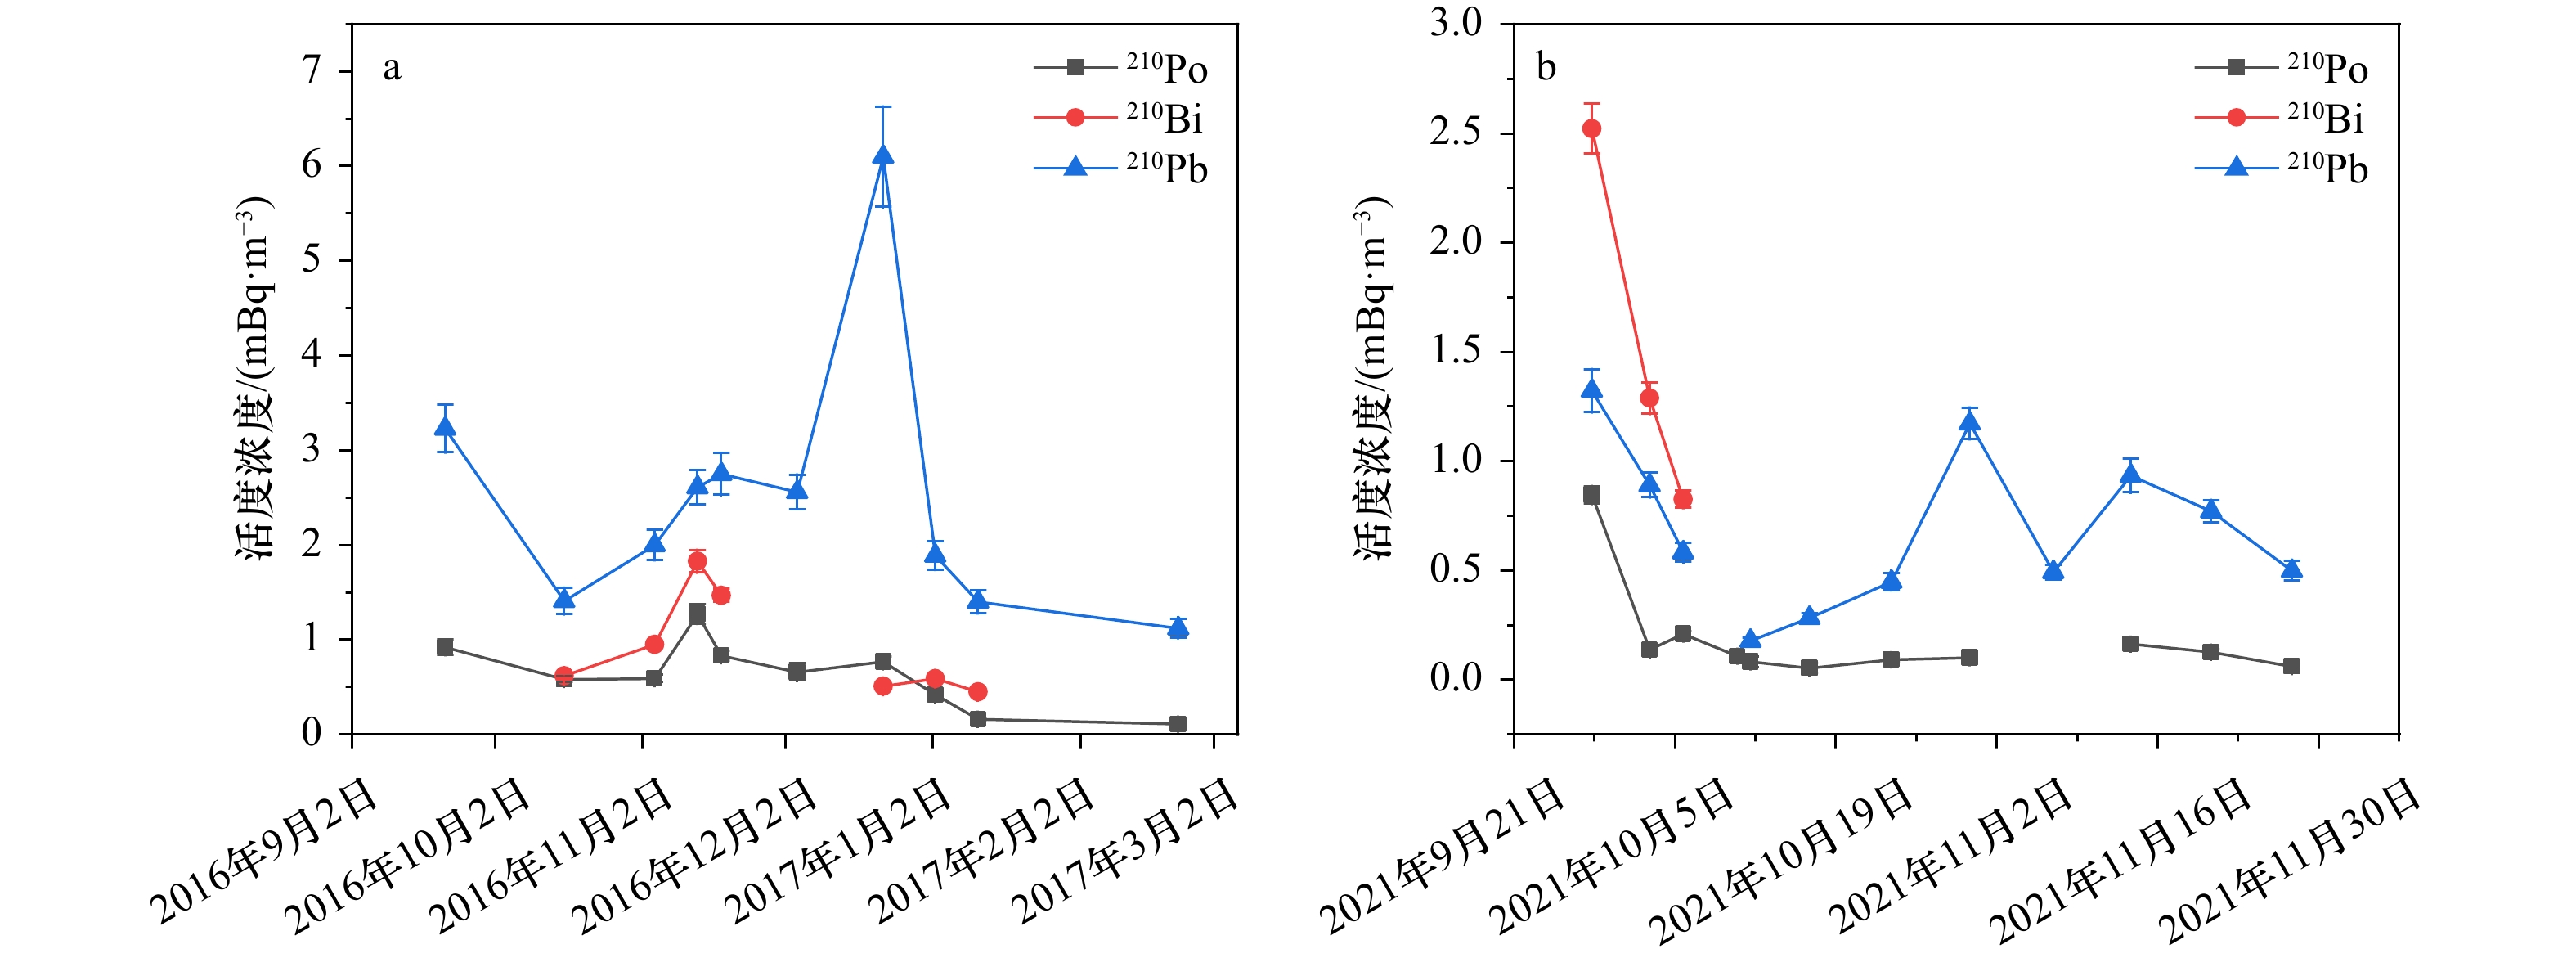
图 2 东海近岸上海(a)和厦门(b)地区气溶胶中210Po、210Bi和210Pb活度浓度随时间的变化关系
Fig. 2 Temporal variation of 210Po, 210Bi and 210Pb activity concentrations in aerosols of Shanghai region (a) and Xiamen region (b) close to the East China Sea
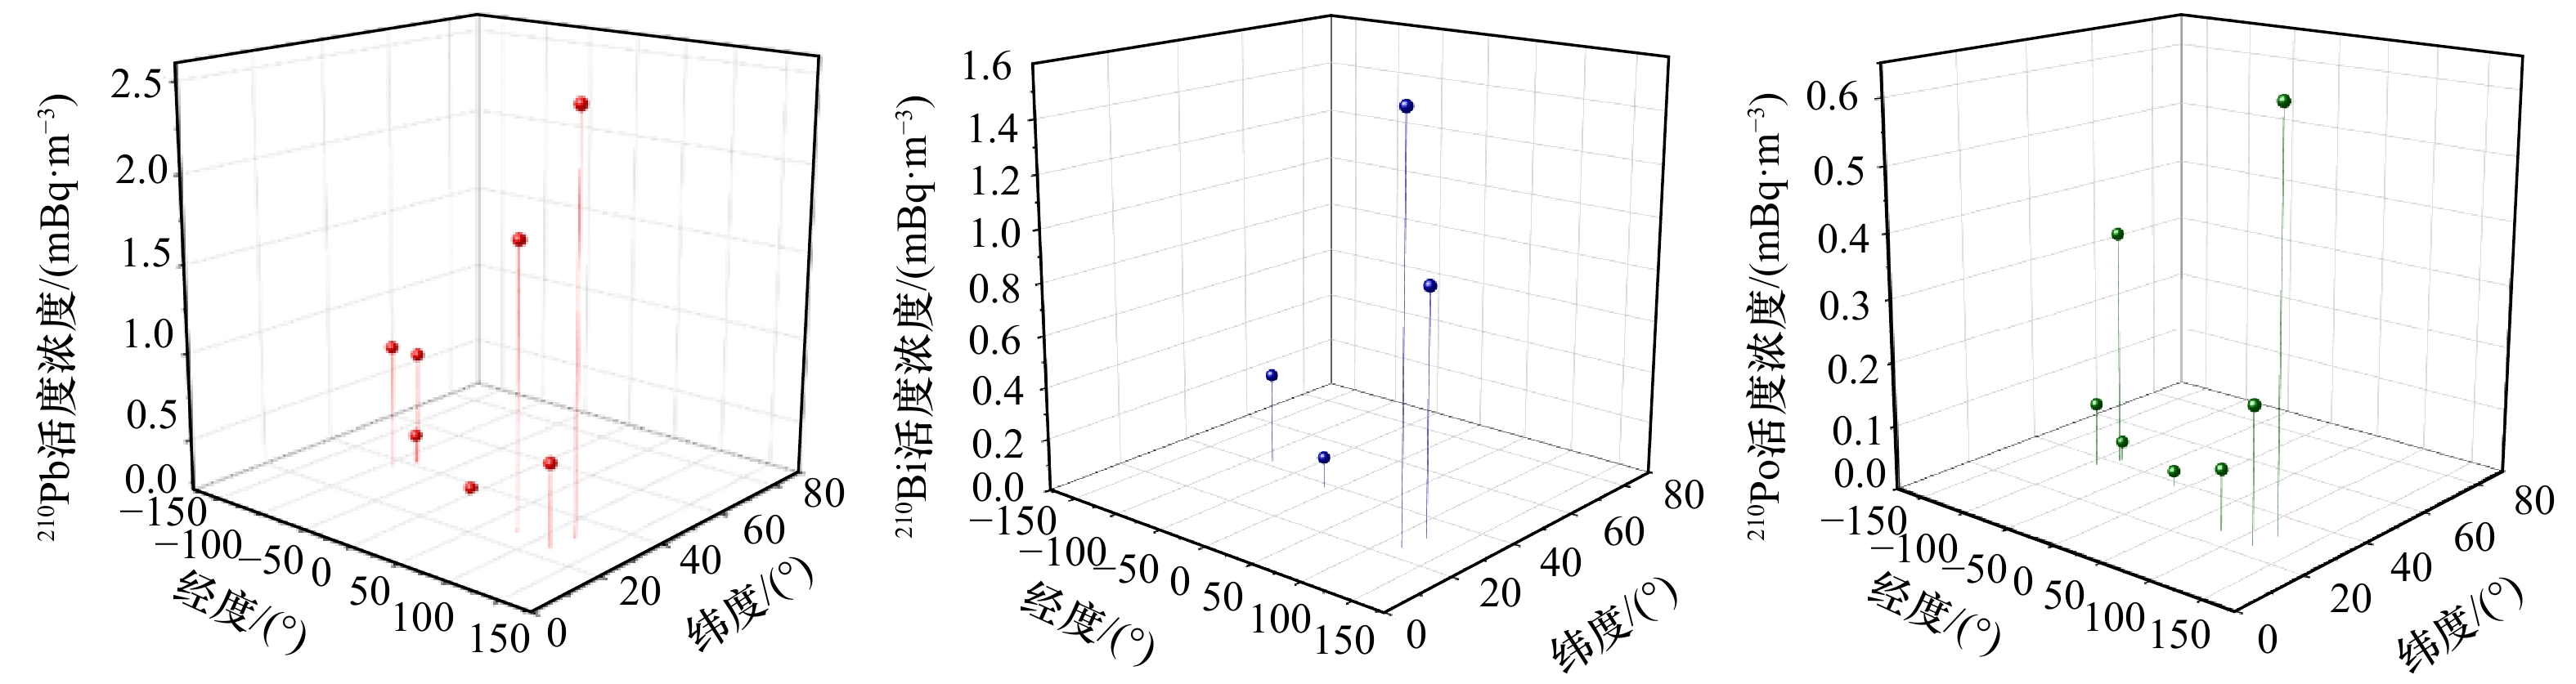
图 3 全球各采样站位秋冬季近地面气溶胶中210Pb、210Bi和210Po活度浓度分布
经度以东为正,以西为负
Fig. 3 Distribution of 210Pb, 210Bi, 210Po activity concentrations in near ground aerosols of global observation station during autumn and winter
Longitude is positive to the east and negative to the west
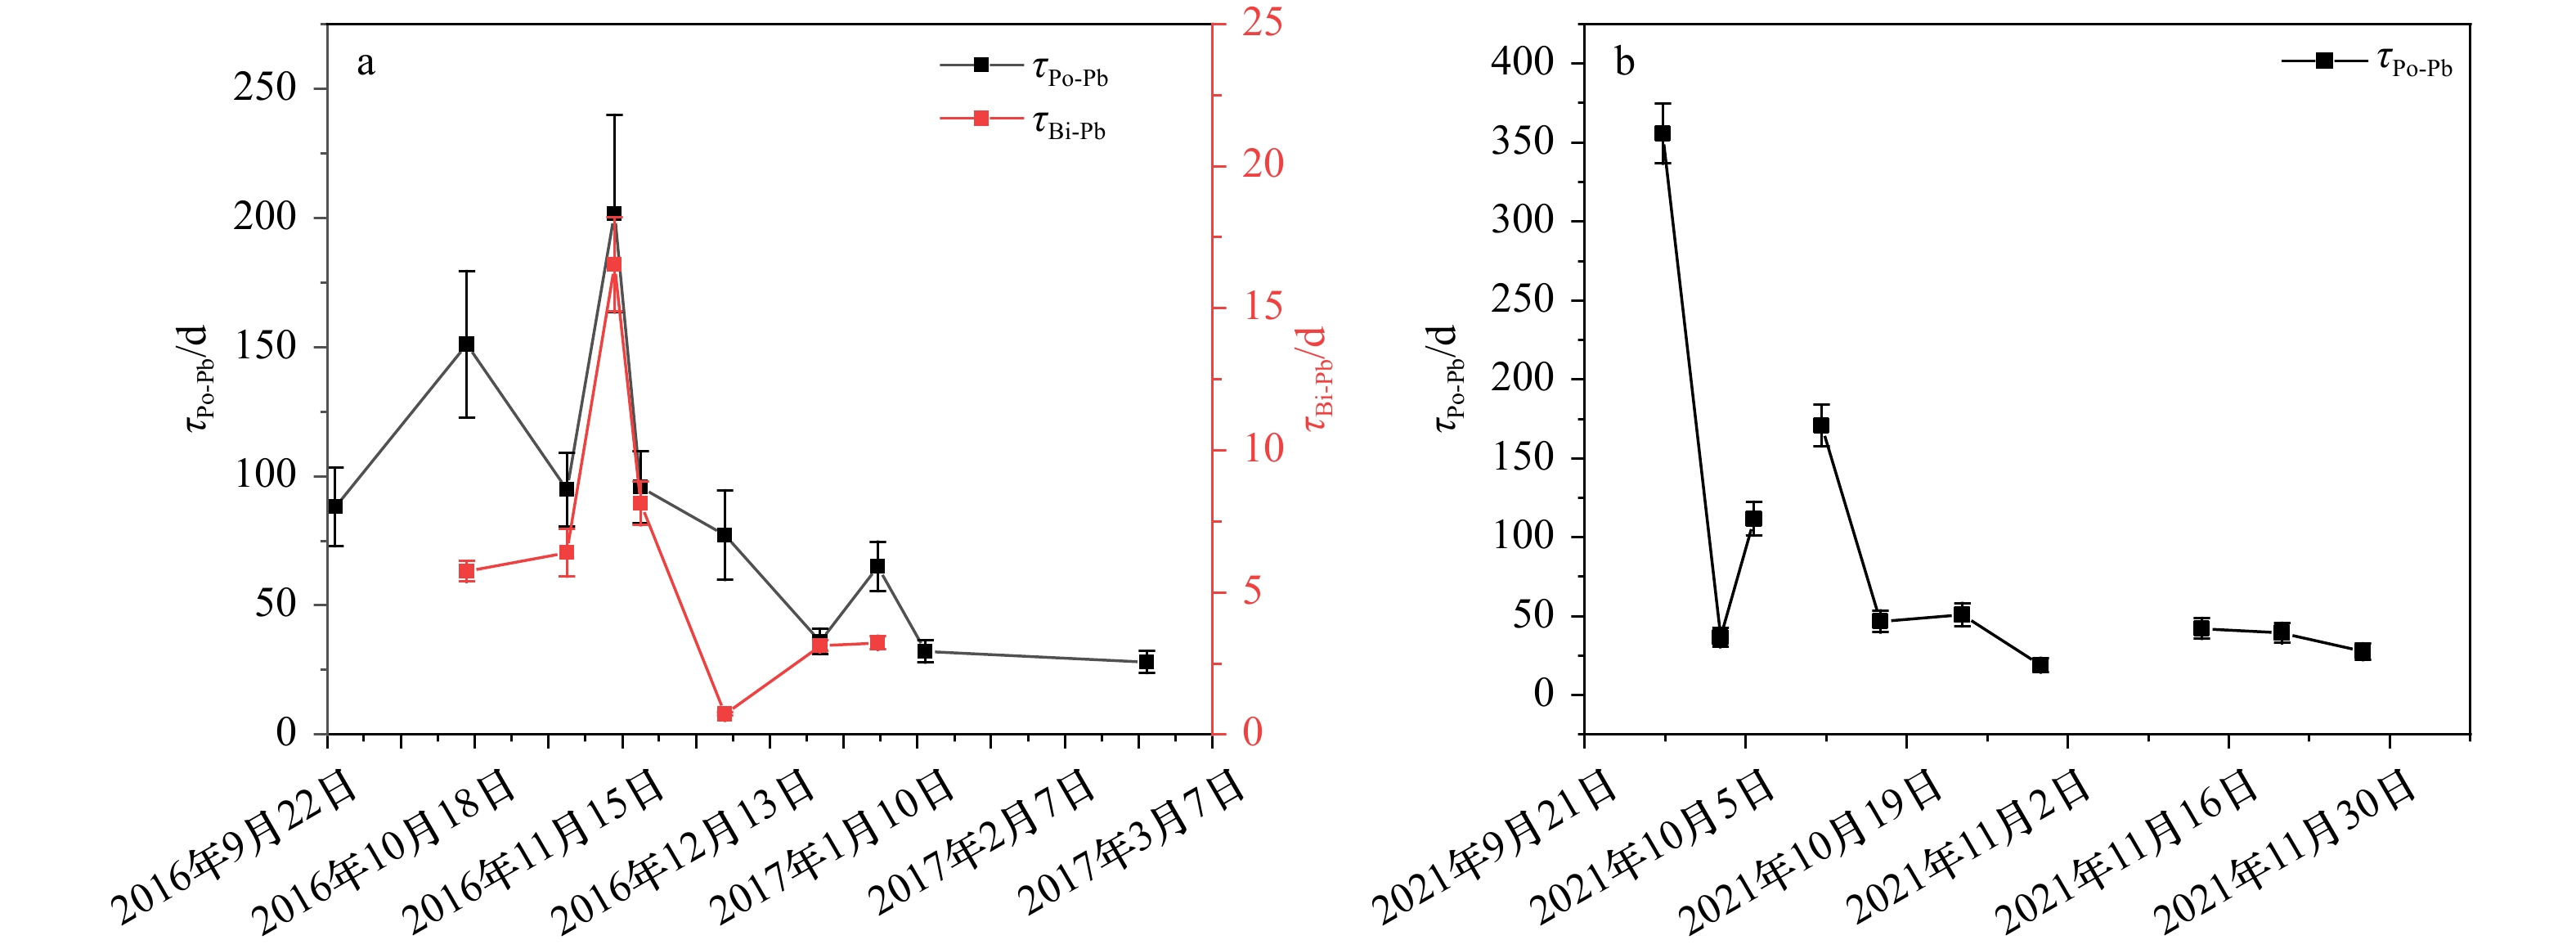
图 4 基于210Bi/210Pb和210Po/210Pb估算的上海地区大气气溶胶颗粒物滞留时间(a)和基于210Po/210Pb估算的厦门地区大气气溶胶颗粒物的滞留时间(b)
Fig. 4 Based on the 210Bi/210Pb and 210Po/210Pb, the residence times of atmospheric aerosol particles over Shanghai is estimated (a) and based on the 210Po/210Pb, the residence times of atmospheric aerosol particles over Xiamen (b) is estimated
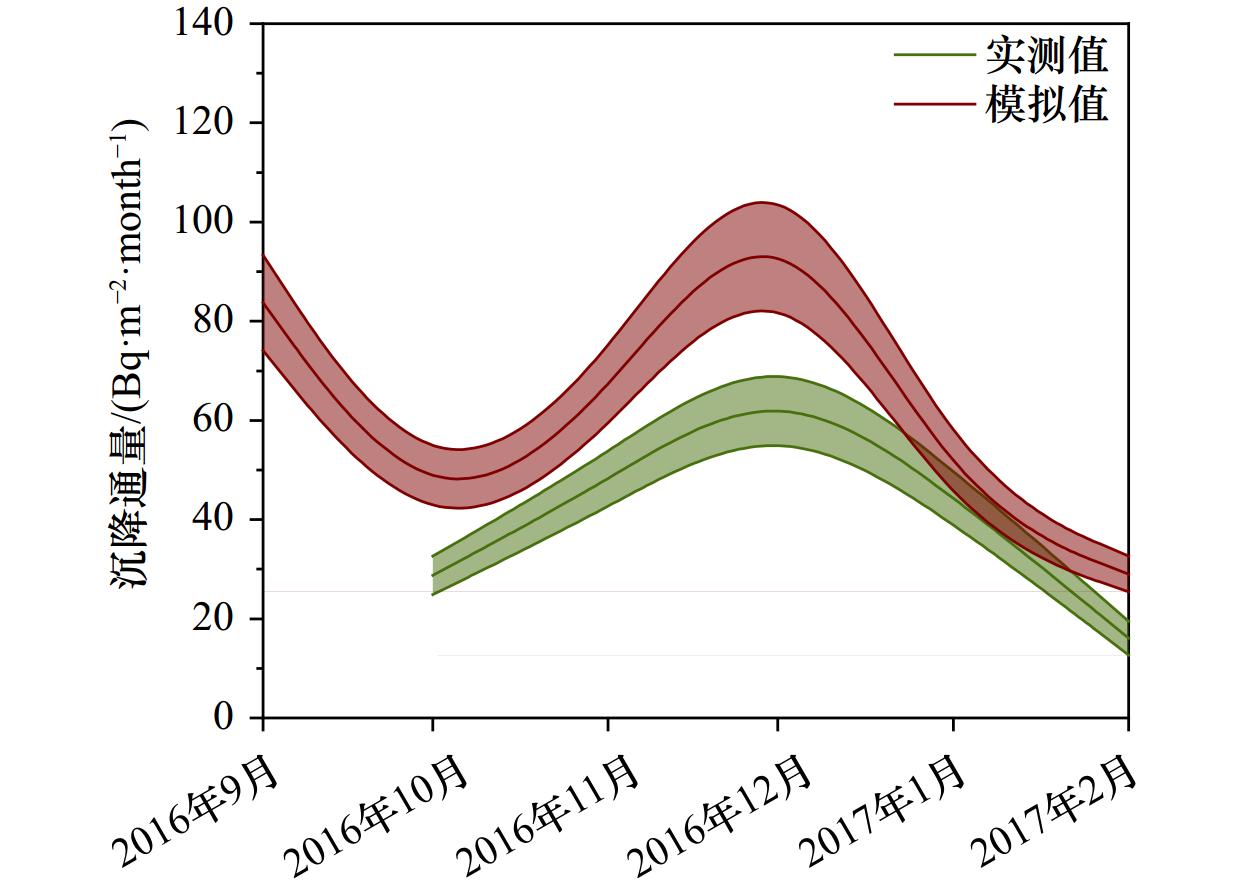
图 5 210Pb沉降入海通量实测值与模拟值[当Vd =(1.0 ± 0.1)cm/s时进行模拟]趋势
Fig. 5 The trend of the measured and simulated flux of 210Pb deposition into the sea [simulated when Vd =(1.0 ± 0.1)cm/s]
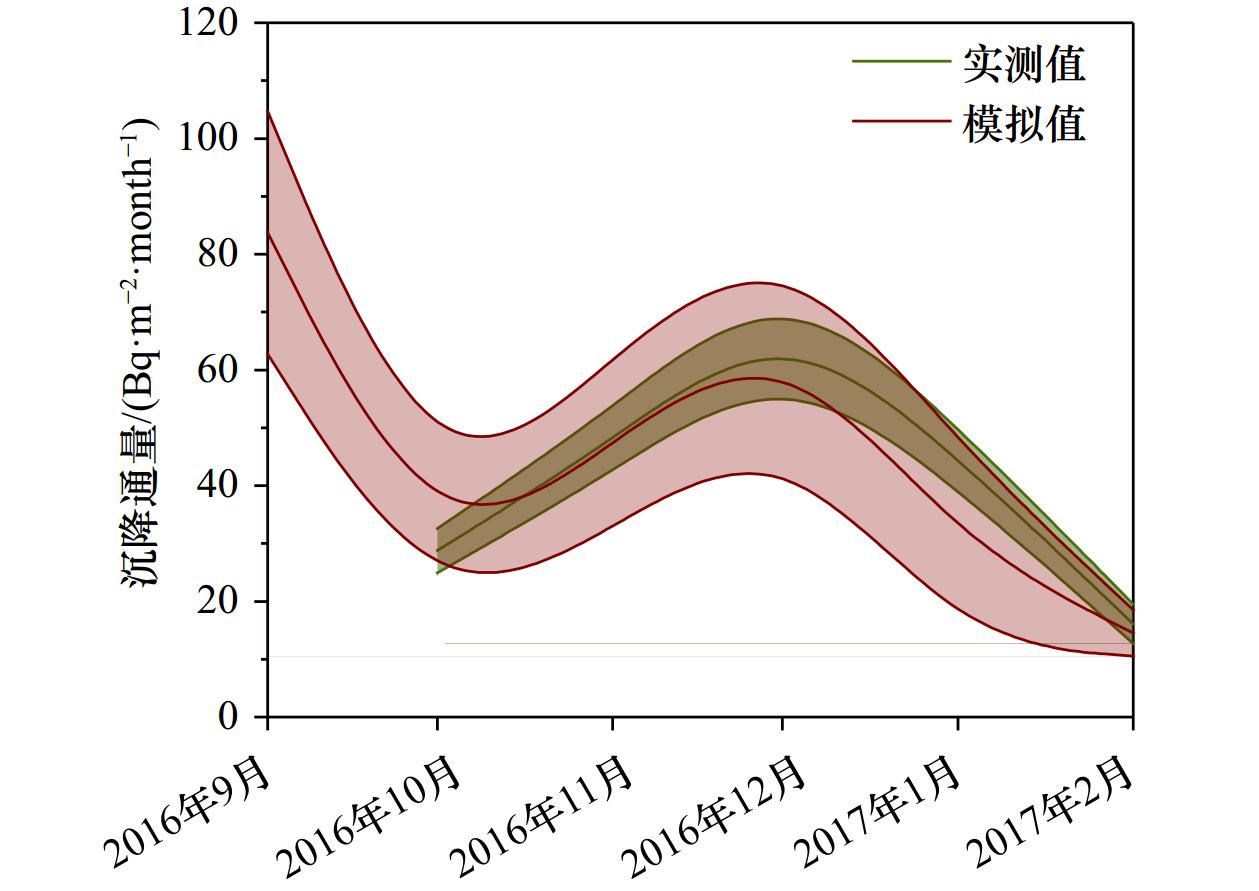
表 1 东海近岸近地面大气气溶胶中210Po、210Bi和210Pb的活度浓度及活度比
Tab. 1 Activities concentration and activity ratios of 210Po, 210Bi and 210Pb in near-surface atmospheric aerosols close to the East China Sea
东海近岸 样品名 采样时间 体积/
m3TSP含量/
(μg·m−3)210Po活度浓度/
(mBq·m−3)210Bi活度浓度/
(mBq·m−3)210Pb活度浓度/
(mBq·m−3)210Po/210Pb 210Bi/210Pb 上海地区 201609-SHA 2016年9月22−23日 1 642 170 0.92 ± 0.08 NA 3.23 ± 0.25* 0.28 ± 0.03 NA 201610-SHA 2016年10月17−18日 2 206 105 0.58 ± 0.03 0.62 ± 0.02 1.41 ± 0.14* 0.41 ± 0.05 0.44 ± 0.02 201611-SHA-1 2016年11月5−6日 2 571 137 0.59 ± 0.04 0.95 ± 0.03 2.00 ± 0.16* 0.30 ± 0.03 0.48 ± 0.02 201611-SHA-2 2016年11月14−15日 2 307 152 1.27 ± 0.10 1.83 ± 0.12 2.61 ± 0.18* 0.49 ± 0.05 0.70 ± 0.05 201611-SHA-3 2016年11月19−20日 1 462 251 0.83 ± 0.05 1.47 ± 0.07 2.75 ± 0.22* 0.30 ± 0.03 0.53 ± 0.03 201612-SHA-1 2016年12月5−6日 1 320 303 0.66 ± 0.09 NA 2.56 ± 0.18* 0.26 ± 0.04 NA 201612-SHA-2 2016年12月23−24日 1 440 316 0.77 ± 0.05 0.51 ± 0.03 6.10 ± 0.53* 0.13 ± 0.01 0.08 ± 0.01 201701-SHA-1 2017年1月3−4日 1 264 84 0.42 ± 0.03 0.59 ± 0.02 1.89 ± 0.15* 0.22 ± 0.02 0.31 ± 0.02 201701-SHA-2 2017年1月12−13日 1 200 101 0.16 ± 0.01 0.45 ± 0.03 1.40 ± 0.12* 0.11 ± 0.01 0.32 ± 0.03 201702-SHA 2017年2月23−24日 1 333 77 0.11 ± 0.01 NA 1.12 ± 0.10* 0.10 ± 0.01 NA 厦门地区 21XMA-1 2021年9月27−28日 1133 69 0.85 ± 0.04 2.52 ± 0.11 1.32 ± 0.10 0.78 ± 0.06 1.96 ± 0.18 21XMA-2 2021年10月2−3日 1 121 51 0.14 ± 0.01 1.29 ± 0.07 0.80 ± 0.06 0.19 ± 0.02 1.30 ± 0.12 21XMA-3 2021年10月5−6日 1 175 68 0.21 ± 0.01 0.83 ± 0.04 0.53 ± 0.04 0.43 ± 0.03 1.36 ± 0.13 21XMA-4 2021年10月10−11日 1 135 42 0.11 ± 0.01 NA NA NA NA 21XMA-5 2021年10月11−12日 1 263 98 0.08 ± 0.02 NA 0.17 ± 0.10 0.54 ± 0.12 NA 21XMA-6 2021年10月16−17日 1 206 80 0.05 ± 0.02 NA 0.26 ± 0.02 0.23 ± 0.07 NA 21XMA-7 2021年10月23−24日 1 222 23 0.09 ± 0.01 NA 0.41 ± 0.04 0.24 ± 0.03 NA 21XMA-8 2021年10月30−31日 1 484 81 0.10 ± 0.02 NA 1.07 ± 0.07 0.10 ± 0.02 NA 21XMA-10 2021年11月13−14日 1 589 56 0.16 ± 0.01 NA 0.93 ± 0.08 0.19 ± 0.02 NA 21XMA-11 2021年11月20−21日 1 520 123 0.13 ± 0.01 NA 0.76 ± 0.05 0.18 ± 0.02 NA 21XMA-12 2021年11月27−28日 1 620 40 0.06 ± 0.01 NA 0.50 ± 0.05 0.13 ± 0.01 NA 注:*代表气溶胶中210Pb的活度浓度引自文献[17];NA表示“未获得”。  下载: 导出CSV
表 2 全球各地区气溶胶中210Po、210Bi和210Pb的活度浓度大小对比
Tab. 2 Comparison of 210Po activity concentration, 210Bi activity concentration and 210Pb activity concentration in aerosols from different regions of the world
地区 海拔/m 年降水量/
mm观测时间 210Pb活度浓度/(mBq·m−3) 210Bi活度浓度/(mBq·m−3) 210Po活度浓度/(mBq·m−3) 文献 范围 平均值 范围 平均值 范围 平均值 上海 约20 1 260 2016年9月至翌年2月 1.12~6.10 2.51 ± 1.36 0.45~1.83 0.92 ± 0.50 0.11~1.27 0.63 ± 0.33 本文 厦门 约15 1 464 2021年9−11月 0.17~1.24 0.67 ± 0.05 0.83~2.52 1.55 ± 0.82 0.06~0.97 0.21 ± 0.25 本文 美国底特律 约15 851 2017年9月至翌年1月 0.18~2.23 0.85 ± 0.49 0.06~0.81 0.35 ± 0.20 0.010~0.096 0.03 ± 0.019 文献[15] 美国橡树岭
国家实验室约25 − 1984年10月至翌年2月 0.14~0.27 0.19 ± 0.08 0.06~0.11 0.08 ± 0.06 − − 文献[22] 葡萄牙里斯本 25 1 000 1986年1月至
1989年12月(秋冬季)0.04~0.42 0.16 ± 0.09 0.01~0.27 0.12 ± 0.07 0.003~0.171 0.024 ± 0.01 文献[21] 印度坎普尔 约142 810 2007年1月至2009年4月 0.50~4.80 1.80 ± 1.10 − − 0.002~0.28 0.094 文献[23] 美国波克福莱特 近地面 1 119 1996年1−2月 0.82~1.02 0.92 ± 0.10 − − 0.048~0.152 0.100 ± 0.052 文献[24] 美国伊戈尔岛 近地面 − 1996年1−3月 0.22~0.55 0.37 ± 0.12 − − 0.018~0.059 0.037 ± 0.015 文献[24]
下载: 导出CSV
表 3 上海市气溶胶中210Pb的模拟沉降入海通量与实测沉降通量及210Po和210Bi的沉降入海通量模拟值
Tab. 3 Calculated and measured deposition fluxes of 210Pb and simulated deposition fluxes of 210Po, 210Bi in aerosols in Shanghai
观测月份 Vd/(cm·s−1) 210Pb模拟值/(Bq·m−2·month−1) 210Pb实测值/(Bq·m−2·month−1) 210Po模拟值/(Bq·m−2·month−1) 210Bi模拟值/(Bq·m−2·month−1) 2016年9月 1.00 ± 0.25* 83.72 ± 20.39 NA 23.85 ± 2.90 NA 2016年10月 0.70 ± 0.18* 25.58 ± 9.13 28.76 ± 3.85 10.52 ± 1.05 11.25 ± 1.02 2016年11月 0.75 ± 0.19* 47.69 ± 11.32 47.67 ± 5.44 17.43 ± 1.93 27.54 ± 2.74 2016年12月 0.60 ± 0.15* 67.34 ± 16.83 69.64 ± 7.73 11.12 ± 1.44 7.93 ± 0.82 2017年1月 0.70 ± 0.28* 29.85 ± 14.07 45.01 ± 5.31 5.26 ± 0.58 9.43 ± 0.92 2017年2月 0.50 ± 0.13* 14.52 ± 3.77 16.11 ± 3.40 1.43 ± 0.18 NA 注:*表示气溶胶中210Pb沉降速率Vd引自文献[36];210Pb沉降通量实测值引自文献[35];NA表示“未获得”。
下载: 导出CSV
-
[1] Cresswell T, Metian M, Fisher N S, et al. Exploring new frontiers in marine radioisotope tracing-adapting to new opportunities and challenges[J]. Frontiers in Marine Science, 2020, 7: 406. doi: 10.3389/fmars.2020.00406 [2] Shannon L V, Cherry R D, Orren M J. Polonium-210 and lead-210 in the marine environment[J]. Geochimica et Cosmochimica Acta, 1970, 34(6): 701−711. doi: 10.1016/0016-7037(70)90072-4 [3] 钟强强. 核素大气沉降过程及其对上层海洋POC输出通量研究的启示[D]. 上海: 华东师范大学, 2020.Zhong Qiangqiang. Atmospheric deposition of radionuclides and its application in POC export fluxes of the upper sea[D]. Shanghai: East China Normal University, 2020. [4] Stewart G, Cochran J K, Miquel J C, et al. Comparing POC export from 234Th/238U and 210Po/210Pb disequilibria with estimates from sediment traps in the Northwest Mediterranean[J]. Deep-Sea Research Part I: Oceanographic Research Papers, 2007, 54(9): 1549−1570. doi: 10.1016/j.dsr.2007.06.005 [5] Murray J W, Paul B, Dunne J P, et al. 234Th, 210Pb, 210Po and stable Pb in the Central Equatorial Pacific: tracers for particle cycling[J]. Deep-Sea Research Part I: Oceanographic Research Papers, 2005, 52(11): 2109−2139. doi: 10.1016/j.dsr.2005.06.016 [6] Verdeny E, Masqué P, Garcia-Orellana J, et al. POC export from ocean surface waters by means of 234Th/238U and 210Po/210Pb disequilibria: a review of the use of two radiotracer pairs[J]. Deep-Sea Research Part II: Topical Studies in Oceanography, 2009, 56(18): 1502−1518. doi: 10.1016/j.dsr2.2008.12.018 [7] Friedrich J, Van Der Loeff M M R. A two-tracer (210Po-234Th) approach to distinguish organic carbon and biogenic silica export flux in the Antarctic Circumpolar Current[J]. Deep-Sea Research Part I: Oceanographic Research Papers, 2002, 49(1): 101−120. doi: 10.1016/S0967-0637(01)00045-0 [8] Wei C L, Lin S Y, Sheu D D D, et al. Particle-reactive radionuclides (234Th, 210Pb, 210Po) as tracers for the estimation of export production in the South China Sea[J]. Biogeosciences, 2011, 8(12): 3793−3808. doi: 10.5194/bg-8-3793-2011 [9] Anand S S, Rengarajan R, Shenoy D, et al. POC export fluxes in the Arabian Sea and the Bay of Bengal: a simultaneous 234Th/238U and 210Po/210Pb study[J]. Marine Chemistry, 2018, 198: 70−87. doi: 10.1016/j.marchem.2017.11.005 [10] Shelley R U, Roca-Martí M, Castrillejo M, et al. Quantification of trace element atmospheric deposition fluxes to the Atlantic Ocean (> 40°N; GEOVIDE, GEOTRACES GA01) during spring 2014[J]. Deep-Sea Research Part I: Oceanographic Research Papers, 2017, 119: 34−49. doi: 10.1016/j.dsr.2016.11.010 [11] Verdeny E, Masqué P, Maiti K, et al. Particle export within cyclonic Hawaiian lee eddies derived from 210Pb-210Po disequilibrium[J]. Deep-Sea Research Part II: Topical Studies in Oceanography, 2008, 55(10−13): 1461−1472. doi: 10.1016/j.dsr2.2008.02.009 [12] Horowitz E J, Cochran J K, Bacon M P, et al. 210Po and 210Pb distributions during a phytoplankton bloom in the North Atlantic: implications for POC export[J]. Deep-Sea Research Part I: Oceanographic Research Papers, 2020, 164: 103339. doi: 10.1016/j.dsr.2020.103339 [13] Zhang Fule, Wang Jinlong, Baskaran M, et al. A global dataset of atmospheric 7Be and 210Pb measurements: annual air concentration and depositional flux[J]. Earth System Science Data, 2021, 13(6): 2963−2994. doi: 10.5194/essd-13-2963-2021 [14] Zhong Qiangqiang, Puigcorbé V, Sanders C, et al. Analysis of 210Po, 210Bi, and 210Pb in atmospheric and oceanic samples by simultaneously auto-plating 210Po and 210Bi onto a nickel disc[J]. Journal of Environmental Radioactivity, 2020, 220−221: 106301. doi: 10.1016/j.jenvrad.2020.106301 [15] 杜娟. 大气散落放射性核素沉降过程的研究及其在示踪东海海域现代沉积过程中的应用[D]. 上海: 华东师范大学, 2019.Du Juan. Study on the depositional processes of the atmospheric fallout radionuclides and their application on tracing modern sedimentation processes at the East China Sea[D]. Shanghai: East China Normal University, 2019. [16] Deng Binbin, Zhong Qiangqiang, Wang Qiugui, et al. Temporal variation of 210Pb concentration in the urban aerosols of Shanghai, China[J]. Journal of Radioanalytical and Nuclear Chemistry, 2020, 323(3): 1135−1143. doi: 10.1007/s10967-020-07027-6 [17] 钟强强, 王求贵, 于涛, 等. 210Po-210Pb 活度不平衡鉴年法测定北极冰区表层冰雪年龄[J]. 海洋学报, 2022, 44(9): 63−72.Zhong Qiangqiang, Wang Qiugui, Yu Tao, et al. Dating the age of surficial snow in the Arctic Ocean by 210Po-210Pb activity disequilibria[J]. Haiyang Xuebao, 2022, 44(9): 63−72. [18] Wei Ziran, Cochran J K, Horowitz E, et al. 210Pb and 7Be as coupled flux and source tracers for aerosols in the Pacific Ocean[J]. Global Biogeochemical Cycles, 2022, 36(8): e2022GB007378. doi: 10.1029/2022GB007378 [19] Zalewska T, Biernacik D, Marosz M. Correlations between 7Be, 210Pb, dust and PM10 concentrations in relation to meteorological conditions in northern Poland in 1998−2018[J]. Journal of Environmental Radioactivity, 2021, 228: 106526. doi: 10.1016/j.jenvrad.2020.106526 [20] Rastogi N, Sarin M M. Atmospheric 210Pb and 7Be in ambient aerosols over low- and high-altitude sites in semiarid region: temporal variability and transport processes[J]. Journal of Geophysical Research: Atmospheres, 2008, 113(D11): D11103. [21] Carvalho F P. Origins and concentrations of 222Rn, 210Pb, 210Bi and 210Po in the surface air at Lisbon, Portugal, at the Atlantic edge of the European continental landmass[J]. Atmospheric Environment, 1995, 29(15): 1809−1819. doi: 10.1016/1352-2310(95)00076-B [22] Papastefanou C, Bondietti E A. Mean residence times of atmospheric aerosols in the boundary layer as determined from 210Bi/210Pb activity ratios[J]. Journal of Aerosol Science, 1991, 22(7): 927−931. doi: 10.1016/0021-8502(91)90085-V [23] Ram K, Sarin M M. Atmospheric 210Pb, 210Po and 210Po/210Pb activity ratio in urban aerosols: temporal variability and impact of biomass burning emission[J]. Tellus B: Chemical and Physical Meteorology, 2012, 64(1): 17513. doi: 10.3402/tellusb.v64i0.17513 [24] Baskaran M, Shaw G E. Residence time of arctic haze aerosols using the concentrations and activity ratios of 210Po, 210Pb and 7Be[J]. Journal of Aerosol Science, 2001, 32(4): 443−452. doi: 10.1016/S0021-8502(00)00093-8 [25] Poet S E, Moore H E, Martell E A. Lead 210, bismuth 210, and polonium 210 in the atmosphere: accurate ratio measurement and application to aerosol residence time determination[J]. Journal of Geophysical Research, 1972, 77(33): 6515−6527. doi: 10.1029/JC077i033p06515 [26] Moore H E, Poet S E, Martell E A. 222Rn, 210Pb, 210Bi, and 210Po profiles and aerosol residence times versus altitude[J]. Journal of Geophysical Research, 1973, 78(30): 7065−7075. doi: 10.1029/JC078i030p07065 [27] Chen Jinfang, Luo Shangde, Huang Yipu. Scavenging and fractionation of particle-reactive radioisotopes 7Be, 210Pb and 210Po in the atmosphere[J]. Geochimica et Cosmochimica Acta, 2016, 188: 208−223. doi: 10.1016/j.gca.2016.05.039 [28] Baskaran M. Po-210 and Pb-210 as atmospheric tracers and global atmospheric Pb-210 fallout: a review[J]. Journal of Environmental Radioactivity, 2011, 102(5): 500−513. doi: 10.1016/j.jenvrad.2010.10.007 [29] Semertzidou P, Piliposian G T, Appleby P G. Atmospheric residence time of 210Pb determined from the activity ratios with its daughter radionuclides 210Bi and 210Po[J]. Journal of Environmental Radioactivity, 2016, 160: 42−53. doi: 10.1016/j.jenvrad.2016.04.019 [30] Papastefanou C. Residence time of tropospheric aerosols in association with radioactive nuclides[J]. Applied Radiation and Isotopes, 2006, 64(1): 93−100. doi: 10.1016/j.apradiso.2005.07.006 [31] 李加兴, 潘竞舜, 文富平, 等. 大气气溶胶滞留时间计算和分析[J]. 辐射防护通讯, 2013, 33(3): 25−28, 33.Li Jiaxing, Pan Jingshun, Wen Fuping, et al. Calculation and analysis of aerosol residence times in atmosphere[J]. Radiation Protection Bulletin, 2013, 33(3): 25−28, 33. [32] Lambert G, Polian G, Sanak J, et al. The cycle of radon and its decay products: An application to study of troposphere-stratosphere exchange[J]. Annales de Geophusique, 1982, 38: 497−531. [33] Turekian K K, Benninger L K, Dion E P. 7Be and 210Pb total deposition fluxes at New Haven, Connecticut and at Bermuda[J]. Journal of Geophysical Research: Oceans, 1983, 88(C9): 5411−5415. doi: 10.1029/JC088iC09p05411 [34] 吴家堡, 李涌, 刘国卿, 等. 深圳市大气210Pb的活度浓度、沉降通量和沉积速率研究[J]. 地球化学, 2021, 50(2): 219−225.Wu Jiabao, Li Yong, Liu Guoqing, et al. Activity concentrations, depositional fluxes and deposition velocities of 210Pb in atmospheric aerosols of Shenzhen[J]. Geochimica, 2021, 50(2): 219−225. [35] 赵丽君. 多核素示踪的河口海岸现代沉积物年代学比较研究[D]. 上海: 华东师范大学, 2018.Zhao Lijun. Comparative study on the chronology in the recent sediment of estuary and coast by multi-radionuclides[D]. Shanghai: East China Normal University, 2018. [36] Winkler R, Rosner G. Seasonal and long-term variation of 210Pb concentration in air, atmospheric deposition rate and total deposition velocity in South Germany[J]. Science of the Total Environment, 2000, 263(1−3): 57−68. doi: 10.1016/S0048-9697(00)00666-5 [37] 赵峰. 长江口及黄海海域中210Po和210Pb的环境分布及其活性不平衡现象[D]. 上海: 华东师范大学, 2010.Zhao Feng. Distribution and radioactive disequilibrium of 210Po and 210Pb in Changjiang Estuary and the Yellow Sea[D]. Shanghai: East China Normal University, 2010. [38] 易勇, 白洁, 刘广山, 等. 青岛市7Be, 210Pb和210Po大气沉降通量的测定[J]. 海洋科学, 2005, 29(12): 20−24. doi: 10.3969/j.issn.1000-3096.2005.12.005Yi Yong, Bai Jie, Liu Guangshan, et al. Measurements of atmospheric deposition fluxes of 7Be, 210Pb and 210Po[J]. Marine Sciences, 2005, 29(12): 20−24. doi: 10.3969/j.issn.1000-3096.2005.12.005 -

计量
- 文章访问数: 487
- HTML全文浏览量: 164
- PDF下载量: 37
- 被引次数: 0
