

Study on the evolution process and driving mechanism of the sandy shoreline of the Qiwang Bay in eastern Guangdong from 1986 to 2019
-
摘要: 本文采用1986–2019年113景Landsat影像提取高潮线,辅以2015–2019年实测剖面数据,开展了海湾尺度上海岸线的中长期演变过程与驱动机制研究。结果表明:企望湾以中间小型基岩岬角为界划分出的西侧海滩和东侧海滩分别具备4种和3种不同的空间特征;超过一半的区域其海岸线演变表现为非线性行为;Mann-Kendall趋势检验和显著性分析方法较好地解决了已有研究中对研究时段划分缺乏依据的问题;近5年的实测剖面数据也验证了企望湾近期显著的淤积和侵蚀现象。进一步研究表明,自西向东的沿岸输沙过程是近期海岸线演变主要的驱动机制,东侧防波堤因为改变了控制性“岬角”的位置,造成了海湾平面形态不平衡,而中间小型基岩岬角也影响了企望湾侵蚀和淤积的空间差异性。研究结果对于预测未来岸线位置和控制岸线侵蚀风险具有重要的理论和现实意义。Abstract: A dataset of the high water lines extracted from 113 Landsat images from 1986 to 2019 and the measured profile data from 2015 to 2019 were used to examine the middle-term to long-term shoreline process and driver at the embayment scale in this paper. The results show that the western and eastern beaches of the Qiwang Bay, which is separated by one small bedrock headland, have four and three different spatial characteristics, respectively. More than half of the shorelines behaved nonlinear in their variation trends. Thus, we use the Mann-Kendall method to solve the problem of the lack of basis for the division of time periods. In addition, the east breakwater resulted in the unstable embayment planform due to changing the position of the controlling “headland” and therefore the longshore sediment transport from west to east is the main driver of the most recent shoreline. And the intervening small bedrock headland also influenced the spatial variability of erosion and accretion at the Qiwang Bay. These findings will have important theoretical and practical significance for predicting further shoreline position and reducing the risk of shoreline erosion.
-
Key words:
- shoreline /
- Landsat image /
- nonlinear change /
- longshore sediment transport /
- headland-bay beach
-
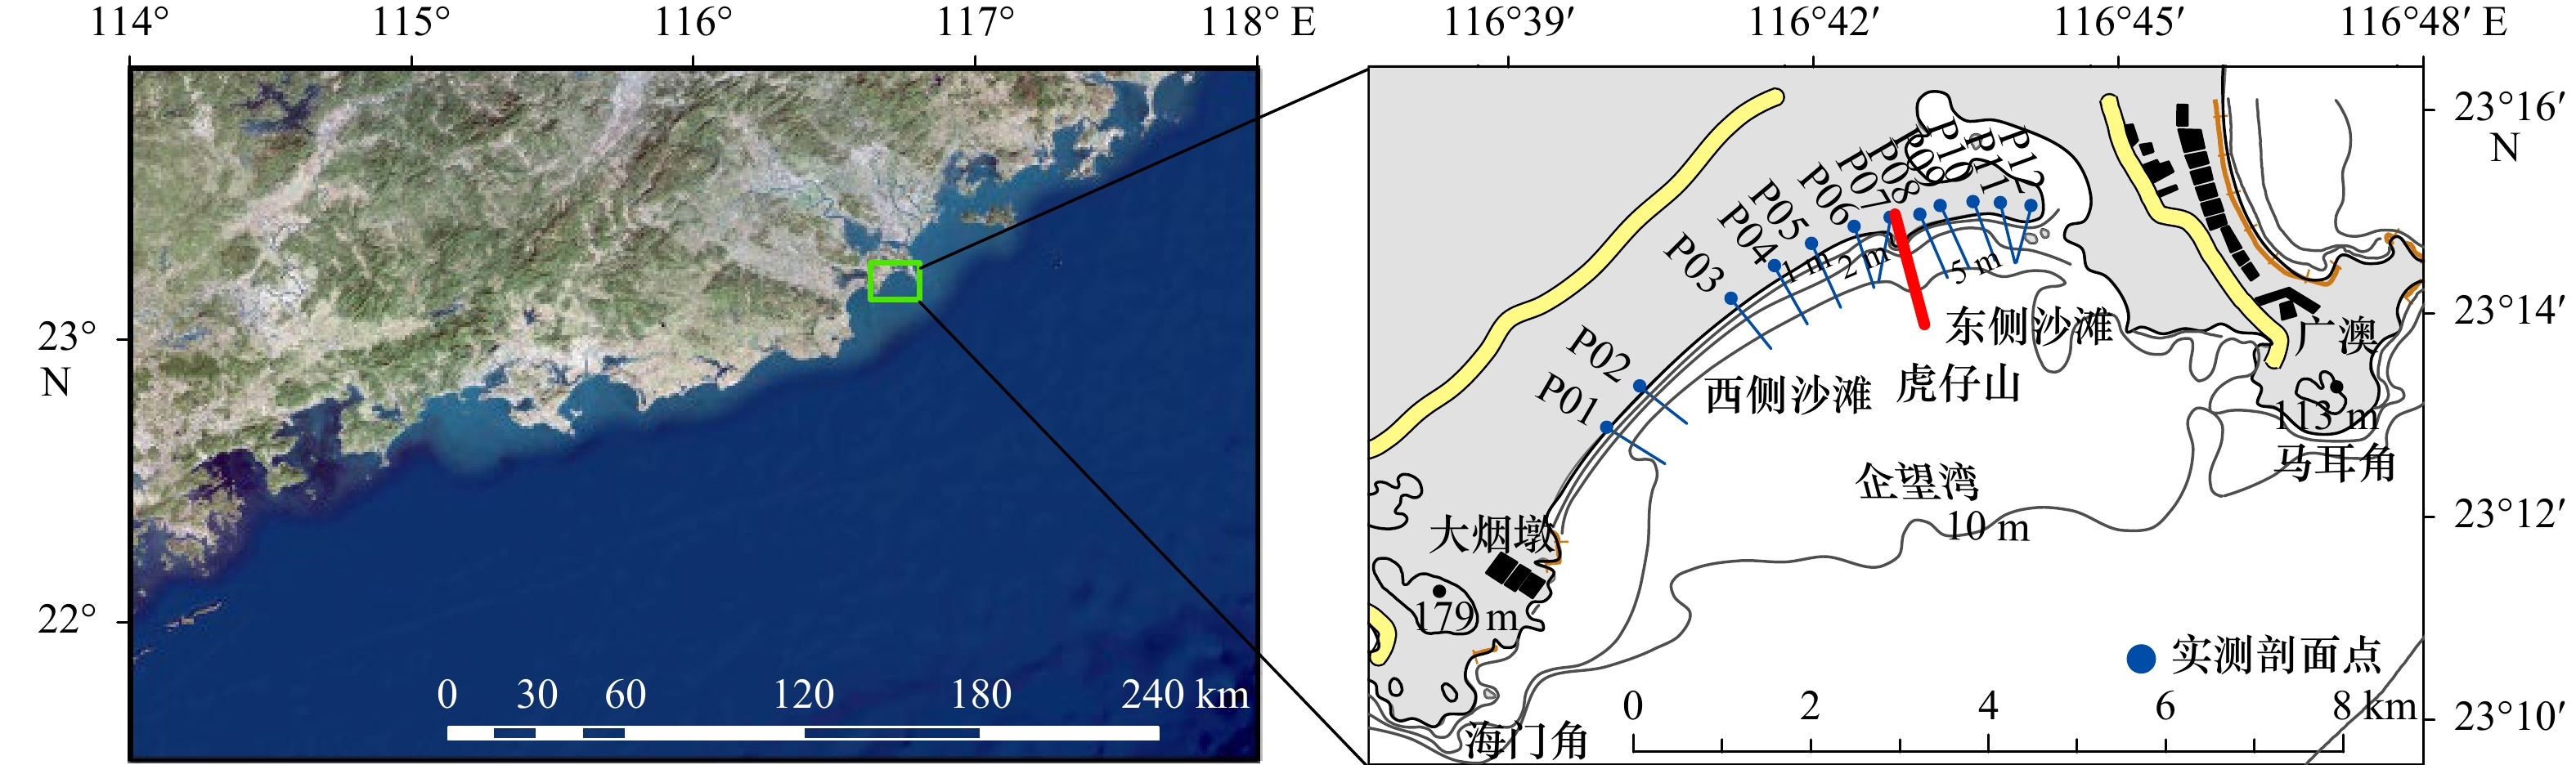
图 1 研究区位置和等深线、剖面布设
黑点处113 m和179 m代表此处的高程
Fig. 1 Location of the study area, and its bathymetric contours and profile arrangement
113 m and 179 m at the black spots are the distance height

图 2 使用的Landsat陆地卫星影像成像时刻潮高
Fig. 2 Landsat series satellite images available and tidal heights at the time of imaging
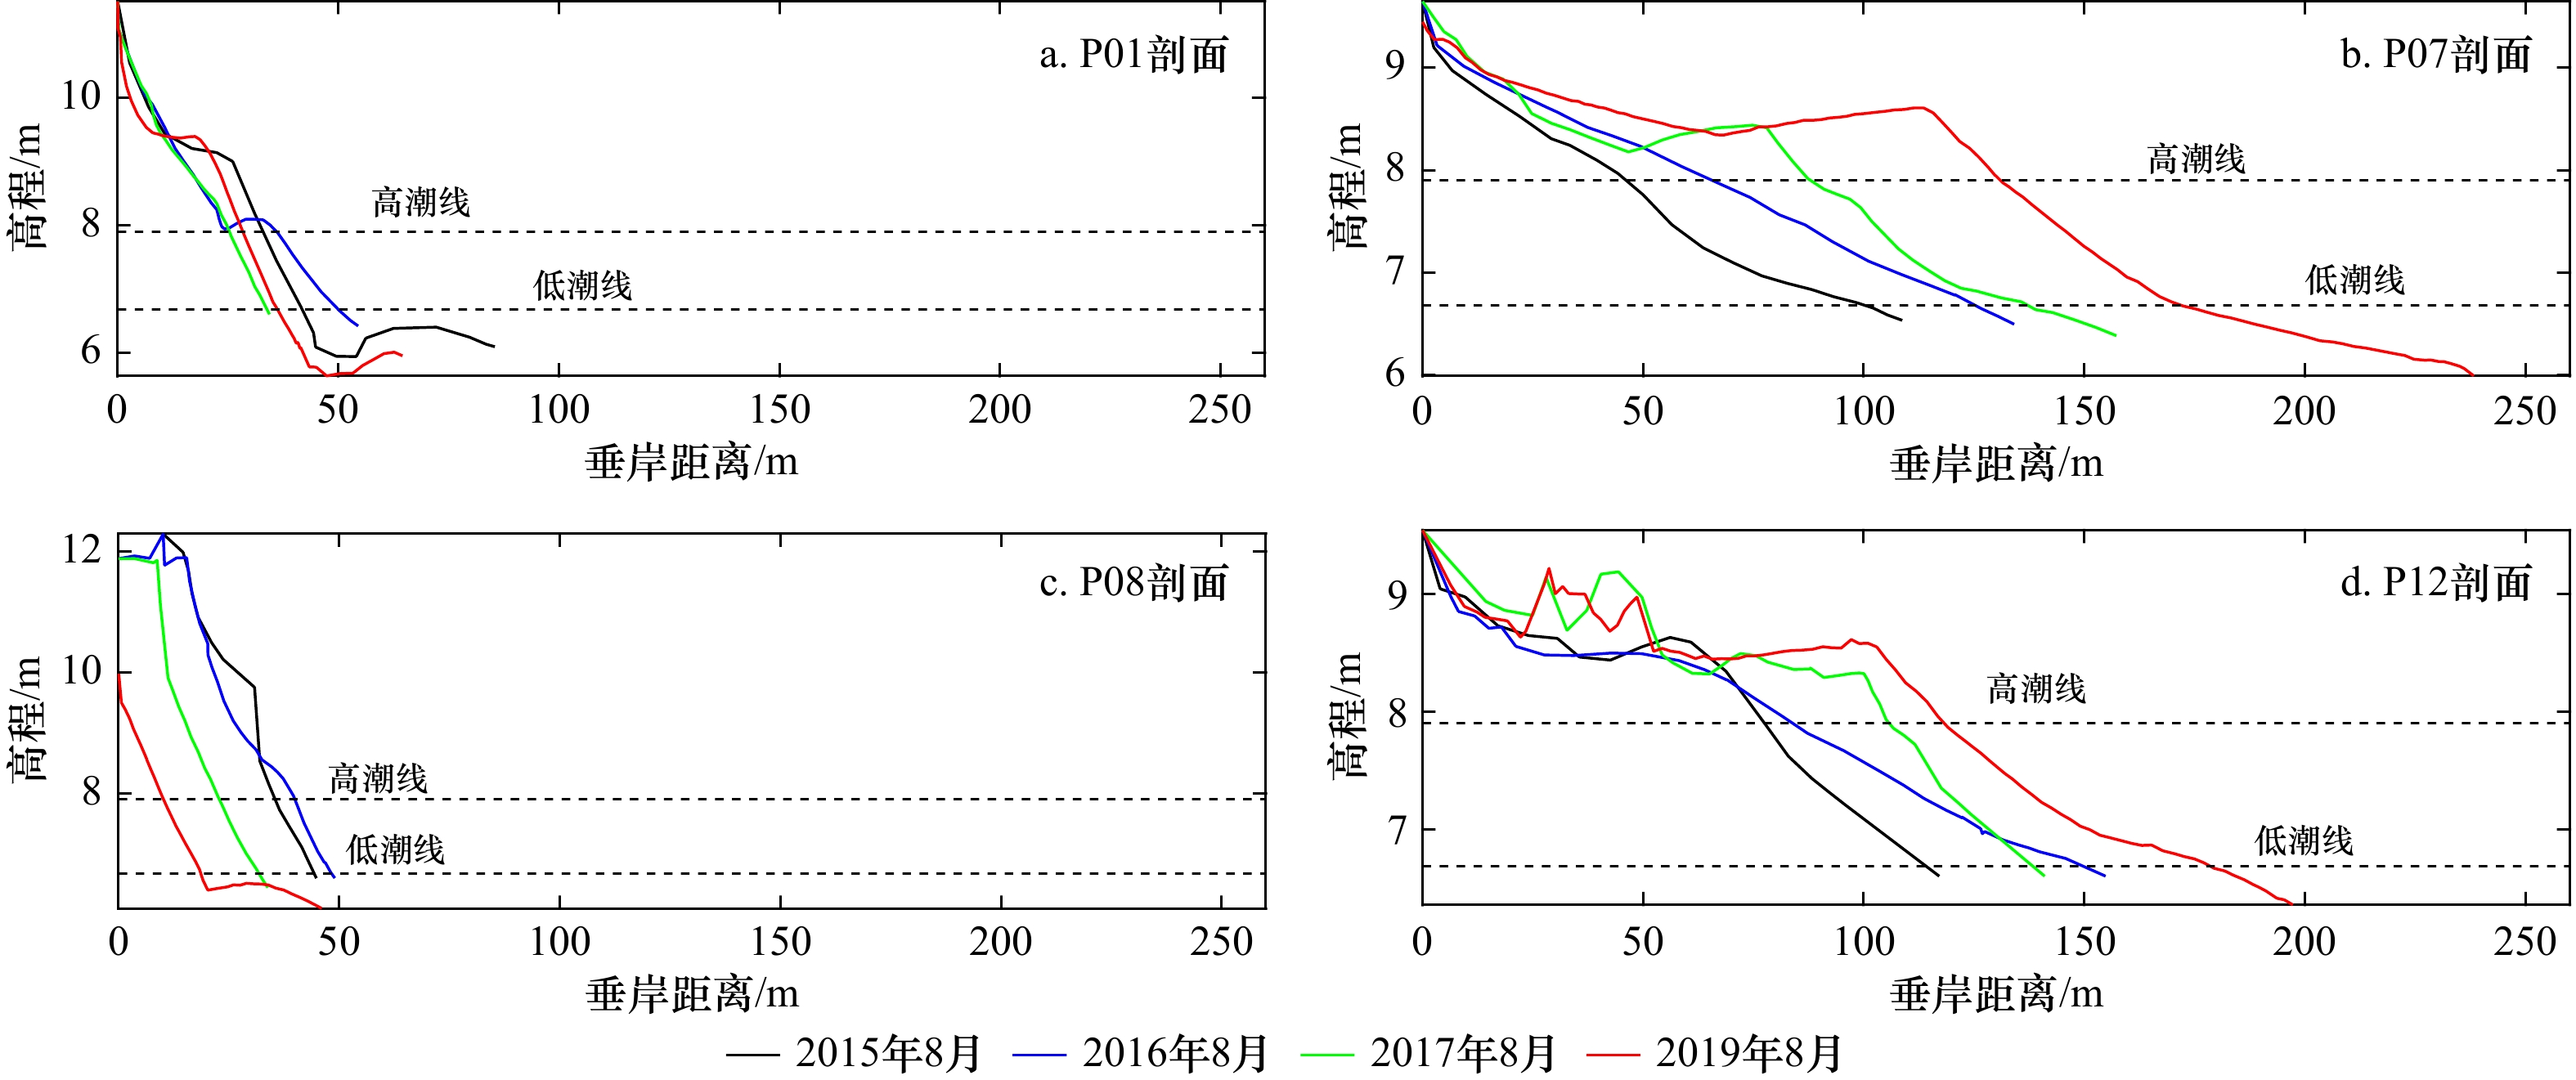
图 3 2015–2019年夏季企望湾4条海滩剖面地形变化情况
Fig. 3 The morphological changes of four beach profiles at the Qiwang Bay in the summers of 2015 to 2019

图 4 1986–2019年企望湾海岸线进退情况
Fig. 4 Shoreline advance and recession of the Qiwang Bay during 1986 to 2019

图 5 LRR方法计算的企望湾不同时段海岸线进退情况
Fig. 5 Shoreline advance and recession during different periods calcultated by LRR method at the Qiwang Bay
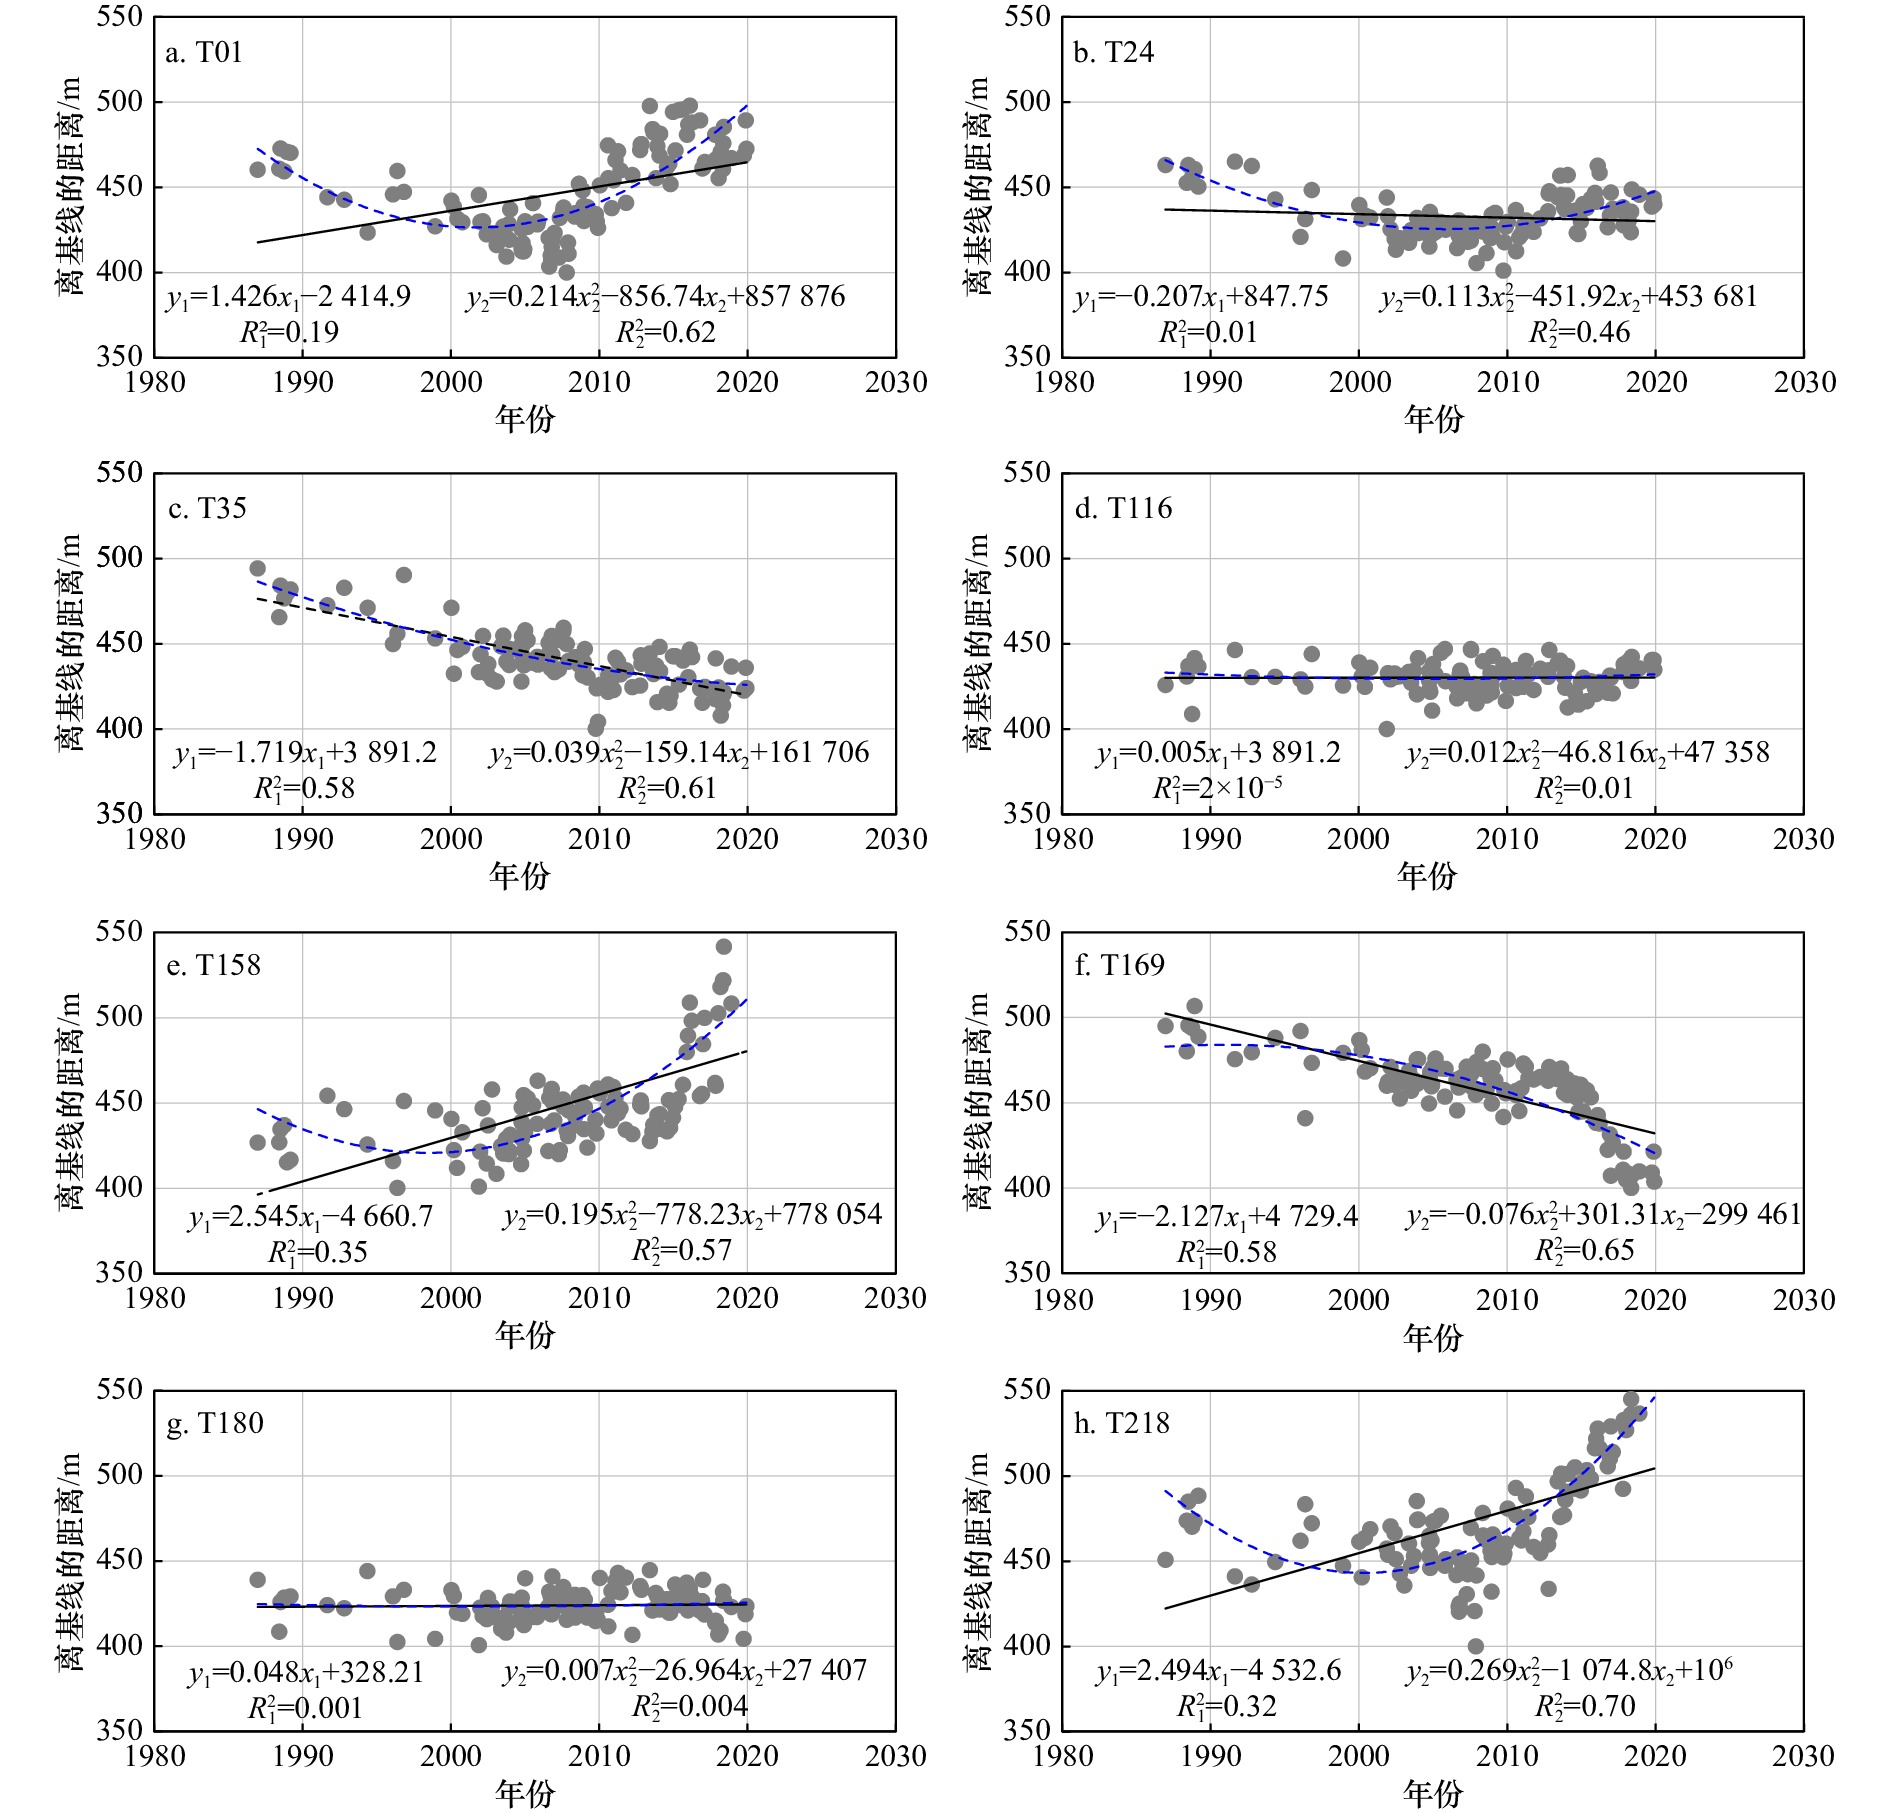
图 6 采用线性拟合方法和二项式拟合方法得到断面的长期趋势特征
Fig. 6 Long-term trend characteristics of individual intersect obtained by the methods of linear and binomial fitting

图 7 M-K趋势检验得到具体断面的变化趋势及显著性检验
箭头指示了断面趋势发生明显变化
Fig. 7 The changing trend and significance test of specific transect obtained by M-K trend detecting method
The arrows indicate a marlced charge in the trend of the transect

图 8 企望湾典型侵蚀(a−c,g−i)和淤积(d−f)岸段的特征
Fig. 8 Erosion (a−c, g−i) and accretion (d−f) characteristics of typical segments at the Qiwang Bay
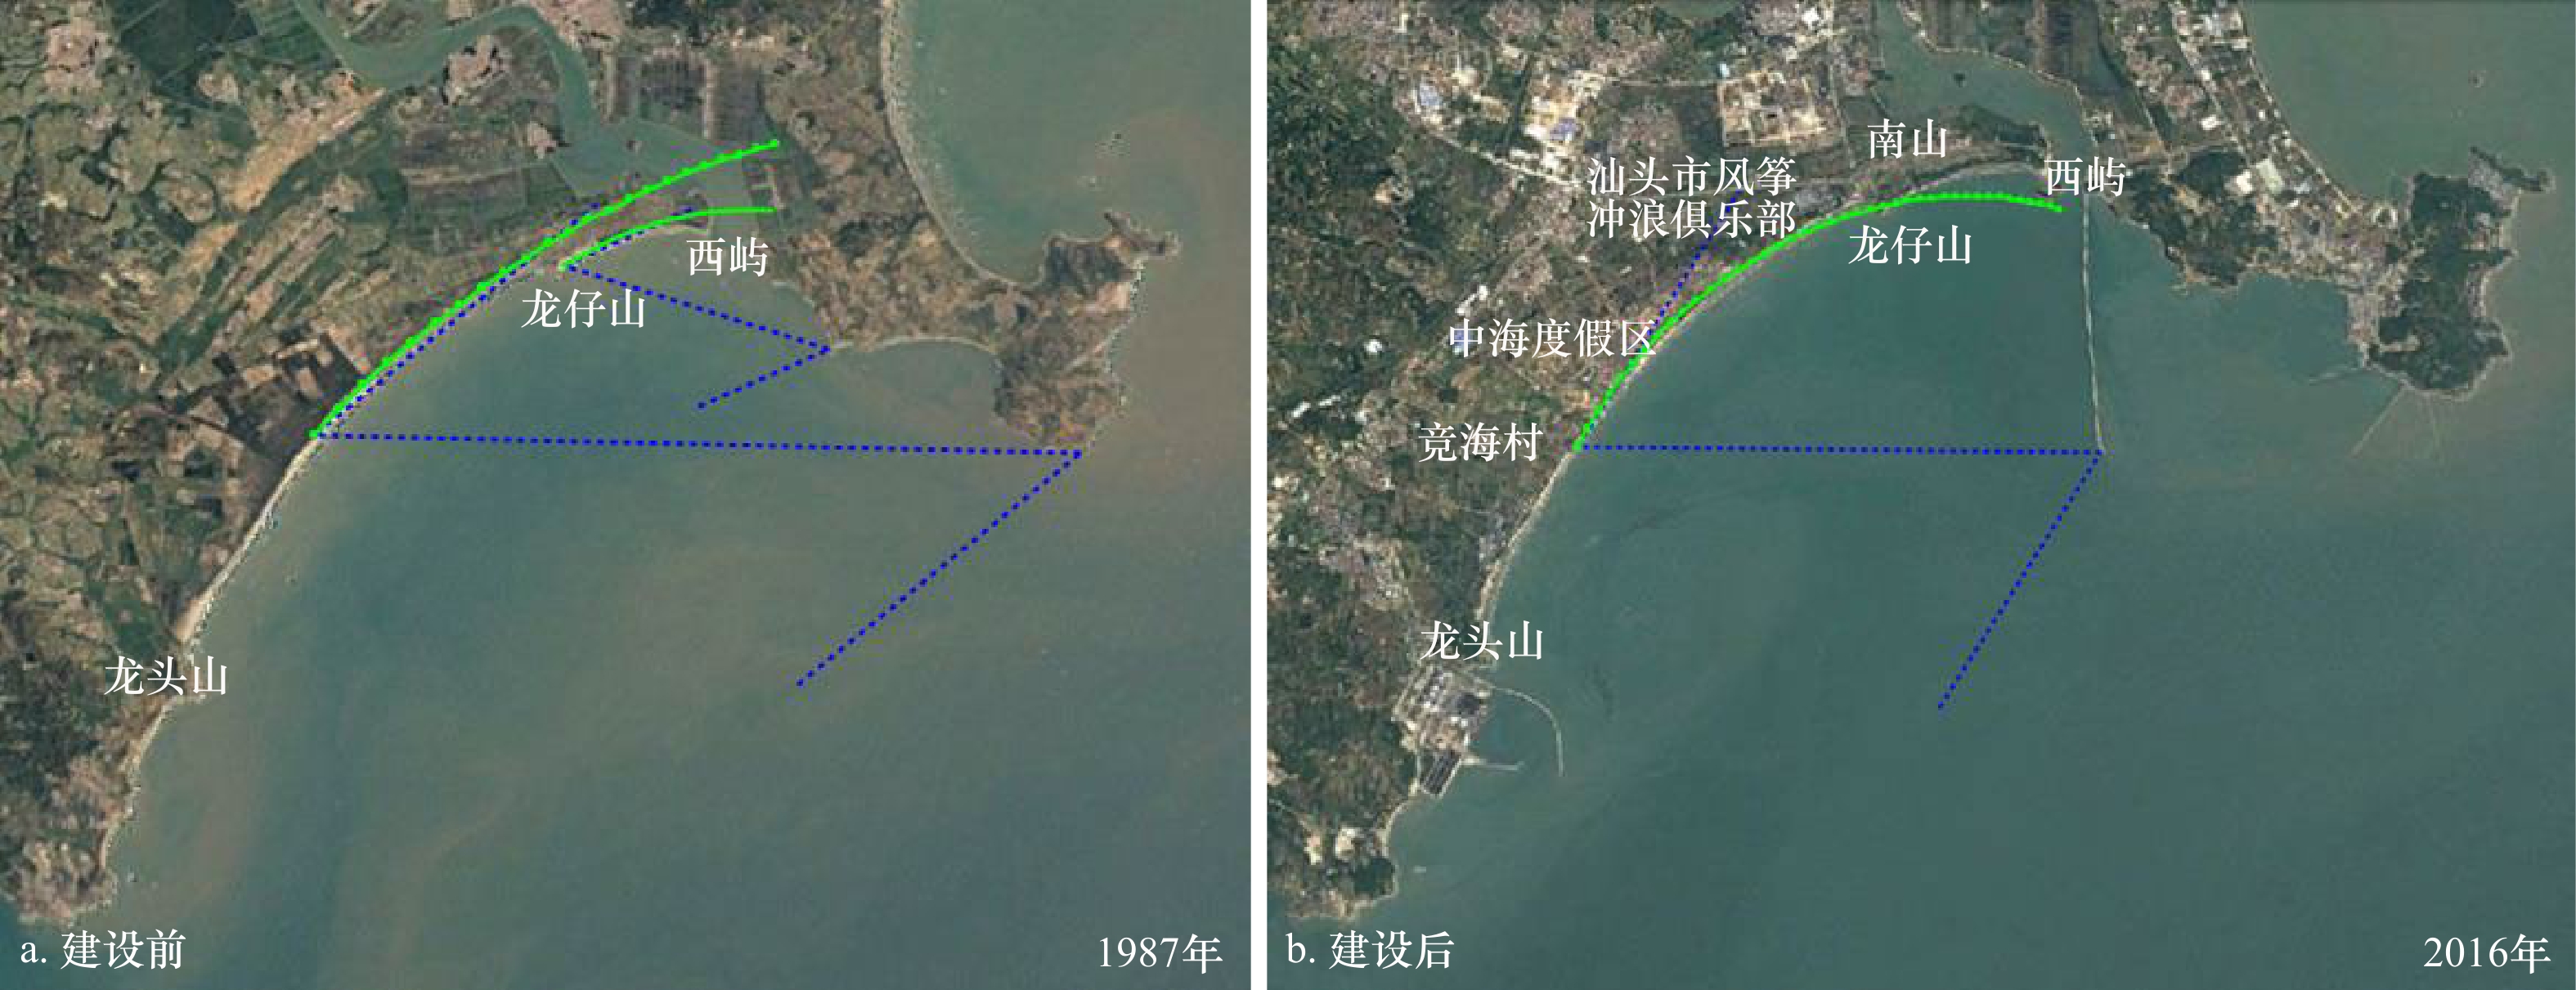
图 9 MEPBAY软件模拟东侧防波堤建设前后对海湾平衡平面形态的影响(a:动态平衡;b:不稳定)
Fig. 9 Modelling the impact of the absence and presence of the east breakwater on headland-bay equilibrium plan-form by the software of MEPBAY (a: dynamic equilibrium; b: unstable state)
表 1 企望湾潮间带海滩平均坡度和泥沙粒径的沿岸变化
Tab. 1 Longshore variation in average beach gradient and sediment size from the intertidal beach at the Qiwang Bay
剖面 西部海滩 东部海滩 P01 P02 P03 P04 P05 P06 P07 P08 P09 P10 P11 P12 上部坡度/(°) 7.1 4.8 4.6 3.1 1.8 2.2 2.0 9.1 7.5 6.3 2.7 2.8 下部坡度/(°) 6.2 5.9 3.4 2.0 1.2 1.2 1.3 7.2 4.8 4.2 2.3 1.6 上部粒径(Φ) 1.60 1.58 1.84 2.28 2.41 2.47 2.44 1.30 1.05 1.50 2.27 2.54 下部粒径(Φ) 1.50 1.48 1.98 2.20 2.29 2.42 2.32 1.44 1.43 1.56 2.32 2.53  下载: 导出CSV
表 2 近5年实测岸线位置数据和遥感岸线位置数据使用EPR和LRR方法计算的岸线变化速率值对比
Tab. 2 Comparison of the values of shoreline change rate by the methods of EPR and LRR using measured shoreline position data and remote sensing shoreline position data in recent five years
实测剖面 对应断面 实测岸线EPR值/(m·a−1) 遥感岸线EPR值/(m·a−1) 实测岸线LRR值/(m·a−1) 遥感岸线LRR值/(m·a−1) P01 T40 −1.15 −3.52 −1.65 −3.13 P02 T59 −0.20 −4.39 −0.65 −5.23 P03 T104 −0.50 0.44 −0.18 −0.30 P04 T122 2.80 5.24 3.02 5.83 P05 T138 7.98 10.05 7.80 8.66 P06 T153 17.70 26.52 17.73 19.48 P07 T167 21.20 30.88 21.30 25.41 P08 T173 −6.33 −9.50 −7.23 −9.23 P09 T182 0.05 1.18 −0.08 0.65 P10 T193 16.55 20.27 15.20 14.45 P11 T202 15.3 23.85 14.46 20.58 P12 T217 10.2 13.82 10.71 12.95
下载: 导出CSV
-
[1] Barnard P L, Short A D, Harley M D, et al. Coastal vulnerability across the Pacific dominated by El Niño/Southern Oscillation[J]. Nature Geoscience, 2015, 8(10): 801−807. doi: 10.1038/ngeo2539 [2] Carvalho B C, Dalbosco A L P, Guerra J V. Shoreline position change and the relationship to annual and interannual meteo-oceanographic conditions in Southeastern Brazil[J]. Estuarine, Coastal and Shelf Science, 2020, 235: 106582. doi: 10.1016/j.ecss.2020.106582 [3] Fenster M S, Dolan R, Elder J F. A new method for predicting shoreline positions from historical data[J]. Journal of Coastal Research, 1993, 9(1): 147−171. [4] 毋亭, 侯西勇. 海岸线变化研究综述[J]. 生态学报, 2016, 36(4): 1170−1182.Wu Ting, Hou Xiyong. Review of research on coastline changes[J]. Acta Ecologica Sinica, 2016, 36(4): 1170−1182. [5] Hapke C J, Reid D, Richmond B. Rates and trends of coastal change in California and the regional behavior of the beach and cliff system[J]. Journal of Coastal Research, 2009, 25(3): 603−615. [6] Kish S A, Donoghue J F. Coastal response to storms and sea-level rise: Santa Rosa Island, Northwest Florida, U. S. A.[J]. Journal of Coastal Research, 2013, SI(63): 131−140. [7] 丁小松, 单秀娟, 陈云龙, 等. 基于数字化海岸分析系统(DSAS)的海岸线变迁速率研究: 以黄河三角洲和莱州湾海岸线为例[J]. 海洋通报, 2018, 37(5): 565−575. doi: 10.11840/j.issn.1001-6392.2018.05.010Ding Xiaosong, Shan Xiujuan, Chen Yunlong, et al. Study on the change rate of shoreline based on digital coastal analysis system (DSAS): taking the shoreline of the Yellow River Delta and Laizhou Bay as an example[J]. Marine Science Bulletin, 2018, 37(5): 565−575. doi: 10.11840/j.issn.1001-6392.2018.05.010 [8] 沈昆明, 李安龙, 蒋玉波, 等. 基于数字岸线分析系统的海岸线时空变化速率分析—以海州湾为例[J]. 海洋学报, 2020, 42(5): 117−127.Shen Kunming, Li Anlong, Jiang Yubo, et al. Time-space velocity analysis of coastline based on digital shoreline analysis system: a case study of the Haizhou Bay[J]. Haiyang Xuebao, 2020, 42(5): 117−127. [9] Xu Nan. Detecting coastline change with all available Landsat data over 1986−2015: a case study for the State of Texas, USA[J]. Atmosphere, 2018, 9(3): 107. doi: 10.3390/atmos9030107 [10] Xu Nan, Gong Peng. Significant coastline changes in China during 1991−2015 tracked by Landsat data[J]. Science Bulletin, 2018, 63(14): 883−886. doi: 10.1016/j.scib.2018.05.032 [11] 张翔, 王霄鹏, 黄安齐, 等. 基于遥感影像提取山东半岛复杂海岸线及海岸线多年变迁研究[J]. 海洋湖沼通报, 2021, 43(2): 171−181.Zhang Xiang, Wang Xiaopeng, Huang Anqi, et al. Extraction of complex coastline feature and its multi-year changes in Shandong Peninsula based on remote sensing image[J]. Transactions of Oceanology and Limnology, 2021, 43(2): 171−181. [12] Benkhattab F Z, Hakkou M, Bagdanavičiūtė I, et al. Spatial-temporal analysis of the shoreline change rate using automatic computation and geospatial tools along the Tetouan Coast in Morocco[J]. Natural Hazards, 2020, 104(1): 519−536. doi: 10.1007/s11069-020-04179-2 [13] Fenster M, Dolan R. Large-scale reversals in shoreline trends along the U. S. mid-Atlantic Coast[J]. Geology, 1994, 22(6): 543−546. doi: 10.1130/0091-7613(1994)022<0543:LSRIST>2.3.CO;2 [14] 高义, 王辉, 苏奋振, 等. 中国大陆海岸线近30 a的时空变化分析[J]. 海洋学报, 2013, 35(6): 31−42.Gao Yi, Wang Hui, Su Fenzhen, et al. The analysis of spatial and temporal changes of the continental coastlines of China in recent three decades[J]. Haiyang Xuebao, 2013, 35(6): 31−42. [15] 徐进勇, 张增祥, 赵晓丽, 等. 2000−2012年中国北方海岸线时空变化分析[J]. 地理学报, 2013, 68(5): 651−660. doi: 10.11821/xb201305007Xu Jinyong, Zhang Zengxing, Zhao Xiaoli, et al. Spatial-temporal analysis of coastline changes in northern China from 2000 to 2012[J]. Acta Geographica Sinica, 2013, 68(5): 651−660. doi: 10.11821/xb201305007 [16] 刘百桥, 孟庆伟, 赵建华, 等. 中国大陆1990−2013年海岸线资源开发利用特征变化[J]. 自然资源学报, 2015, 30(12): 2033−2044. doi: 10.11849/zrzyxb.2015.12.006Liu Baiqiao, Meng Qingwei, Zhao Jianhua, et al. Variation of coastline resources utilization in China from 1990 to 2013[J]. Journal of Natural Resources, 2015, 30(12): 2033−2044. doi: 10.11849/zrzyxb.2015.12.006 [17] Hou Xiyong, Wu Ting, Hou Wan, et al. Characteristics of coastline changes in mainland China since the early 1940s[J]. Science China Earth Sciences, 2016, 59(9): 1791−1802. doi: 10.1007/s11430-016-5317-5 [18] 梁国雄. 汕头南部企望湾海岸地貌发育[J]. 热带海洋, 1986, 5(3): 33−41.Liang Guoxiong. Coast line development in the Qiwang Bay south of Shantou city[J]. Tropic Oceanology, 1986, 5(3): 33−41. [19] 李伯根, 谢钦春, 夏小明, 等. 企望湾砂质海滩剖面冲淤幅度的估算[J]. 东海海洋, 2002, 20(1): 20−27.Li Bogen, Xie Qinchun, Xia Xiaoming, et al. Assessment on the adjustable fluctuation between erosion and deposition on beach profile in sandy arc-shaped shore of the Qiwangwan Bay[J]. Donghai Marine Science, 2002, 20(1): 20−27. [20] 季荣耀, 罗章仁, 陆永军, 等. 广东省海岸侵蚀特征及主因分析[C]//第十四届中国海洋(岸)工程学术讨论会论文集(上册). 北京: 海洋出版社, 2009: 742−747.Ji Rongyao, Luo Zhangren, Lu Yongjun, et al. The characteristics and main causes of coastal erosion in Guangdong Province[C]//Proceedings of the 14th China Offshore Engineering Symposium (Volume I). Beijing: China Ocean Press, 2009: 742−747. [21] 自然资源部海洋预警监测司. 2020年中国海平面公报[R]. 北京: 自然资源部海洋预警监测司, 2021.Department of Marine Early Warning and Monitoring, Ministry of Natural Resources. 2020 China sea level bulletin[R]. Beijing: Department of Marine Early Warning and Monitoring, Ministry of Natural Resources, 2021. [22] 胡亚斌, 马毅, 孙伟富, 等. 基于多期遥感影像的砂质岸线提取方法——以海阳沙滩为例[J]. 海洋开发与管理, 2016, 33(5): 32−36, 49. doi: 10.3969/j.issn.1005-9857.2016.05.006Hu Yabin, Ma Yi, Sun Weifu, et al. A method of extracting sandy coastline based on multi-temporal images: a case in Haiyang Beach[J]. Ocean Development and Management, 2016, 33(5): 32−36, 49. doi: 10.3969/j.issn.1005-9857.2016.05.006 [23] Maiti S, Bhattacharya A K. Shoreline change analysis and its application to prediction: a remote sensing and statistics based approach[J]. Marine Geology, 2009, 257(1/4): 11−23. [24] Del Río L, Gracia F J, Benavente J. Shoreline change patterns in sandy coasts: A case study in SW Spain[J]. Geomorphology, 2013, 196: 252−266. doi: 10.1016/j.geomorph.2012.07.027 [25] Pajak M J, Leatherman S. The high water line as shoreline indicator[J]. Journal of Coastal Research, 2002, 18(2): 329−337. [26] Thieler E R, Himmelstoss E A, Zichichi J L, et al. The digital shoreline analysis system (DSAS) version 4.0—an ArcGIS extension for calculating shoreline change[R]. Woods Hole: U. S. Geological Survey, 2017: 49−50. [27] 魏凤英. 现代气候统计诊断与预测技术[M]. 2版. 北京: 气象出版社, 2007: 69−72.Wei Fengying. Modern Climate Statistics Diagnosis and Prediction Technology[M]. 2nd ed. Beijing: China Meteorological Press, 2007: 69−72. [28] 侯西勇, 毋亭, 王远东, 等. 20世纪40年代以来多时相中国大陆岸线提取方法及精度评估[J]. 海洋科学, 2014, 38(11): 66−73. doi: 10.11759/hykx20131217001Hou Xiyong, Wu Ting, Wang Yuandong, et al. Extraction and accuracy evaluation of multi-temporal coastlines of mainland China since 1940s[J]. Marine Sciences, 2014, 38(11): 66−73. doi: 10.11759/hykx20131217001 [29] da Fontoura Klein A H, Vargas A, Raabe A L A, et al. Visual assessment of bayed beach stability with computer software[J]. Computers & Geosciences, 2003, 29(10): 1249−1257. [30] Frazer L N, Genz A S, Fletcher C H. Toward parsimony in shoreline change prediction (Ⅰ): basis function methods[J]. Journal of Coastal Research, 2009, 25(2): 366−379. [31] Genz A S, Frazer L N, Fletcher C H. Toward parsimony in shoreline change prediction (Ⅱ): applying Basis function methods to real and synthetic data[J]. Journal of Coastal Research, 2009, 25(2): 380−392. -

计量
- 文章访问数: 799
- HTML全文浏览量: 366
- PDF下载量: 125
- 被引次数: 0
