

Study of ocean current at multiple time scales based on the high frequency surface wave radar
-
摘要: 近海海流受多种动力过程及岸线岛屿的作用呈现空间和时间尺度上的复杂变化,而地波雷达由于其探测面积广、时间分辨率高的特点成为研究这些变化的有效手段。本文利用舟山海域多年高频地波雷达资料,通过潮流调和分析、低通滤波和相关性分析对该海域海流潮周期、极端事件、季节、年际尺度的动力过程进行了解译。研究表明,舟山海域属于正规半日潮,潮流运动形式以顺时针旋转流为主,流速大小在空间上为东北方向较大,往西南方向逐渐减小,并在近岸处得到增强。余流的年际变化并不显著,但存在着明显的季节变化,例如冬季为南向流,流速减小,空间分布上近岸较外海大,而夏季与之反向,为北向流,流速较大,空间分布较为均匀。进一步分析了风与余流之间的相关性,在大风期间,风与余流的速度相关系数在0.48~0.90之间,方向相关系数在0.55~0.68之间。极端事件发生时,速度、方向的相关系数分别高达0.92与0.91。总体而言,通过分析高频地波雷达数据能够较好地反映舟山海域海流的时空特征,为海洋灾害监测和污染物、藻华的输运研究提供依据。Abstract: The coastal current presents complex changes in spatiotemporal scale due to various dynamic processes and shoreline islands. High frequency surface wave radar has become an effective method to solve these problems because of its wide coverage area and high temporal resolution. Several years ocean current data was collected in Zhoushan sea area, the dynamic processes of the ocean in tide cycle, extreme events, intermonth and interannual time scales in this area were interpreted by using tidal current harmonic analysis, low pass filtering and correlation analysis. The results depicted that the Zhoushan sea area is a regular semi-diurnal tide area, and the current movement is mainly in the form of rotating current. The distribution of current velocity in investigation area illustrated a decreasing trend from northeast to southwest. Interannual variation of residual current in the Zhoushan sea area is not significant, however the obvious intermonth variation characteristic of the residual current was detected. In winter, the flow is southward, and its larger near shore than outside sea. On the contrary, the flow velocity is stronger and the spatial distribution is more uniform in summer. The correlation between wind and residual current was analyzed, during strong winds, the correlation coefficient between wind speed and residual current velocity ranged from 0.48 to 0.90, and the correlation coefficient between wind direction and residual current direction ranged from 0.55 to 0.68. When extreme events occur, the correlation coefficients of velocity and direction are 0.92 and 0.91, respectively. By way of conclusion, the analysis of high frequency surface wave radar data can well reflect the temporal and spatial characteristics of ocean currents in Zhoushan sea area, which provide a basis for marine disaster monitoring, pollutants and algal bloom transport research.
-
Key words:
- ocean current /
- high frequency surface wave radar /
- multiple time scales /
- monsoon /
- correlation
-
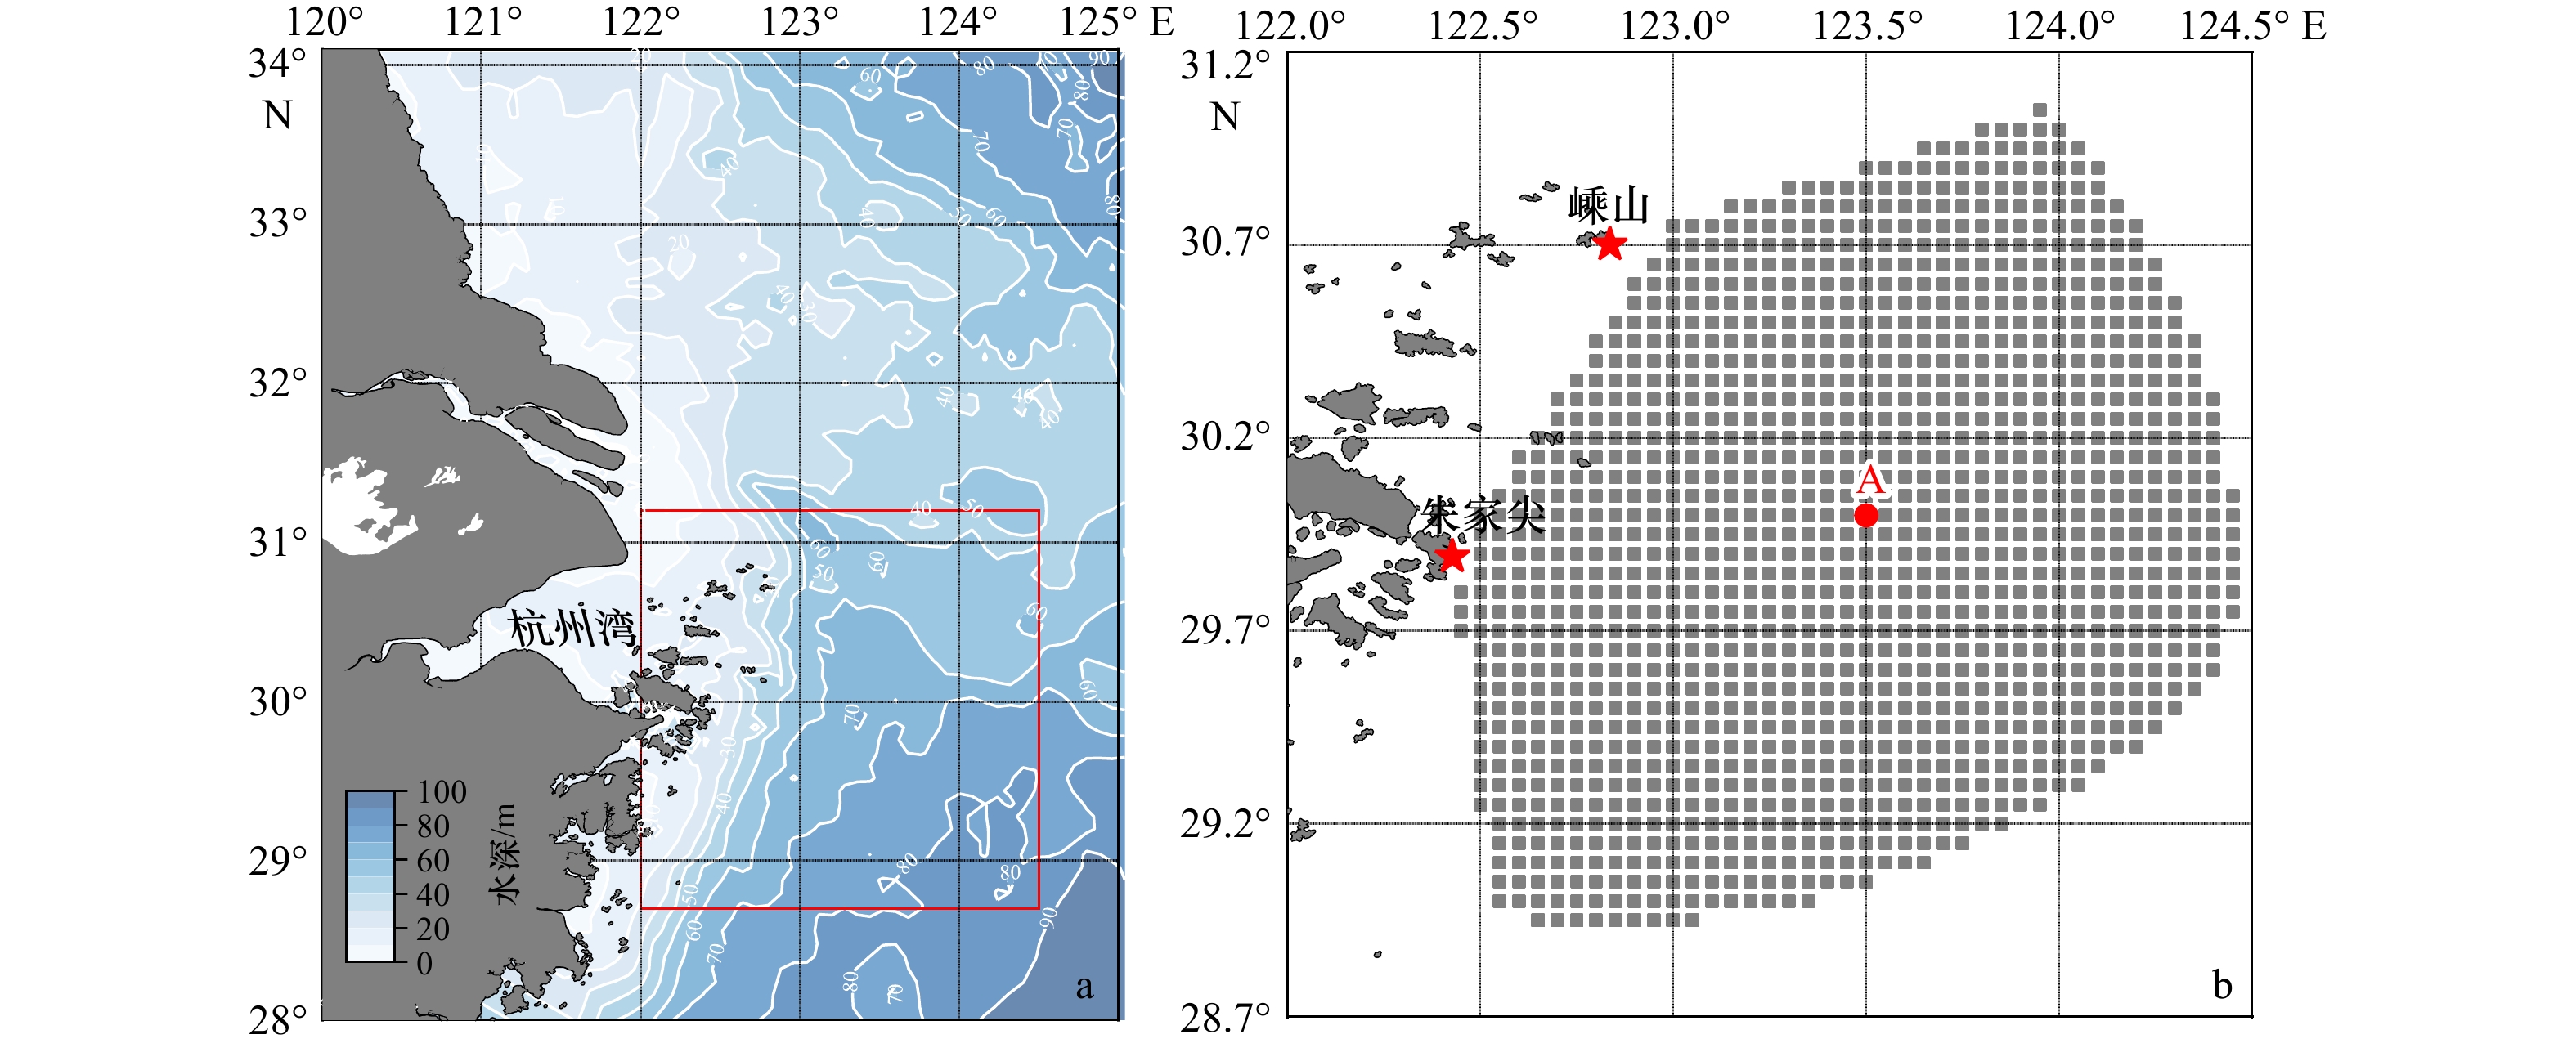
图 1 研究区域及舟山海域水深分布(a)和两个雷达观测站位置(b)
图a中红色矩形所选位置为地波雷达主要覆盖区;图b中朱家尖、嵊山分别为两个雷达观测站位置,灰色矩形块为雷达实际观测点位,站位A为雷达观测核心区内一点
Fig. 1 The study area and the water depth in the Zhoushan sea area (a) and two radar stations (b)
The selected position of the red rectangle in a is the main coverage area of the ground wave radar; in b, Zhujiajian and Shengshan are two radar stations, the gray blocks are the actual observation point of radar, station A is a point in the core area of radar observation
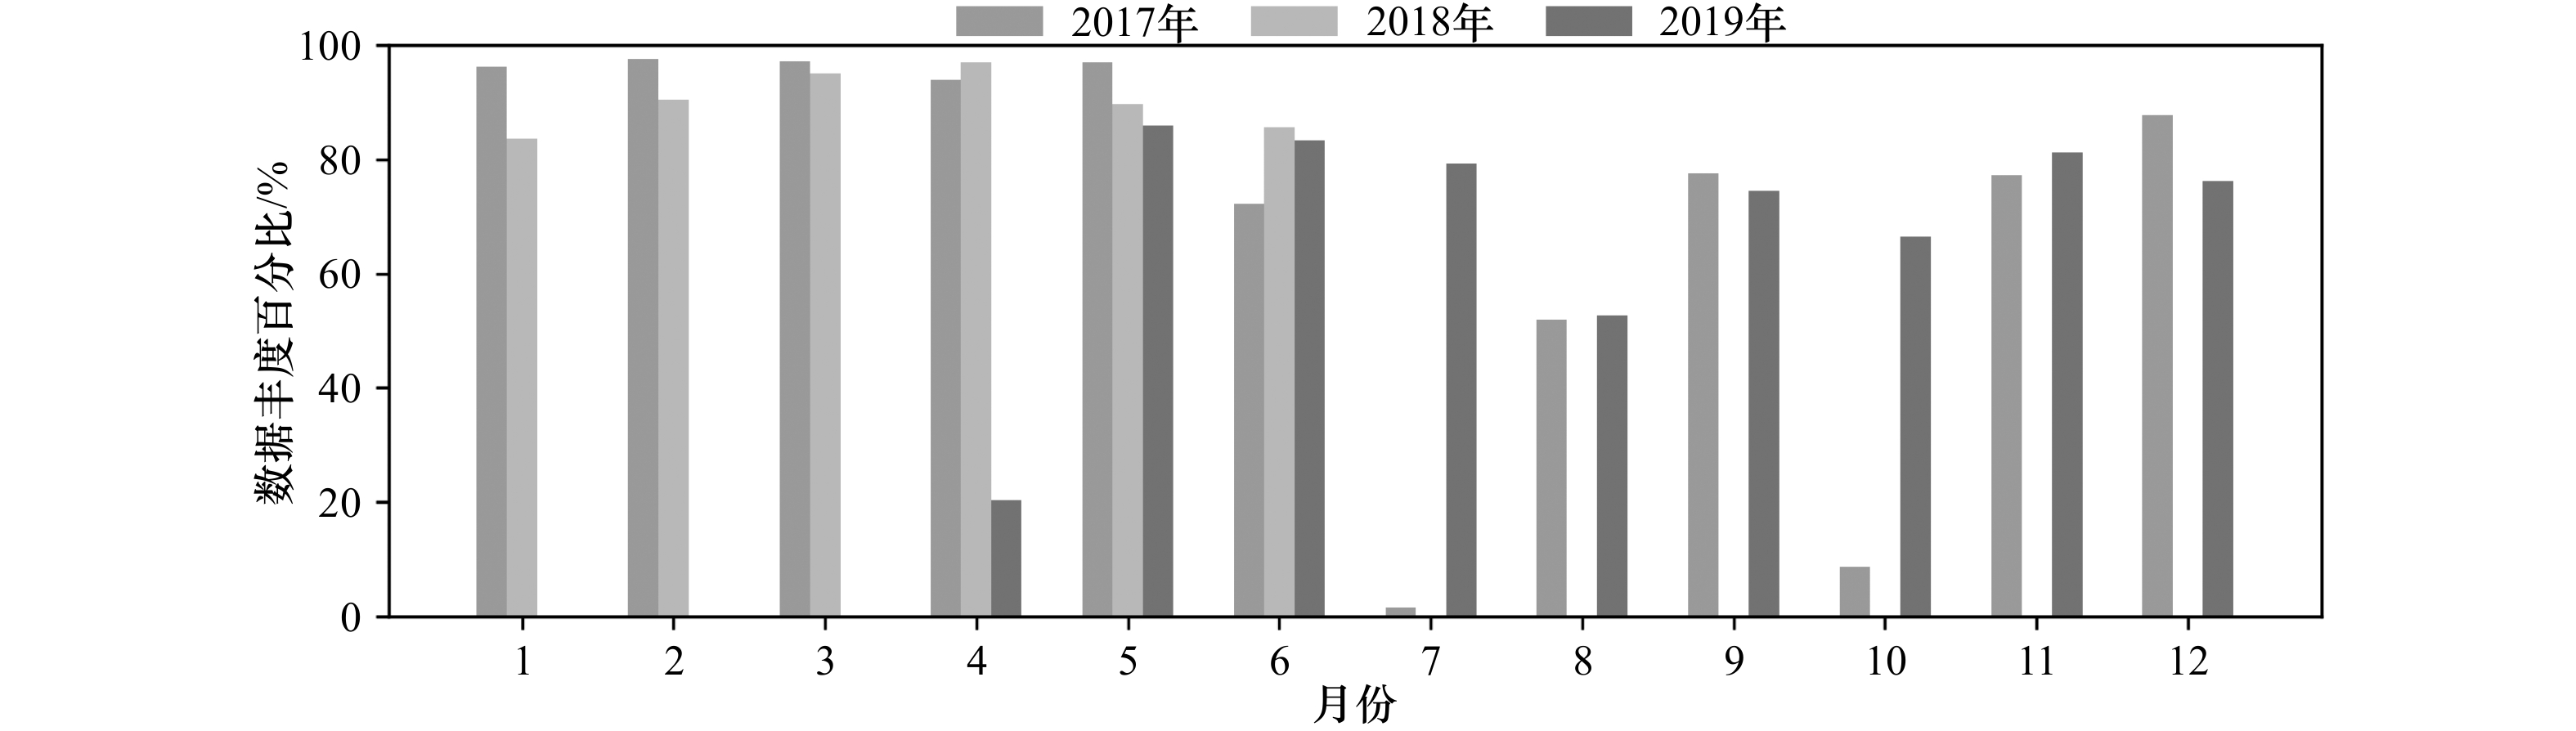
图 2 2017–2019年各月份数据丰度百分比
Fig. 2 Percentage of data available for each month of 2017, 2018 and 2019

图 3 质量控制前后数据丰度对比
a、b分别为质量控制前、后空间丰度,其中方块为雷达观测点位,颜色表示数据的丰度,黑色矩形位置为数据丰度大于60%的点位;c为质量控制前后每日的数据丰度对比
Fig. 3 Percentage of data available before and after quality control
a and b are the percentage of data available in space before and after quality control, the blocks are the radar observation point, the color represents the percentage of the data available, the black rectangular positions are the point where the data percentage are greater than 60%; c is percentage of data available per day before and after quality control
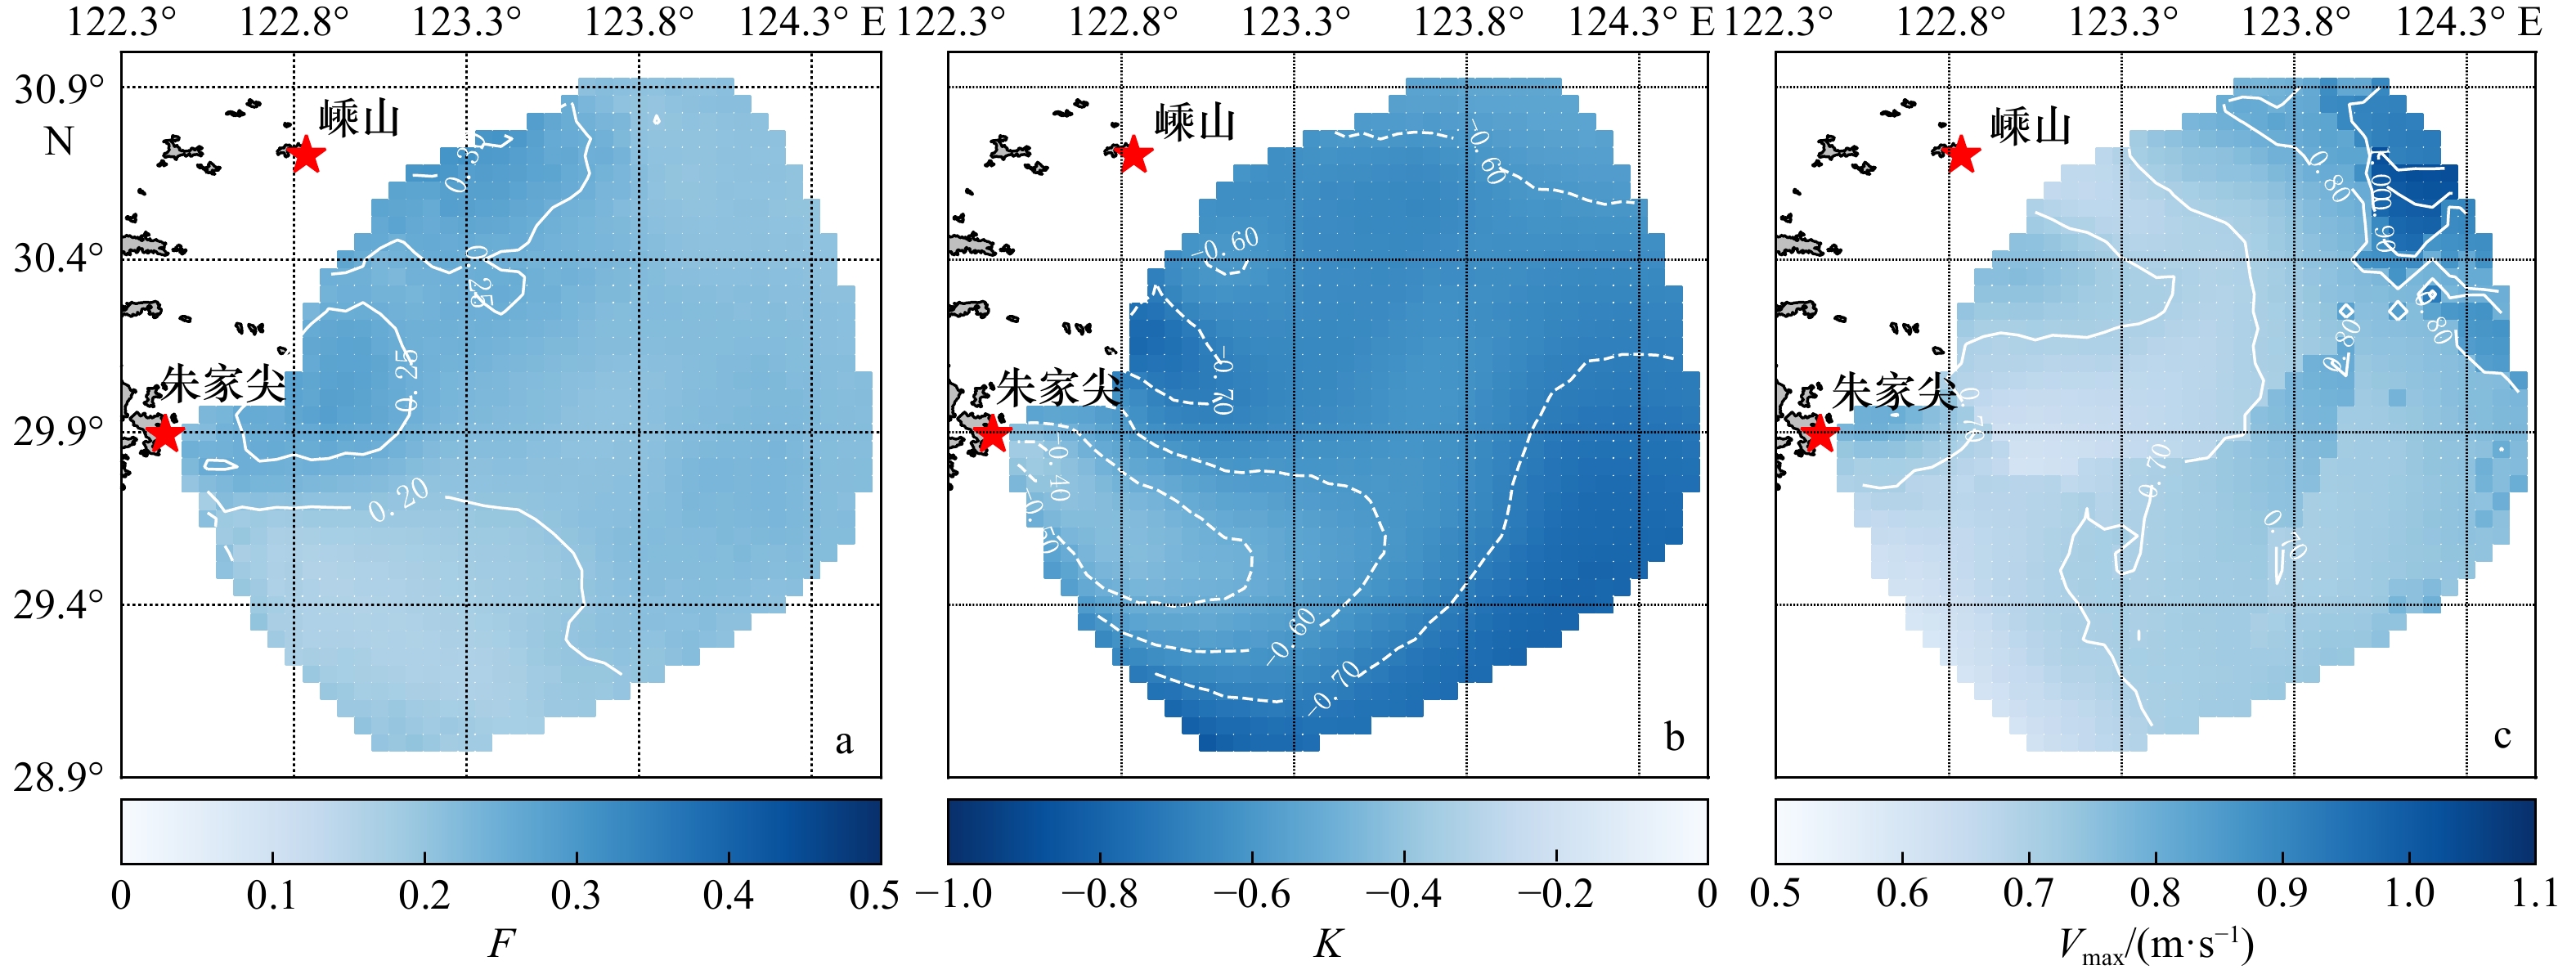
图 5 F值(a)、K值(b)和Vmax值(c)分布
Fig. 5 Distribution of F-value (a), K-value (b), and Vmax-value (b)
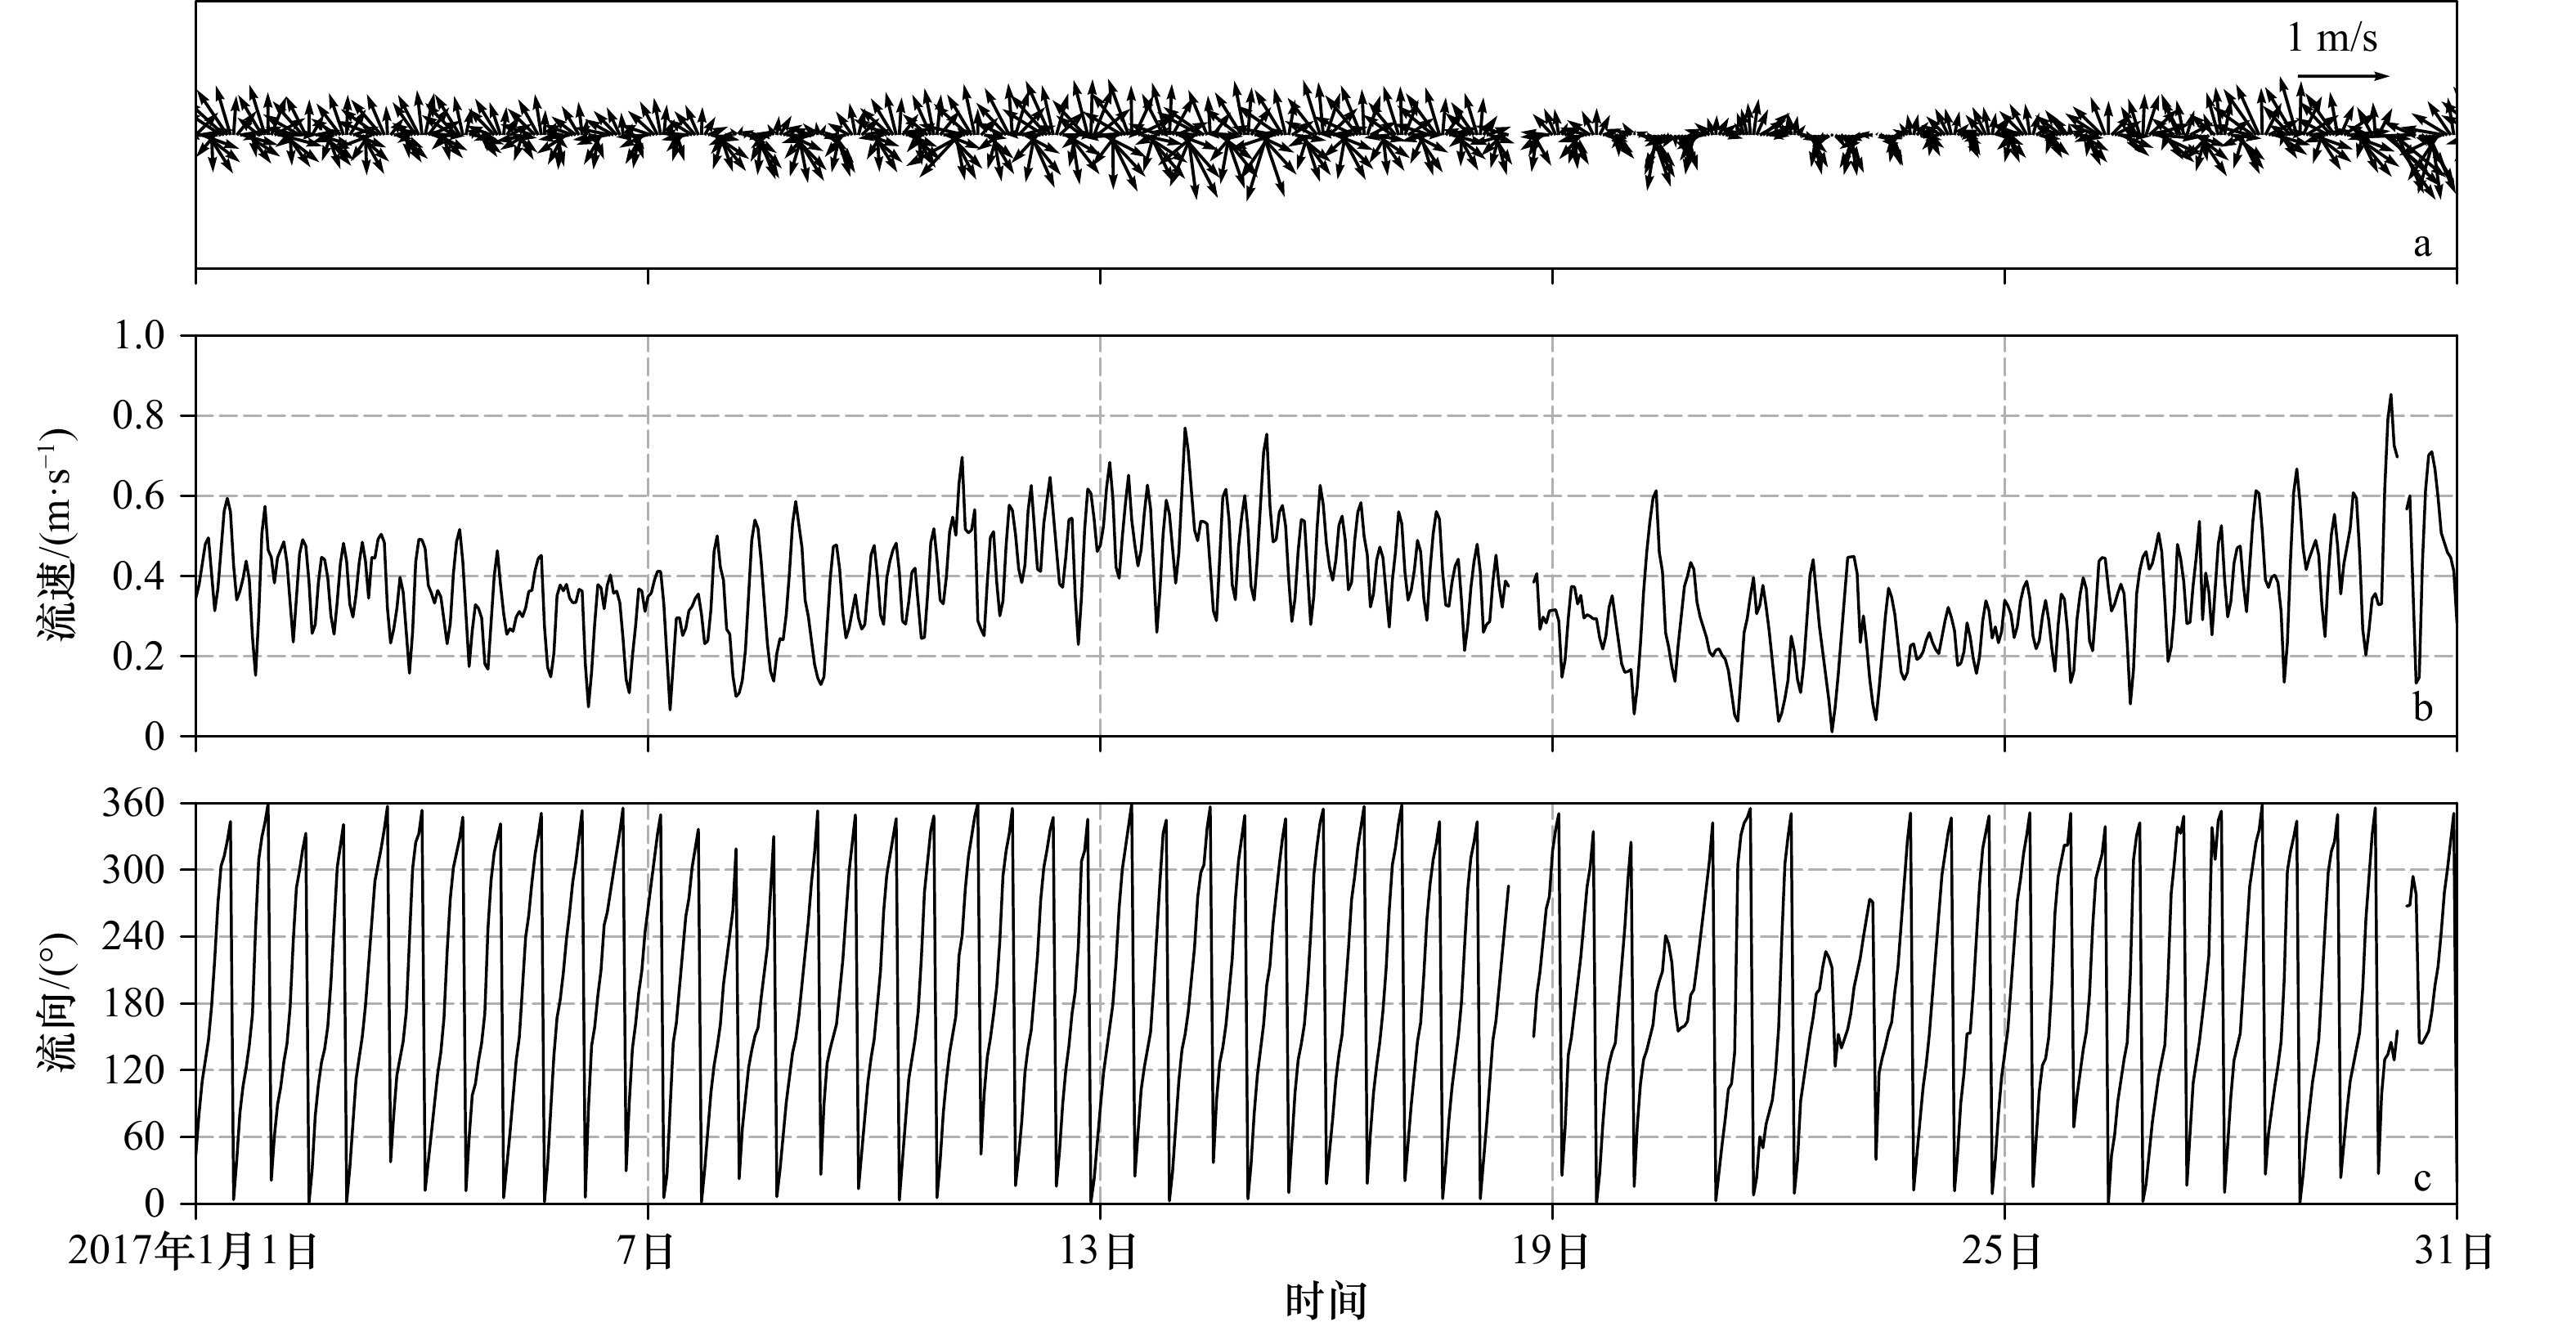
图 6 2017年1月流速矢量时间序列(a)、流速时间序列(b)和流向时间序列(c)
Fig. 6 Time series of tidal current vector (a), time series of tidal current velocity (b), and time series of tidal current direction (c) in January, 2017

图 7 各月平均余流与风场
蓝色箭头为风矢量,黑色箭头为余流;图中第一列到第三列分别为2017年、2018年和2019年;图a–c为冬季;图d–f为春季;图g–i为夏季;图j–l为秋季
Fig. 7 Average residual currents and wind fields for each month
The blue arrows are the wind vector and the black arrows are the residual current; the first to third columns in the figure are 2017, 2018 and 2019 respectively; winter: a–c; spring: d–f; summer: g–i; autumn: j–l

图 8 2017年与2019年秋季余流与风的时间序列对比和相关系数
T1–T4分别为2017年9月13–18日与21–25日,T5–T8分别为2019年9月6–10日与14–24日
Fig. 8 Time series comparison and correlation between the residual current and the wind in the autumn of 2017 and 2019
T1−T4 are September 13−18, 2017 and September 21−25, 2017, respectively; T5−T8 are September 6−10, 2019 and September 14−24, 2019, respectively
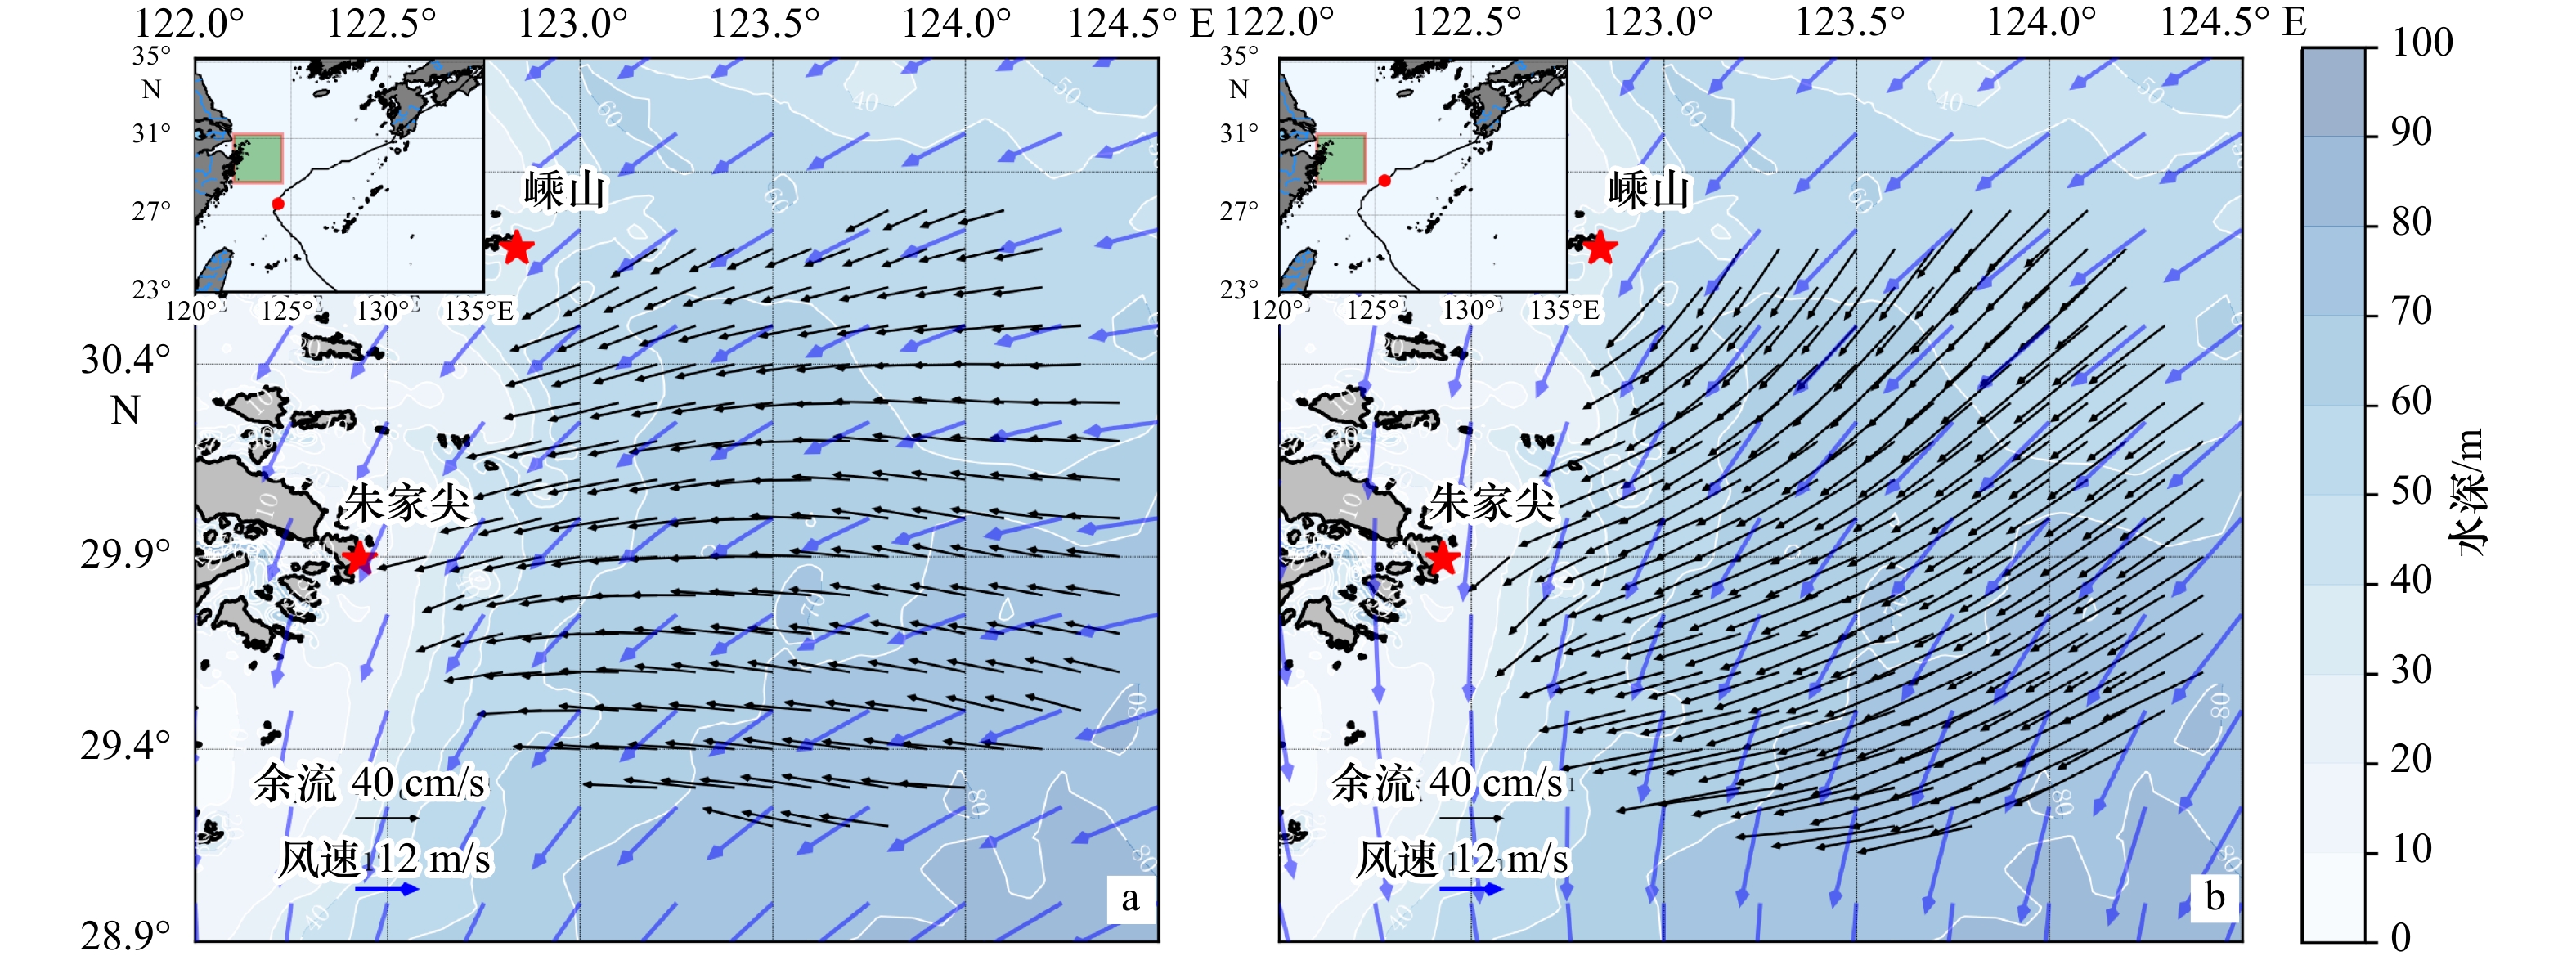
图 9 台风靠近与离开时刻余流场与风场
左上角小图中黑线为台风路径,红点为当前时刻台风位置,绿色矩形为研究区域;图a时刻为2017年7月15日0时,图b时刻为2017年7月16日0时
Fig. 9 The residual current and wind fields of the moment when the typhoon approach and leave
The black line in the upper left corner is the typhoon track, the red dot is the typhoon position at the current moment, the green rectangle is the study area; a is at 0:00 on July 15, 2017 and b is at 0:00 on July 16, 2017
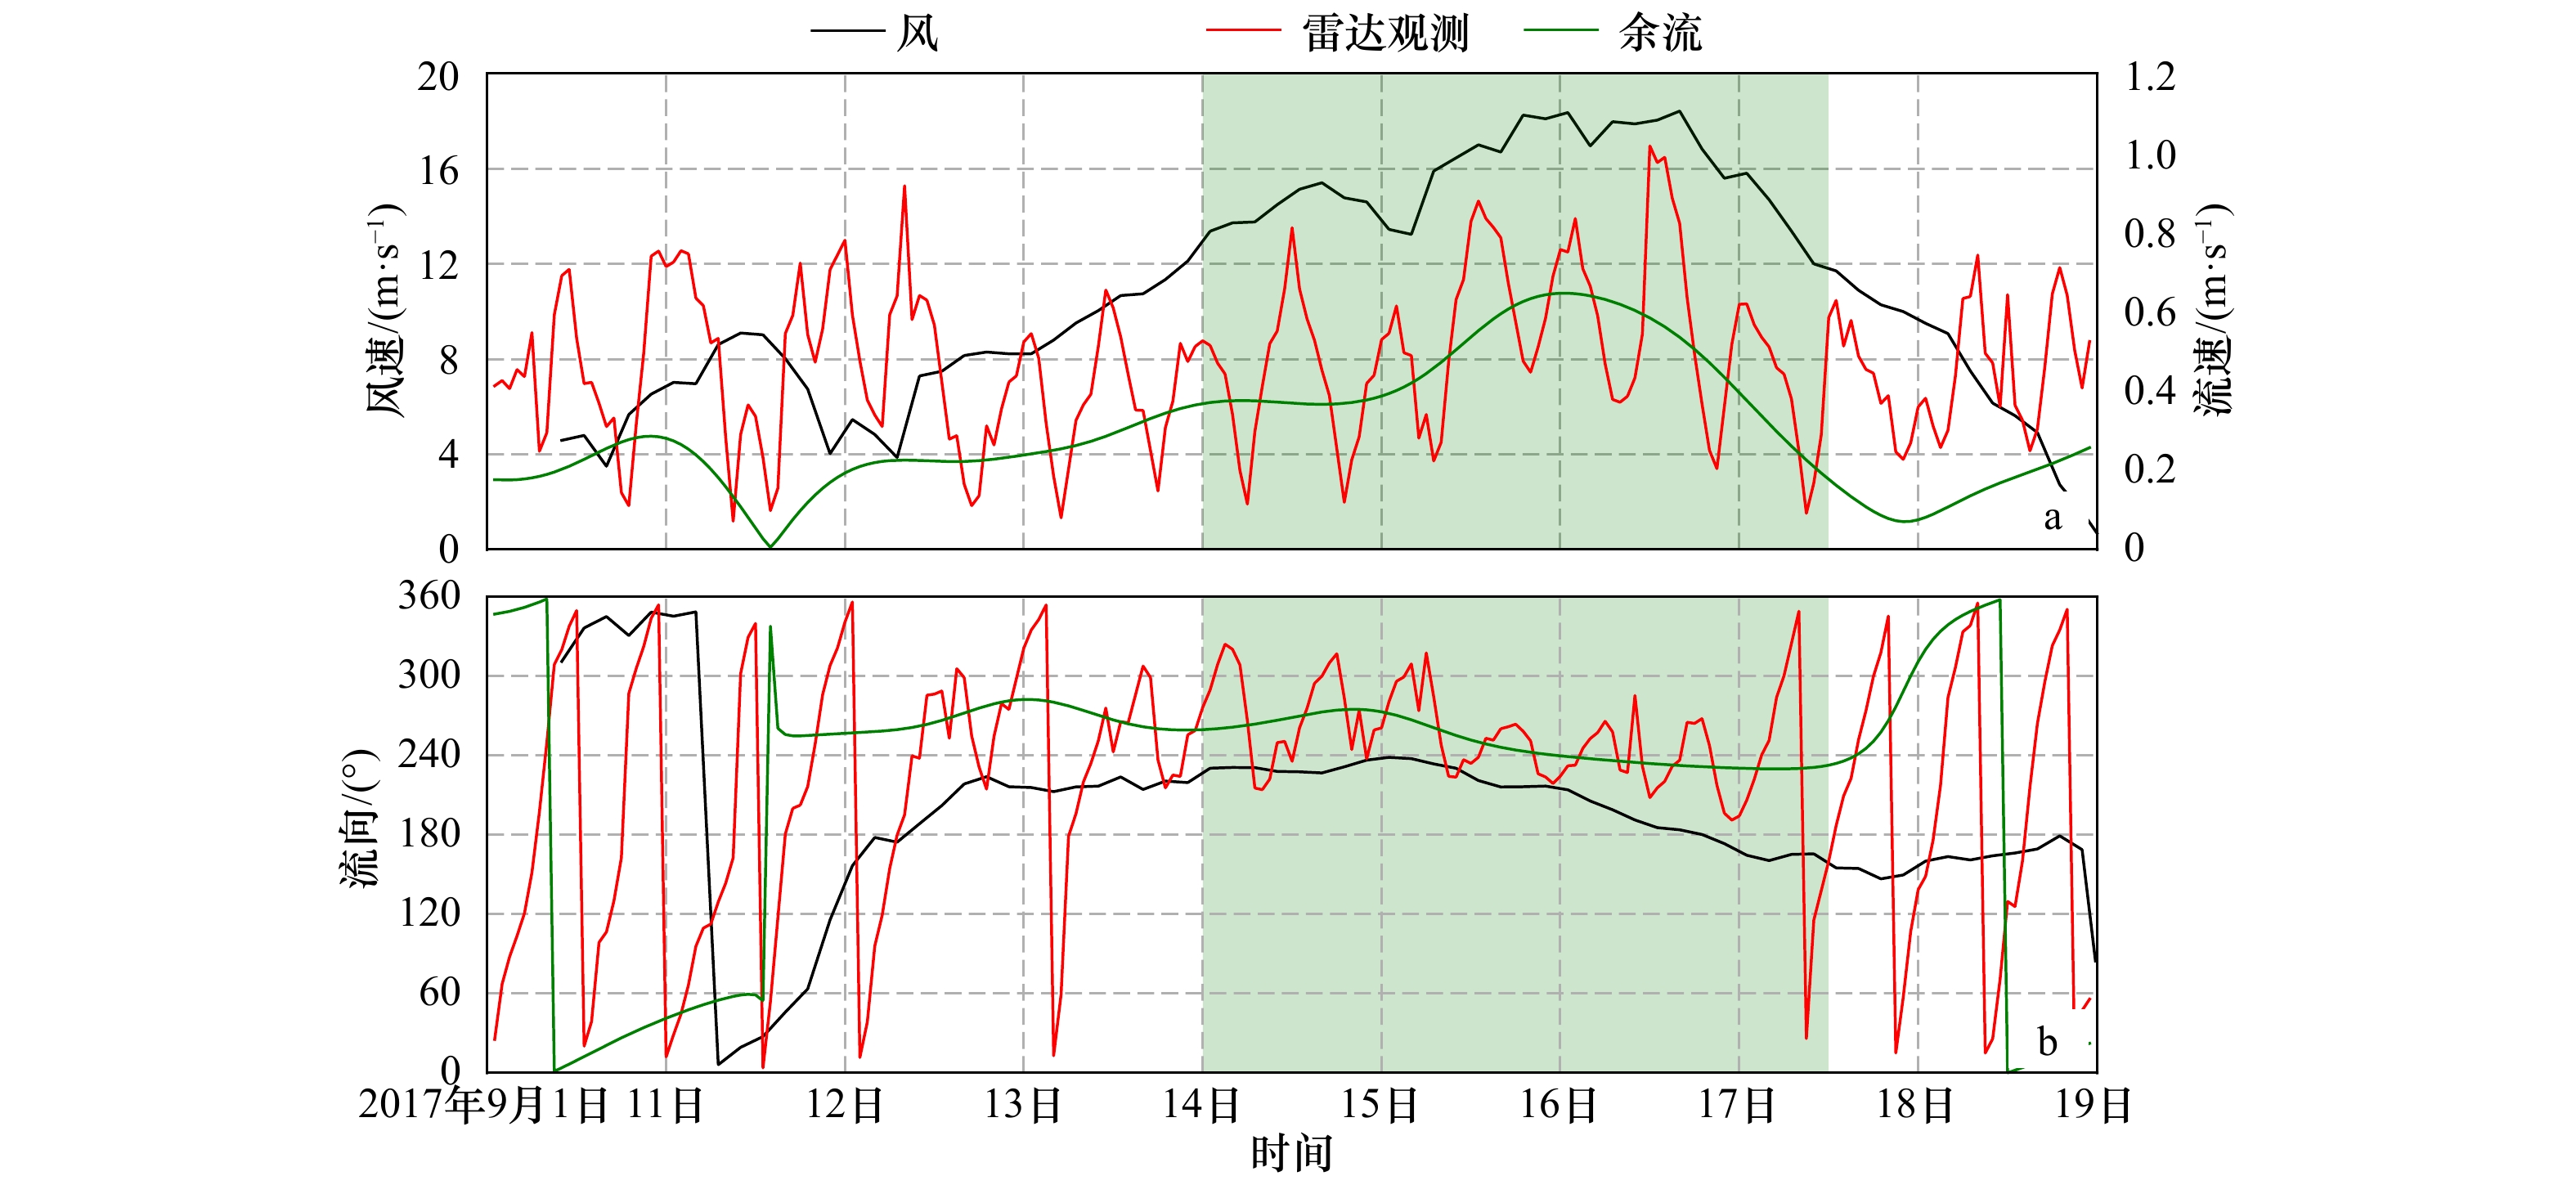
图 10 2017年9月风速、余流流速、实际流速对比(a)和风向、余流流向、实际流向对比(b)
绿色背景部分为台风作用最强烈时段
Fig. 10 Comparison of wind speed, residual current velocity, actual current velocity (a), and comparison of wind direction, residual current direction, actual direction (b) in September 2017
The green background part is the period during the typhoon is most powerful
表 1 大风时期风与余流相关性统计
Tab. 1 Correlation statistics between wind and residual currents during strong wind
时间 平均风向/(°) 平均流向/(°) 风向与流向相关系数 平均风速/m·s−1 平均流速/m·s−1 风速与流速相关系数 T1–T2 204.7 253.5 0.62 14.1 0.39 0.90 T3–T4 236.6 317.0 −0.02 7.0 0.12 0.55 T5–T6 167.4 189.4 0.68 9.6 0.30 0.48 T7–T8 196.2 244.0 0.55 10.8 0.27 0.78  下载: 导出CSV
-
[1] Klemas V. Remote sensing of coastal and ocean currents: an overview[J]. Journal of Coastal Research, 2012, 28(3): 576−586. doi: 10.2112/JCOASTRES-D-11-00197.1 [2] Paduan J D, Rosenfeld L K. Remotely sensed surface currents in Monterey Bay from shore-based HF radar (Coastal Ocean Dynamics Application Radar)[J]. Journal of Geophysical Research, 1996, 101(C9): 20669−20686. doi: 10.1029/96JC01663 [3] 侯杰昌, 吴世才, 杨子杰, 等. 海洋表面流的高频雷达遥感[J]. 地球物理学报, 1997, 40(1): 18−26. doi: 10.3321/j.issn:0001-5733.1997.01.003Hou Jiechang, Wu Shicai, Yang Zijie, et al. Remote sensing of ocean surface currents by HF radar[J]. Chinese Journal of Geophysics, 1997, 40(1): 18−26. doi: 10.3321/j.issn:0001-5733.1997.01.003 [4] Durand F, Shankar D, Birol F, et al. Spatiotemporal structure of the East India Coastal Current from satellite altimetry[J]. Journal of Geophysical Research, 2009, 114(C2): C02013. [5] Crocker R I, Matthews D K, Emery W J, et al. Computing coastal ocean surface currents from infrared and ocean color satellite imagery[J]. IEEE Transactions on Geoscience and Remote Sensing, 2007, 45(2): 435−447. doi: 10.1109/TGRS.2006.883461 [6] 翁怡婵, 石少华, 程祥圣, 等. “灿鸿”台风期间高频地波雷达数据分析[J]. 海洋科学进展, 2017, 35(4): 495−502. doi: 10.3969/j.issn.1671-6647.2017.04.006Weng Yichan, Shi Shaohua, Cheng Xiangsheng, et al. High frequency radar data analysis during Chan-Hom typhoon period[J]. Advances in Marine Science, 2017, 35(4): 495−502. doi: 10.3969/j.issn.1671-6647.2017.04.006 [7] Stewart R H, Joy J W. HF radio measurements of surface currents[J]. Deep Sea Research and Oceanographic Abstracts, 1974, 21(12): 1039−1049. doi: 10.1016/0011-7471(74)90066-7 [8] 沈志奔. 高频地波雷达海流应用研究[D]. 武汉: 武汉大学, 2014.Shen Zhiben. Applications of surface ocean currents measured by high frequency surface wave radar[D]. Wuhan: Wuhan University, 2014. [9] Rubio A, Mader J, Corgnati L, et al. HF Radar activity in European Coastal Seas: next steps toward a Pan-European HF Radar network[J]. Frontiers in Marine Science, 2017, 4: 8. [10] 孙芳, 刘玉红, 李佳讯. 高频地波雷达的发展与应用现状分析[J]. 海洋测绘, 2018, 38(4): 22−24,30. doi: 10.3969/j.issn.1671-3044.2018.04.004Sun Fang, Liu Yuhong, Li Jiaxun. Review of developments and applications status of high-frequency radar[J]. Hydrographic Surveying and Charting, 2018, 38(4): 22−24,30. doi: 10.3969/j.issn.1671-3044.2018.04.004 [11] Lipa B J, Barrick D E. Extraction of sea state from HF radar sea echo: mathematical theory and modeling[J]. Radio Science, 1986, 21(1): 81−100. doi: 10.1029/RS021i001p00081 [12] 周浩, 文必洋. 高频地波雷达生成海洋表面矢量流图[J]. 海洋与湖沼, 2002, 33(1): 1−7. doi: 10.3321/j.issn:0029-814X.2002.01.001Zhou Hao, Wen Biyang. Mapping ocean surface vector currents by dual HF ground wave radars[J]. Oceanologia et Limnologia Sinica, 2002, 33(1): 1−7. doi: 10.3321/j.issn:0029-814X.2002.01.001 [13] Chapman R D, Shay L K, Graber H C, et al. On the accuracy of HF radar surface current measurements: intercomparisons with ship-based sensors[J]. Journal of Geophysical Research, 1997, 102(C8): 18737−18748. doi: 10.1029/97JC00049 [14] Li Zhijin, Chao Yi, McWilliams J C, et al. A three-dimensional variational data assimilation scheme for the Regional Ocean Modeling System: implementation and basic experiments[J]. Journal of Geophysical Research, 2008, 113(C5): C05002. [15] Abascal A J, Castanedo S, Medina R, et al. Application of HF radar currents to oil spill modelling[J]. Marine Pollution Bulletin, 2009, 58(2): 238−248. doi: 10.1016/j.marpolbul.2008.09.020 [16] Ullman D S, O'Donnell J, Kohut J, et al. Trajectory prediction using HF radar surface currents: monte Carlo simulations of prediction uncertainties[J]. Journal of Geophysical Research, 2006, 111(C12): C12005. doi: 10.1029/2006JC003715 [17] 朱大勇, 李立, 李炎, 等. 台湾海峡西南部表层海流季节变化的地波雷达观测[J]. 科学通报, 2008, 53(15): 2385−2391.Zhu Dayong, Li Li, Li Yan, et al. Seasonal variation of surface currents in the southwestern Taiwan Strait observed with HF radar[J]. Chinese Science Bulletin, 2008, 53(15): 2385−2391. [18] Ebuchi N, Fukamachi Y, Ohshima K I, et al. Subinertial and seasonal variations in the Soya Warm Current revealed by HF ocean radars, coastal tide gauges, and bottom-mounted ADCP[J]. Journal of Oceanography, 2009, 65(1): 31−43. doi: 10.1007/s10872-009-0003-2 [19] Gough M K, Garfield N, McPhee-Shaw E. An analysis of HF radar measured surface currents to determine tidal, wind-forced, and seasonal circulation in the Gulf of the Farallones, California, United States[J]. Journal of Geophysical Research, 2010, 115(C4): C04019. [20] 王明筠. 雷达反演同化对台风蔷薇(2008)强度和路径预报影响及其机制研究[D]. 南京: 南京大学, 2014.Wang Mingjun. The impacts of assimilating retrieved winds from Doppler radar observations on the intensity and track forecasts of Typhoon Jangmi (2008) and its mechanisms[D]. Nanjing: Nanjing University, 2014. [21] 朱大勇. 高频地波雷达在近海区域的应用研究——以台湾海峡为例[D]. 厦门: 厦门大学, 2008.Zhu Dayong. Applications of high frequency ground wave radar to coastal ocean—a case study in the Taiwan Strait[D]. Xiamen: Xiamen University, 2008. [22] 李程, 李欢, 王慧, 等. 1509号台风灿鸿期间“朱家尖–嵊山”高频地波雷达数据分析[J]. 海洋学研究, 2017, 35(1): 41−46.Li Cheng, Li Huan, Wang Hui, et al. Data analysis of high frequency surface wave radar at Zhujiajian-Shengshan during Typhoon Chan-hom[J]. Journal of Marine Sciences, 2017, 35(1): 41−46. [23] 翁学传, 王从敏. 台湾暖流水的研究[J]. 海洋科学, 1985, 9(1): 7−10.Weng Xuechuan, Wang Congmin. A study on Taiwan warm current water[J]. Marine Sciences, 1985, 9(1): 7−10. [24] Pawlowicz R, Beardsley B, Lentz S. Classical tidal harmonic analysis including error estimates in MATLAB using T_TIDE[J]. Computers & Geosciences, 2002, 28(8): 929−937. [25] Beardsley R C, Mills C A, Rosenfeld L K, et al. CODE-1: moored array and large-scale data report[R]. Woods Hole Oceanographic Institution, 1983. [26] 中华人民共和国交通部. 港口工程技术规范(上册)[M]. 北京: 人民出版社, 1988.Ministry of Transport of the People’s Republic of China. Technical Specification for Port Engineering (Vol. 1)[M]. Beijing: People's Publishing House, 1988. [27] 费岳军, 史军强, 堵盘军, 等. 冬季舟山外海定点实测海流资料分析[J]. 海洋通报, 2013, 32(6): 648−656. doi: 10.11840/j.issn.1001-6392.2013.06.007Fei Yuejun, Shi Junqiang, Du Panjun, et al. Analysis of the mooring current data near Zhoushan Islands[J]. Marine Science Bulletin, 2013, 32(6): 648−656. doi: 10.11840/j.issn.1001-6392.2013.06.007 [28] 陈倩, 黄大吉, 章本照, 等. 浙江近海潮流和余流的特征[J]. 东海海洋, 2003, 21(4): 1−14.Chen Qian, Huang Daji, Zhang Benzhao, et al. Characteristics of the tidal current and residual current in the seas adjacent to Zhejiang[J]. Donghai Marine Science, 2003, 21(4): 1−14. [29] 何海丰, 杨世伦, 张朝阳, 等. 朱家尖岛邻近海域潮流时空变化及其影响因素[J]. 上海国土资源, 2013, 34(1): 27−31,59.He Haifeng, Yang Shilun, Zhang Zhaoyang, et al. Spatial and temporal variations in tidal currents around Zhujiajian Island[J]. Shanghai Land & Resources, 2013, 34(1): 27−31,59. [30] Su Yusong, Weng Xuechuan. Water masses in China Seas[M]//Zhou Di, Liang Yuanbo, Zeng Chengkui. Oceanology of China Seas. Dordrecht: Springer, 1994: 3−16. [31] 陈金瑞, 李雪丁, 郭民权, 等. 平潭海域定点实测海流资料分析[J]. 海洋预报, 2016, 33(4): 46−52. doi: 10.11737/j.issn.1003-0239.2016.04.006Chen Jinrui, Li Xueding, Guo Minquan, et al. Analysis of the observed current data near Pingtan islands[J]. Marine Forecasts, 2016, 33(4): 46−52. doi: 10.11737/j.issn.1003-0239.2016.04.006 [32] Ekman V W. On the influence of the earth's rotation on ocean-currents[J]. Arkiv foer Matematik, Astronomi, och Fysik, 1905, 2(11): 1−52. -


计量
- 文章访问数: 971
- HTML全文浏览量: 343
- PDF下载量: 80
- 被引次数: 0
