Research on outlier detection in marine magnetic data based on Hampel Filtering
-
摘要: 海洋磁测数据易受导航误差、仪器故障及人工记录错误等因素干扰,导致异常值频现。这些异常值不仅扭曲磁异常形态,还会破坏磁条带的连续性,严重影响数据质量及后续解释的可靠性。因此,异常值的检测与去除是海洋磁测数据处理中的关键环节。然而,传统方法难以有效区分不同类型的异常值,尤其是上下文异常值,且人工检测既耗时又易产生误判,效率较低。针对这一问题,本研究提出了一种基于局部中位数加权策略的自适应Hampel滤波方法。该方法通过动态调整数据点权重,能够更精准地识别和去除海洋磁测数据中的异常值,尤其在数据分布异质性较大的区域表现优异。与自回归模型、孤立森林及自编码器等传统方法相比,加权Hampel滤波器不仅能够有效检测并去除全局异常值和上下文异常值,还能更好地保留数据的原始特征,显著提升了检测精度。在对中西太平洋麦哲伦海隆地区实测数据的验证中,加权Hampel滤波器的F1分数始终领先于其他方法,证明其在异常值检测中的优越性。该方法为提升海洋磁测数据质量及可解释性提供了重要技术支持,并为未来大规模数据的自动化处理奠定基础。Abstract: Marine magnetic data are susceptible to interference from factors such as navigation errors, instrument malfunctions, and transcript mistakes, leading to frequent outliers. These outliers not only distort the magnetic anomaly patterns but also disrupt the continuity of magnetic stripes, severely affecting data quality and the reliability of subsequent interpretations. Therefore, outlier detection and removal are crucial steps in marine magnetic data processing. However, traditional methods often fail to effectively distinguish between different types of outliers, especially contextual outliers. Additionally, manual detection is time-consuming, prone to errors, and inefficient. To address this issue, this study proposes a weighted Hampel filter based on a local median weighting strategy. This method dynamically adjusts the weights of data points to more accurately identify and remove outliers in marine magnetic data, especially performing well in regions with significant data heterogeneity. Compared to other methods such as autoregression, isolation forest, and autoencoder, weighted Hampel filter not only effectively detects and removes global and contextual outliers but also better preserves the original features of the data, significantly improving detection accuracy. In validation with real data from the Magellan Rise in the Central Pacific Ocean, weighted Hampel filter consistently achieved higher F1 scores than other methods, demonstrating its superiority in outlier detection. This method provides important technical support for improving the quality and interpretability of marine magnetic data and lays a foundation for the future automated processing of large-scale data.
-
Key words:
- marine magnetics /
- marine magnetic data processing /
- outlier detection /
- hampel filter
-
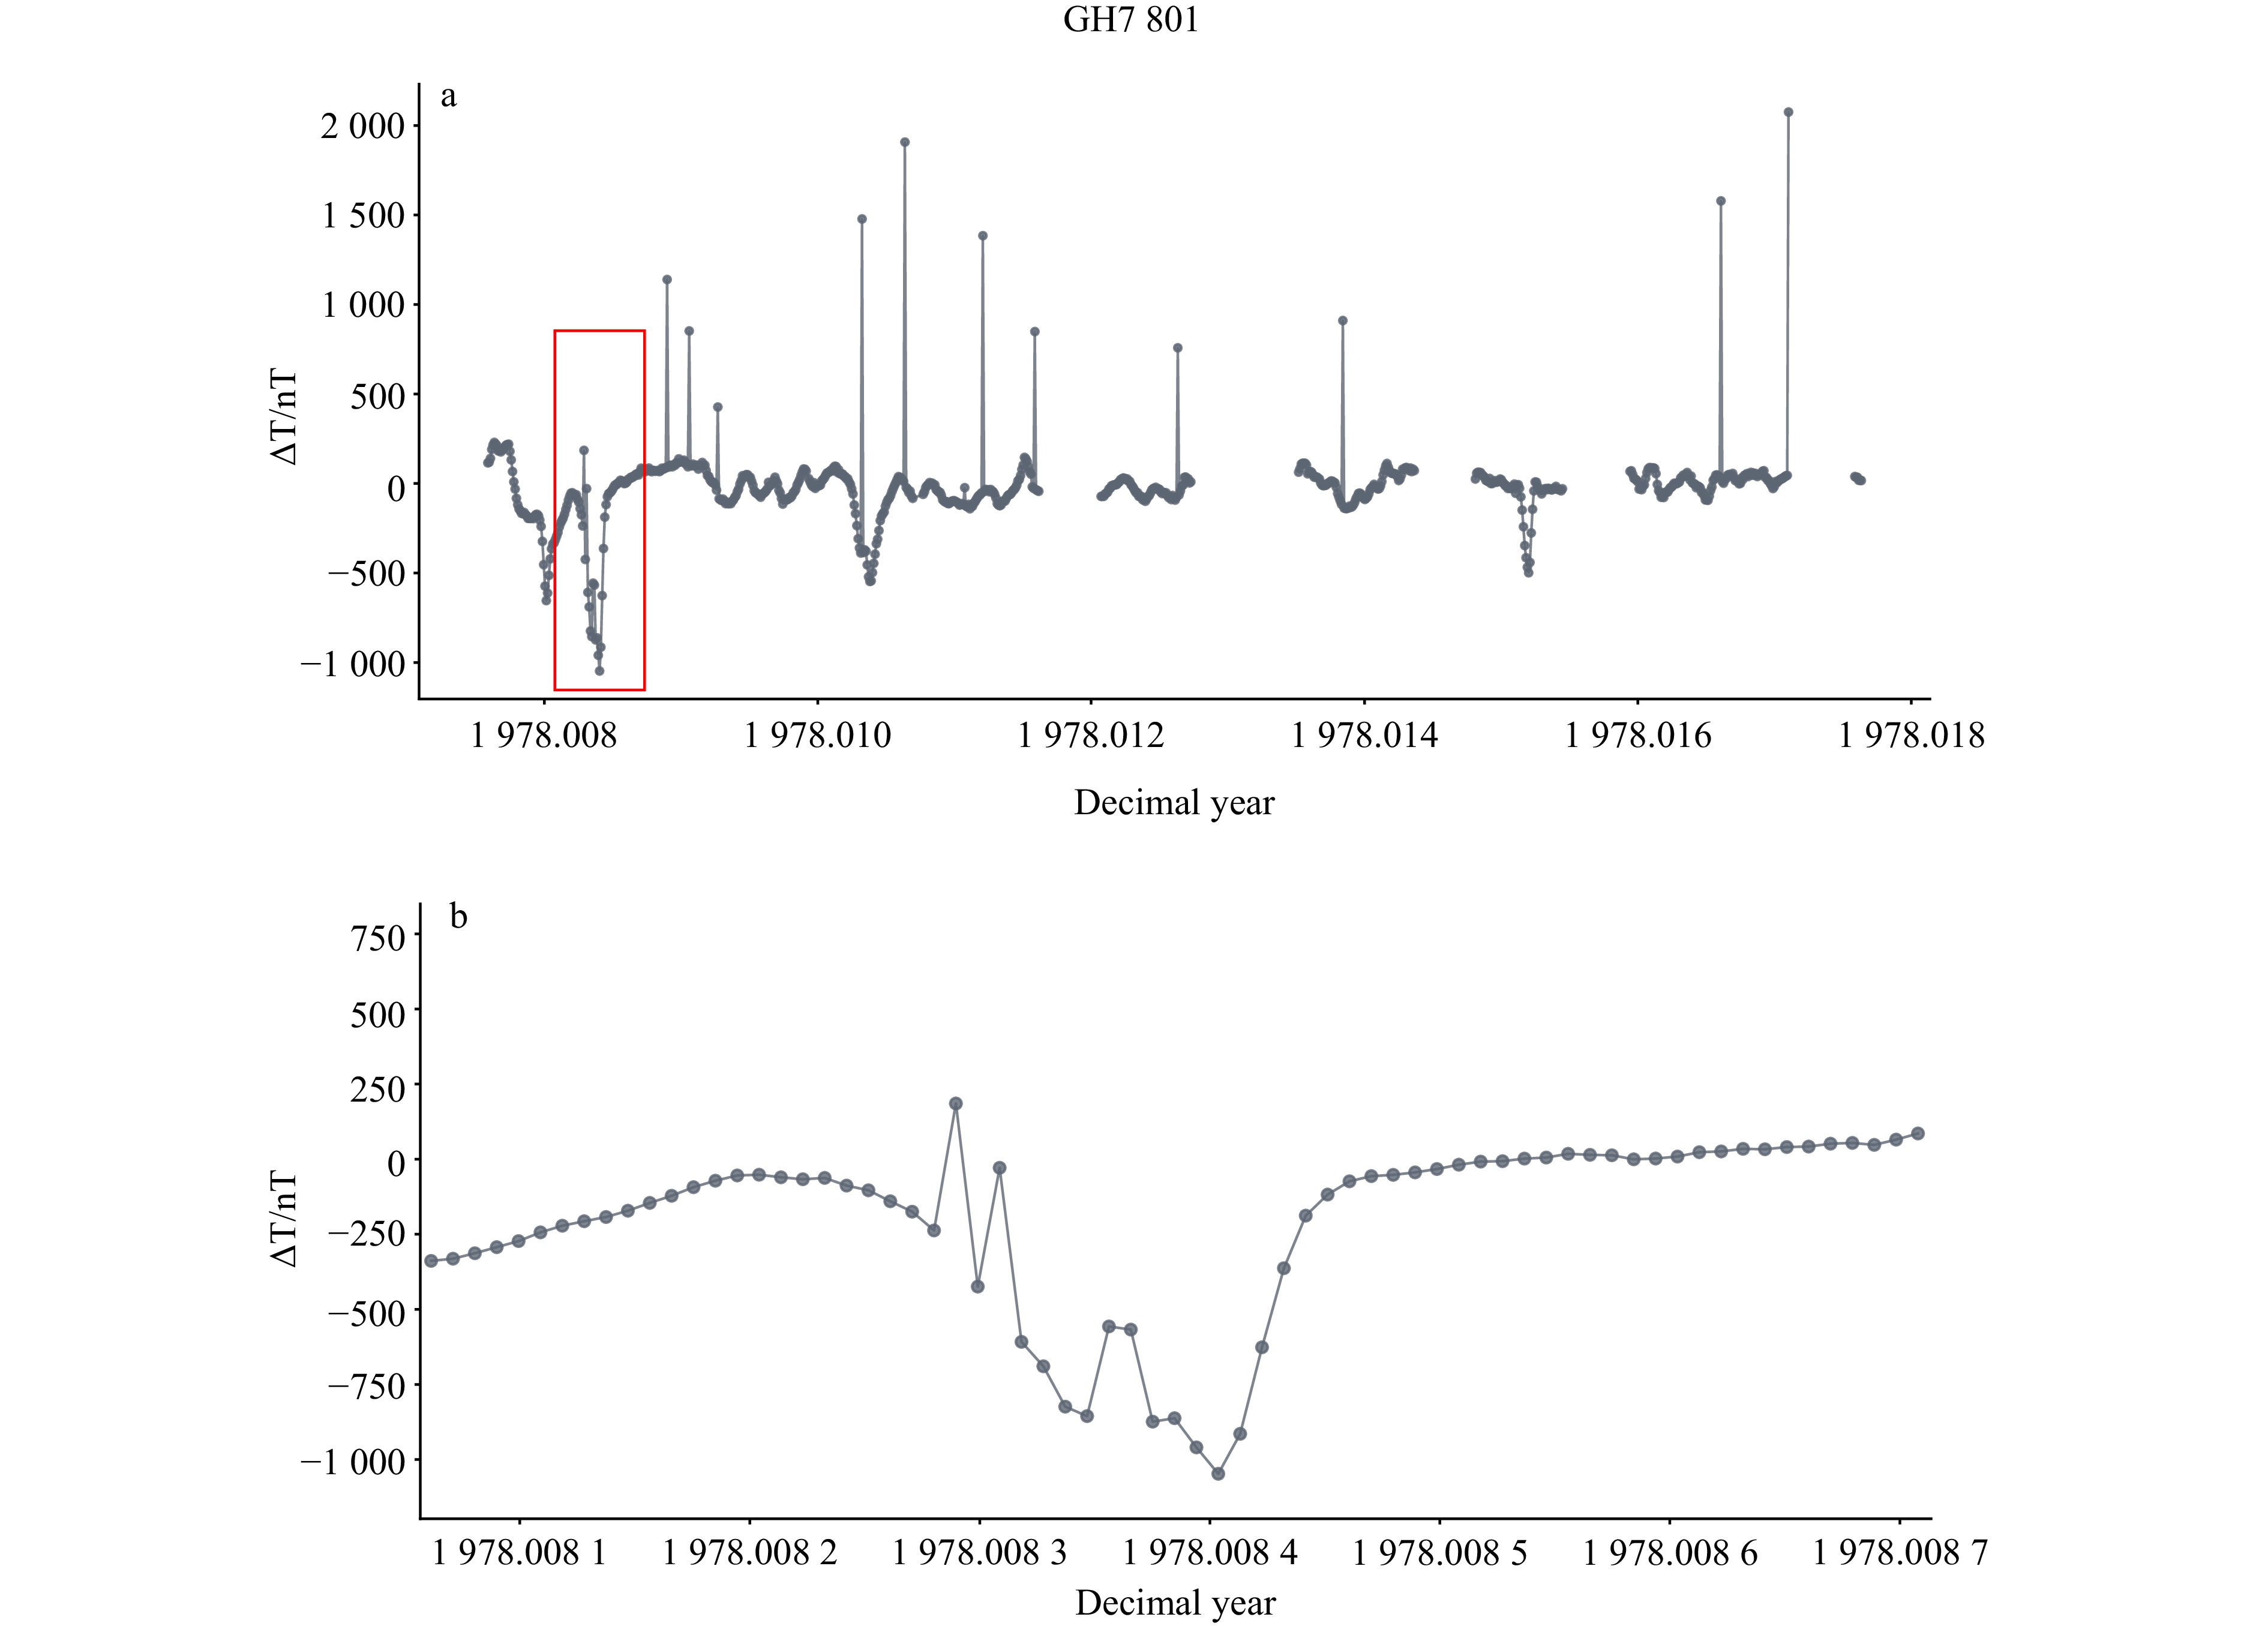
图 2 GH7801航次海洋磁测磁异常数据分布
a) 包含显而易见的全局异常值的原始磁异常数据,图2a中的矩形指示图2b中的放大范围;b)图2a中矩形区域的细节展示
Fig. 2 Distribution of marine magnetic anomaly data from the GH7801 survey
a) Original magnetic anomaly data containing obvious global outliers, with the rectangle in Figure 2a indicating the zoomed-in region shown in Figure 2b; b) Detailed view of the rectangular region in Figure 2a
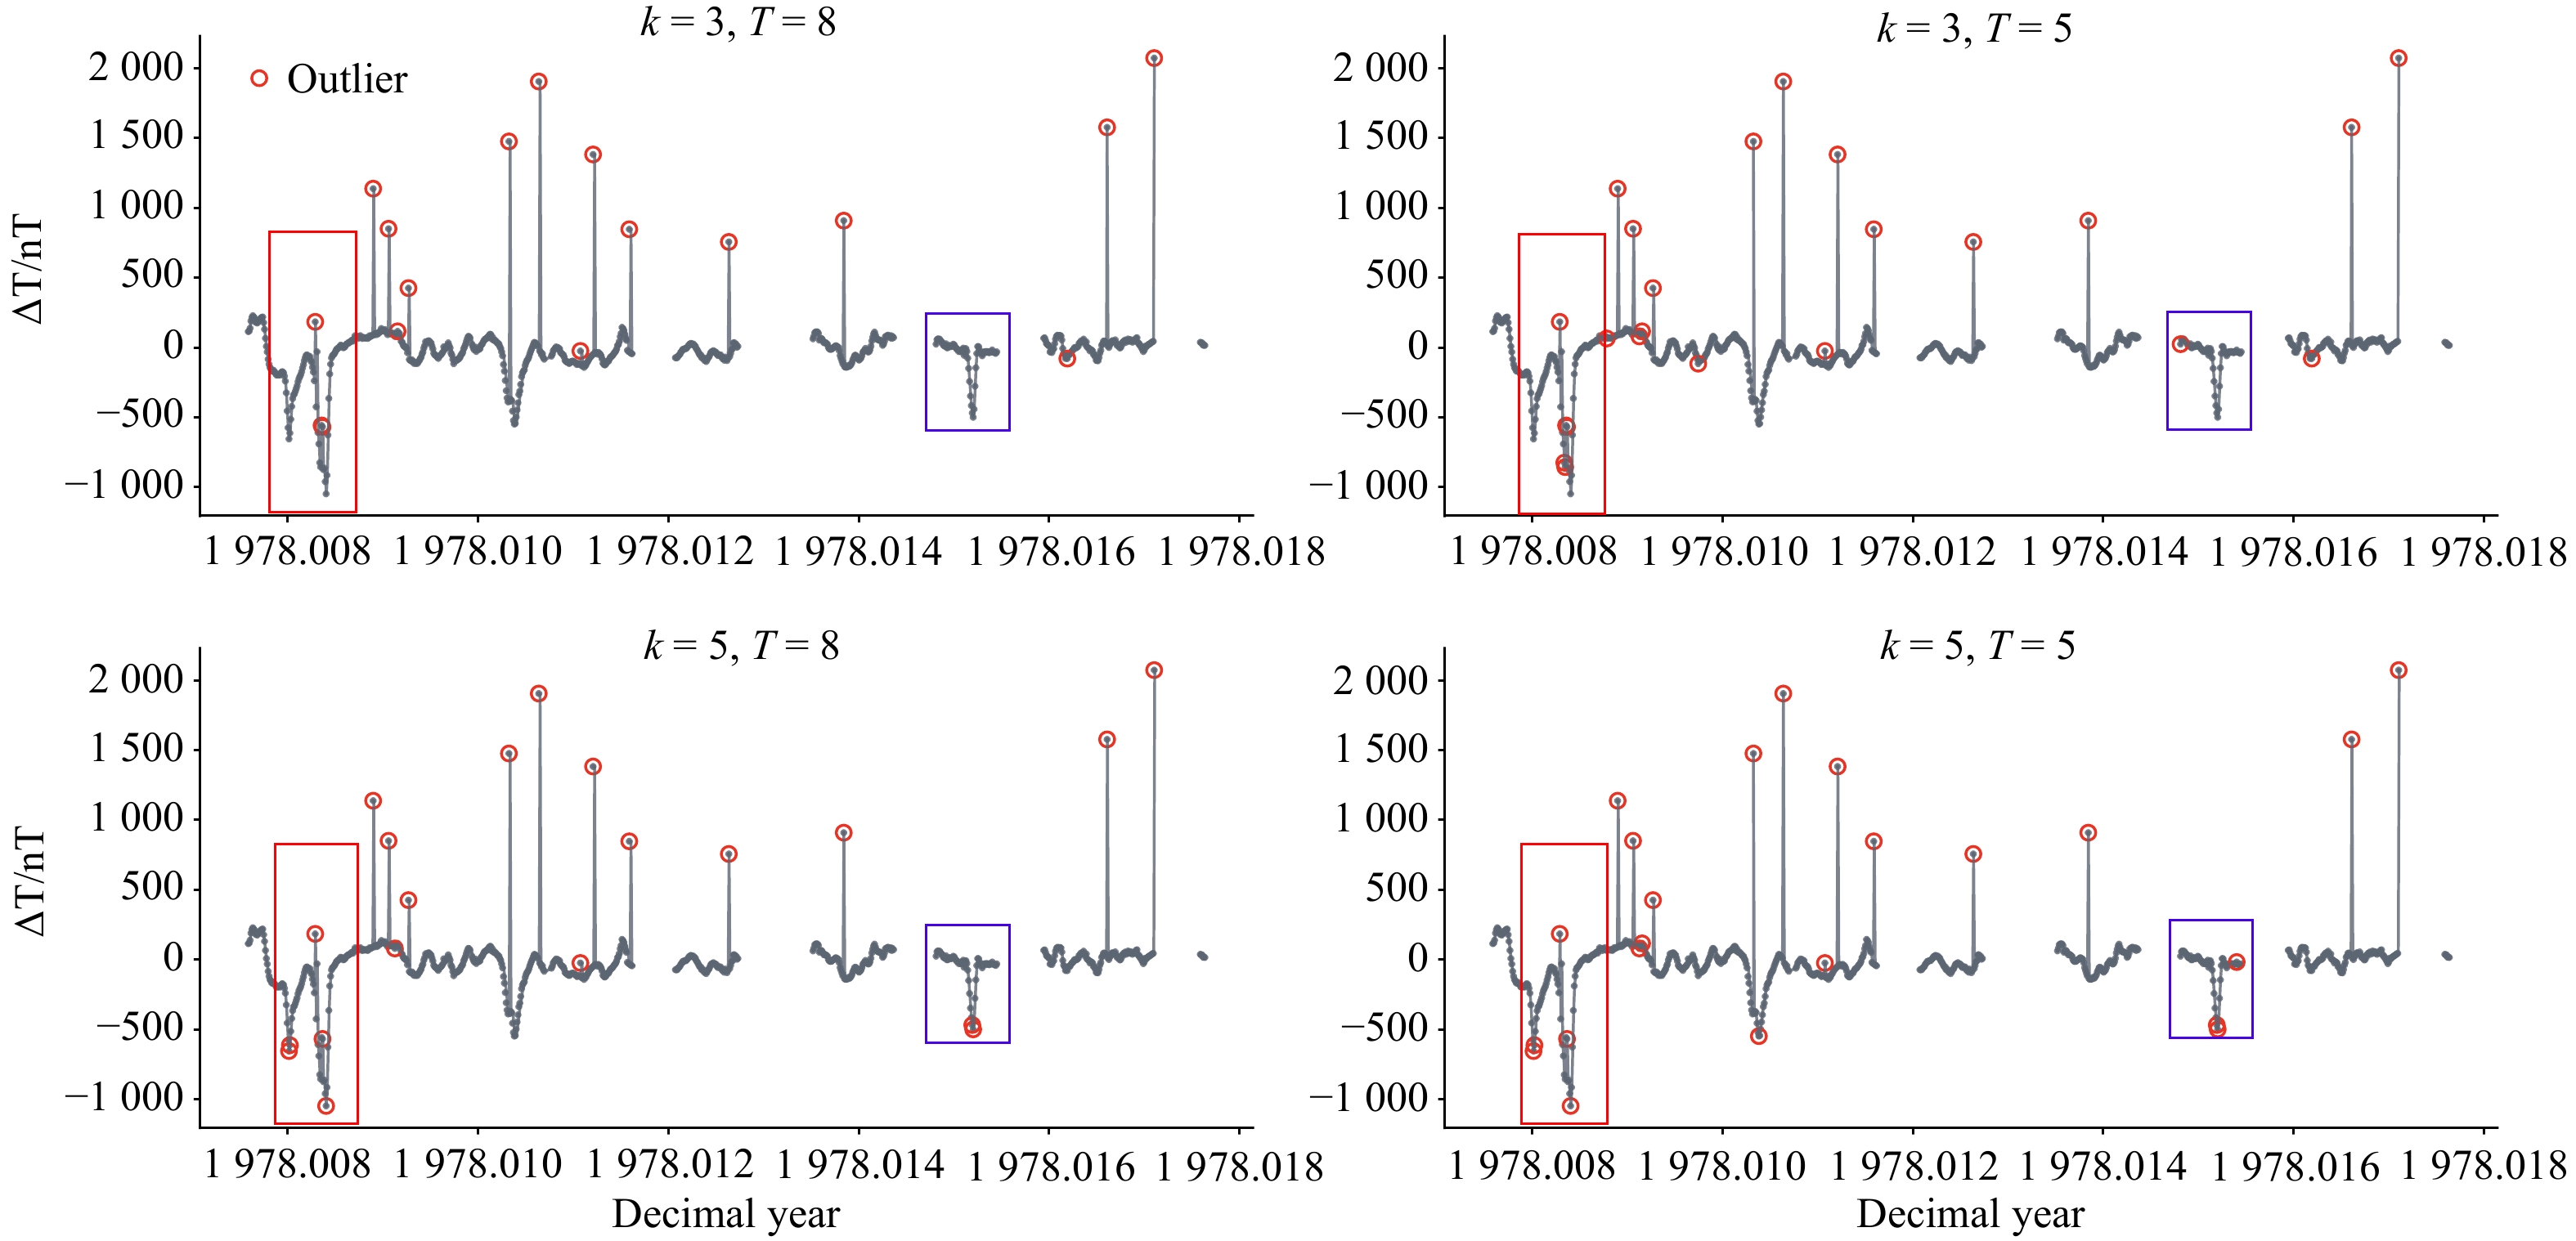
图 4 不同参数选择的影响。k代表滤波窗口,T代表阈值。红色矩形与蓝色矩形区域突出显示不同参数选择导致的异常值检测结果差异较明显的区域。
Fig. 4 The impact of different parameter choices. k represents the filter window, and T represents the threshold. The red and blue rectangular regions highlight areas where the differences in outlier detection results due to different parameter selections are particularly evident
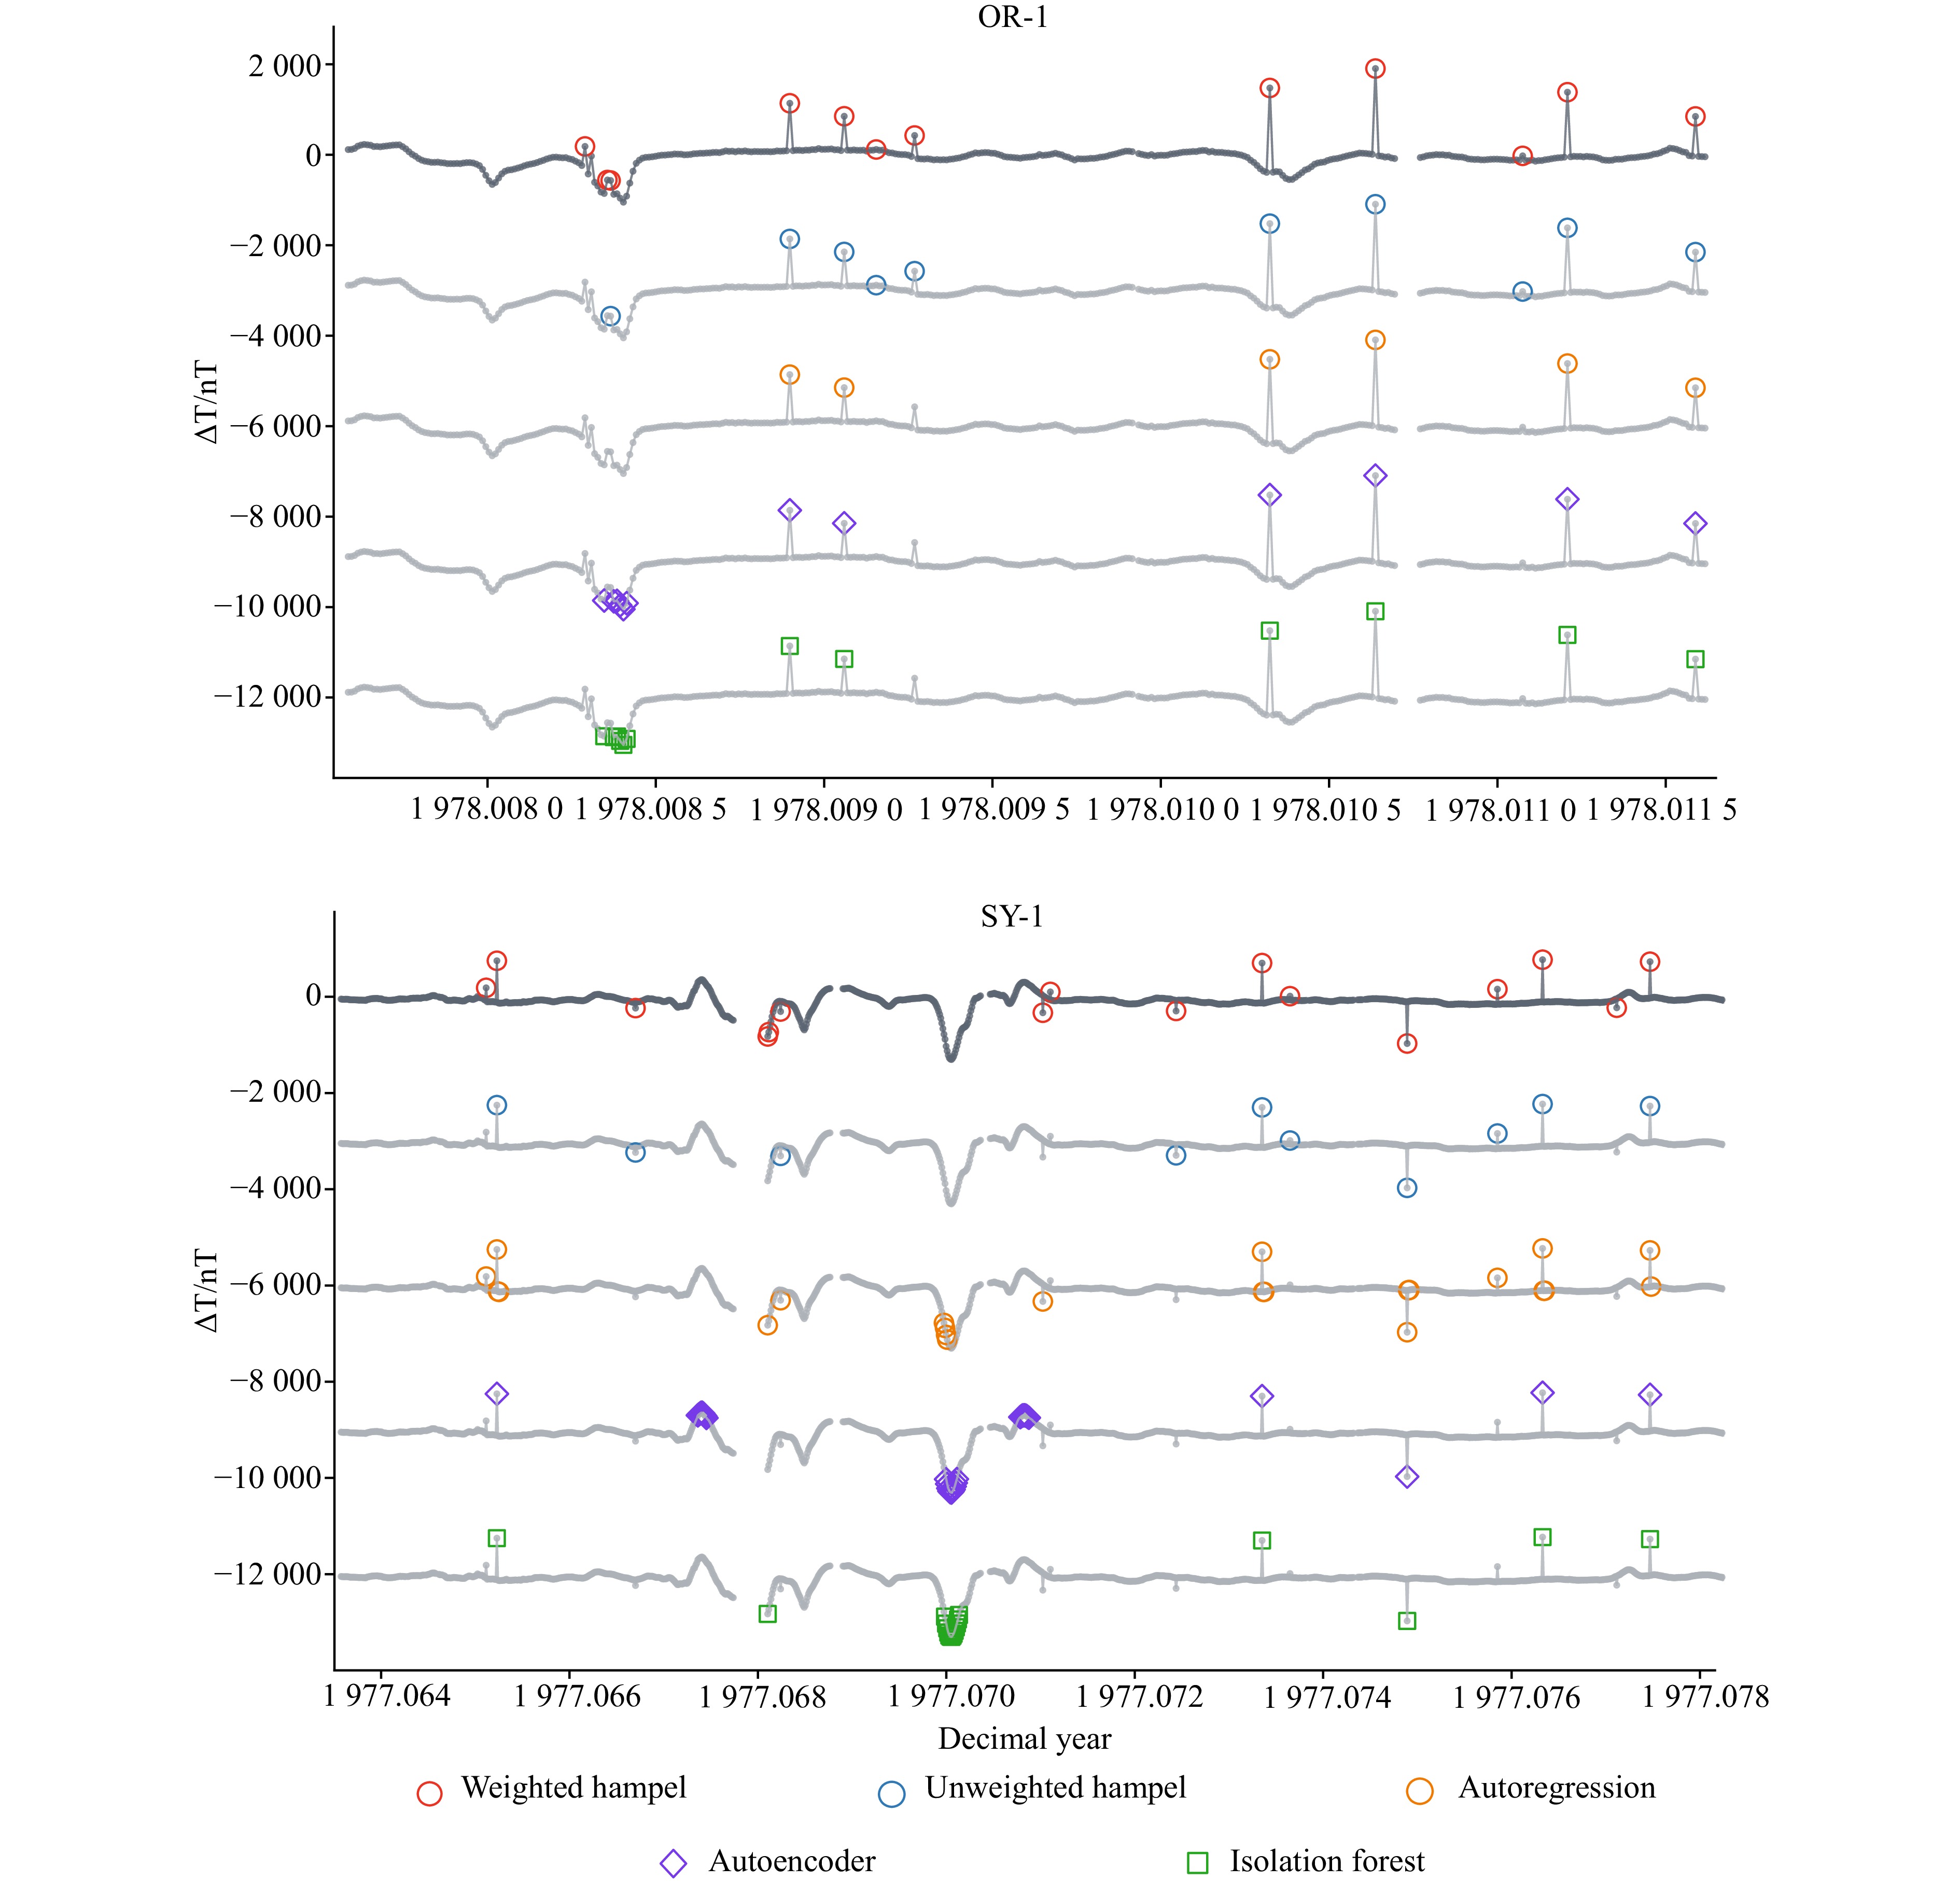
图 7 a) OR-1异常值检测结果。为了使5种方法同时对比,将后4种方法对应的磁异常数值大小每次减小3000 nT,以此绘制到同一张图中进行比较;b) SY-1异常值检测结果。绘制方法同于图7a
Fig. 7 a) OR-1 outlier detection results. To enable a comparison of the five methods, the magnetic anomaly values of the remaining four methods are each reduced by 3000 nT and plotted on the same graph; b) SY-1 outlier detection results. The plotting method is the same as that in Figure 7a
表 1 5种算法分别应用于5条示例数据段的F1分数统计
Tab. 1 The F1 score statistics of five algorithms applied to five example data segments
方法名称 OR-1 OR-2 OR-3 SY-1 SY-2 Weighted Hampel filter 0.9091 0.9804 0.9310 0.9455 0.9375 Hampel filter 0.8387 0.9600 0.8800 0.8276 0.9032 Autoregression 0.7692 0.8335 0.6136 0.4816 0.4615 Autoencoder 0.6250 0.9615 0.7500 0.2963 0.1131 Isolation Forest 0.6250 0.9796 0.9474 0.4000 0.3077 -
[1] 孙昊, 李志炜, 熊雄. 海洋磁力测量技术应用及发展现状[J]. 海洋测绘, 2019, 39(6): 5−8,20.Sun Hao, Li Zhiwei, Xiong Xiong. Application and development of marine magnetic surveying technology[J]. Hydrographic Surveying and Charting, 2019, 39(6): 5−8,20. [2] 管志宁. 地磁场与磁力勘探[M]. 北京: 地质出版社, 2005.Guan Zhining. Geomagnetic Field And Magnetic Exploration[M]. Beijing: Geological Publishing House, 2005. [3] Vine F J, Matthews D H. Magnetic Anomalies over Oceanic Ridges[M]. Nature Publishing, 1963: 947−949. [4] Gee J S, Kent D V. Source of oceanic magnetic anomalies and the geomagnetic polarity time scale[J]. Treatise on Geophysics, 2007, 5: 455−507. doi: 10.1016/B978-044452748-6/00097-3 [5] Quesnel Y, Catalán M, Ishihara T. A new global marine magnetic anomaly data set[J]. Journal of Geophysical Research: solid earth, 2009, 114(B4): B04106. [6] Lai K H, Zha Daochen, Xu Junjie, et al. Revisiting time series outlier detection: definitions and benchmarks[C]//35th Conference on Neural Information Processing Systems Datasets and Benchmarks Track (Round 1). 2021. (查阅网上资料, 未找到出版信息, 请确认补充) [7] Braei M, Wagner S. Anomaly detection in univariate time-series: a survey on the state-of-the-art[J]. arXiv preprint arXiv: 2004.00433, 2020. (查阅网上资料, 不确定类型及格式是否正确, 请确认) [8] Pang Guansong, Shen Chunhua, Cao Longbing, et al. Deep learning for anomaly detection: a review[J]. ACM Computing Surveys, 2020, 54(2): 1−38. [9] Huang Yanming, Sager W W, Zhang Jinchang, et al. Magnetic anomaly map of shatsky rise and its implications for oceanic plateau formation[J]. Journal of Geophysical Research: Solid Earth, 2021, 126(2): e2019JB019116. doi: 10.1029/2019JB019116 [10] Thoram S, Sager W W, Gaastra K, et al. Nature and origin of magnetic lineations within valdivia bank: ocean plateau formation by complex seafloor spreading[J]. Geophysical Research Letters, 2023, 50(13): e2023GL103415. doi: 10.1029/2023GL103415 [11] Meyer B, Chulliat A, Saltus R. Derivation and error analysis of the earth magnetic anomaly grid at 2 arc min resolution version 3 (EMAG2v3)[J]. Geochemistry, Geophysics, Geosystems, 2017, 18(12): 4522−4537. doi: 10.1002/2017GC007280 [12] Ishihara T. A new leveling method without the direct use of crossover data and its application in marine magnetic surveys: weighted spatial averaging and temporal filtering[J]. Earth, Planets and Space, 2015, 67(1): 11. doi: 10.1186/s40623-015-0181-7 [13] Pearson R K, Neuvo Y, Astola J, et al. Generalized hampel filters[J]. EURASIP Journal on Advances in Signal Processing, 2016, 2016: 87. doi: 10.1186/s13634-016-0383-6 [14] Alken P, Thébault E, Beggan C D, et al. International Geomagnetic Reference Field: The thirteenth generation[J]. Earth, Planets and Space, 2021, 73: 49. doi: 10.1186/s40623-020-01288-x [15] Sabaka T J, Olsen N, Purucker M E. Extending comprehensive models of the Earth's magnetic field with Ørsted and CHAMP data[J]. Geophysical Journal International, 2004, 159(2): 521−547. doi: 10.1111/j.1365-246X.2004.02421.x [16] Rousseeuw P J, Leroy A M. Robust Regression and Outlier Detection[M]. New York: John Wiley & Sons, 2005. [17] Sakurada M, Yairi T. Anomaly detection using autoencoders with nonlinear dimensionality reduction[C]//Proceedings of the MLSDA 2014 2nd Workshop on Machine Learning for Sensory Data Analysis. 2014: 4−11. (查阅网上资料, 未找到本条文献出版信息, 请确认) [18] Zhao Yue, Nasrullah Z, Li Zheng. PyOD: a python toolbox for scalable outlier detection[J]. Journal of Machine Learning Research (JMLR), 2019, 20: 1−7. [19] Liu F T, Ting K M, Zhou Zhihua. Isolation forest[C]//2008 Eighth Ieee International Conference On Data Mining. Pisa: IEEE, 2008: 413−422. [20] Munir M, Siddiqui S A, Dengel A, et al. DeepAnT: a deep learning approach for unsupervised anomaly detection in time series[J]. IEEE Access, 2019, 7: 1991−2005. doi: 10.1109/ACCESS.2018.2886457 -


 下载:
下载:
