

Identification of abnormal buoy data based on time series correlation analysis method
-
摘要: 海洋生态浮标异常数据的实时早期监测识别是保证观测数据质量的关键。本研究通过对浙江沿海浮标多年数据的分析,发现了与传统跳变异常数据不同的渐变异常数据类型。该异常类型呈现出在时序变化过程中连续平稳,但随时间逐渐偏移,最后整体偏离正常的分布特征,并且单一参数的分析方法无法对此异常进行有效识别。因此本研究利用海洋环境参数中酸碱度(pH)、溶解氧(DO)和叶绿素(Chla)三者的多参数相关性规律,提出了在一定时序上两两参数间相关性是稳定甚至是一致的假设,将8 天时间窗口的两两相关系数(R8 d)和前后两天R8 d之差的绝对值(ΔR)作为相关性和稳定性核心指标,建立了基于相关性的渐变异常数据自动识别方法。为浮标传感器渐变异常的早期识别提供了一个新的思路,有助于提升海洋生态浮标异常数据的自动化监测能力。Abstract: The identification of abnormal marine ecological buoy data is the key to ensure the quality of buoy data. In this study, we found that the gradual abnormal data type is different from the traditional jump abnormal data through analysis of the coastal buoy data in Zhejiang for many years. With a single parameter analysis method, it is difficult to work out accurately the new gradual abnormal data type of stable and gradual deviation from the normal data. Therefore, multiple parameters correlation coefficient method is proposed based on the relationships between pH, dissolved oxygen and chlorophyll a on the condition of that the correlation between two parameters is stable or even consistent at a certain time series. There are two simple statistical parameters of the cross-correlation coefficient of 8-day time window (R8 d) and the difference of R8 d (ΔR) in this method. Those could be used to automatically detect the gradual abnormal buoy data and do very well. The multiple parameters correlation coefficient method provides a new idea for the gradual abnormal data identification, and also improves the automatic monitoring capability of marine ecological buoy abnormal data.
-
Key words:
- ecological buoy /
- environmental monitoring /
- validation /
- correlation analysis
-
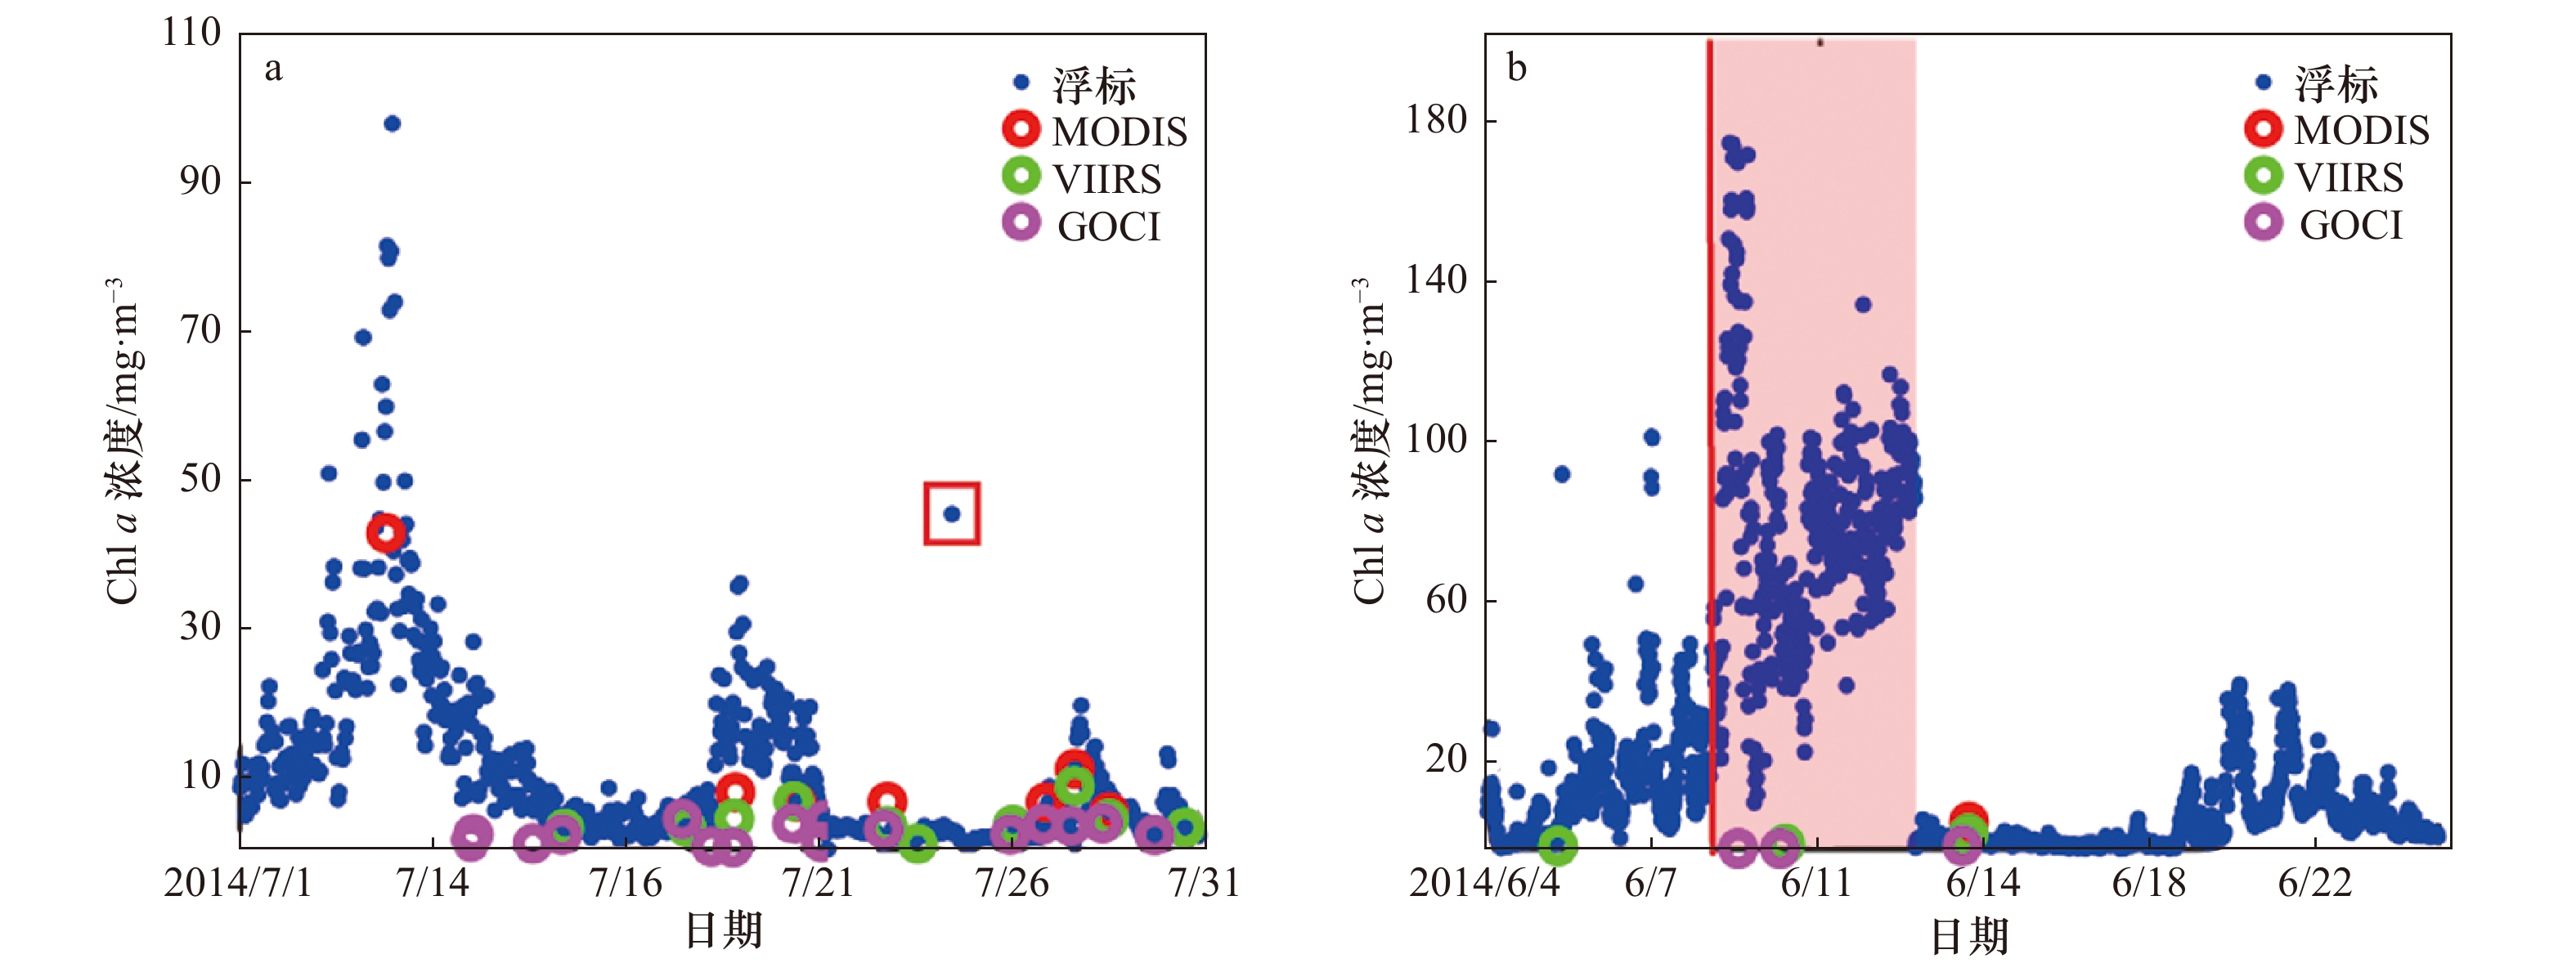
图 1 浮标数据与卫星数据叶绿素a浓度对比
a. 2014年7月TZ01(台州大陈)浮标叶绿素浓度与卫星数据的对比结果;b. 2014年6月NJ01(温州南麂)浮标叶绿素浓度与卫星数据的对比结果
Fig. 1 Comparison of chlorophyll a concentration between buoy data and satellite data
a. Comparison of chlorophyll a concentration between TZ01 buoy data and satellite data in July 2014; b. comparison of chlorophyll a concentration between NJ01 buoy data and satellite data in June 2014
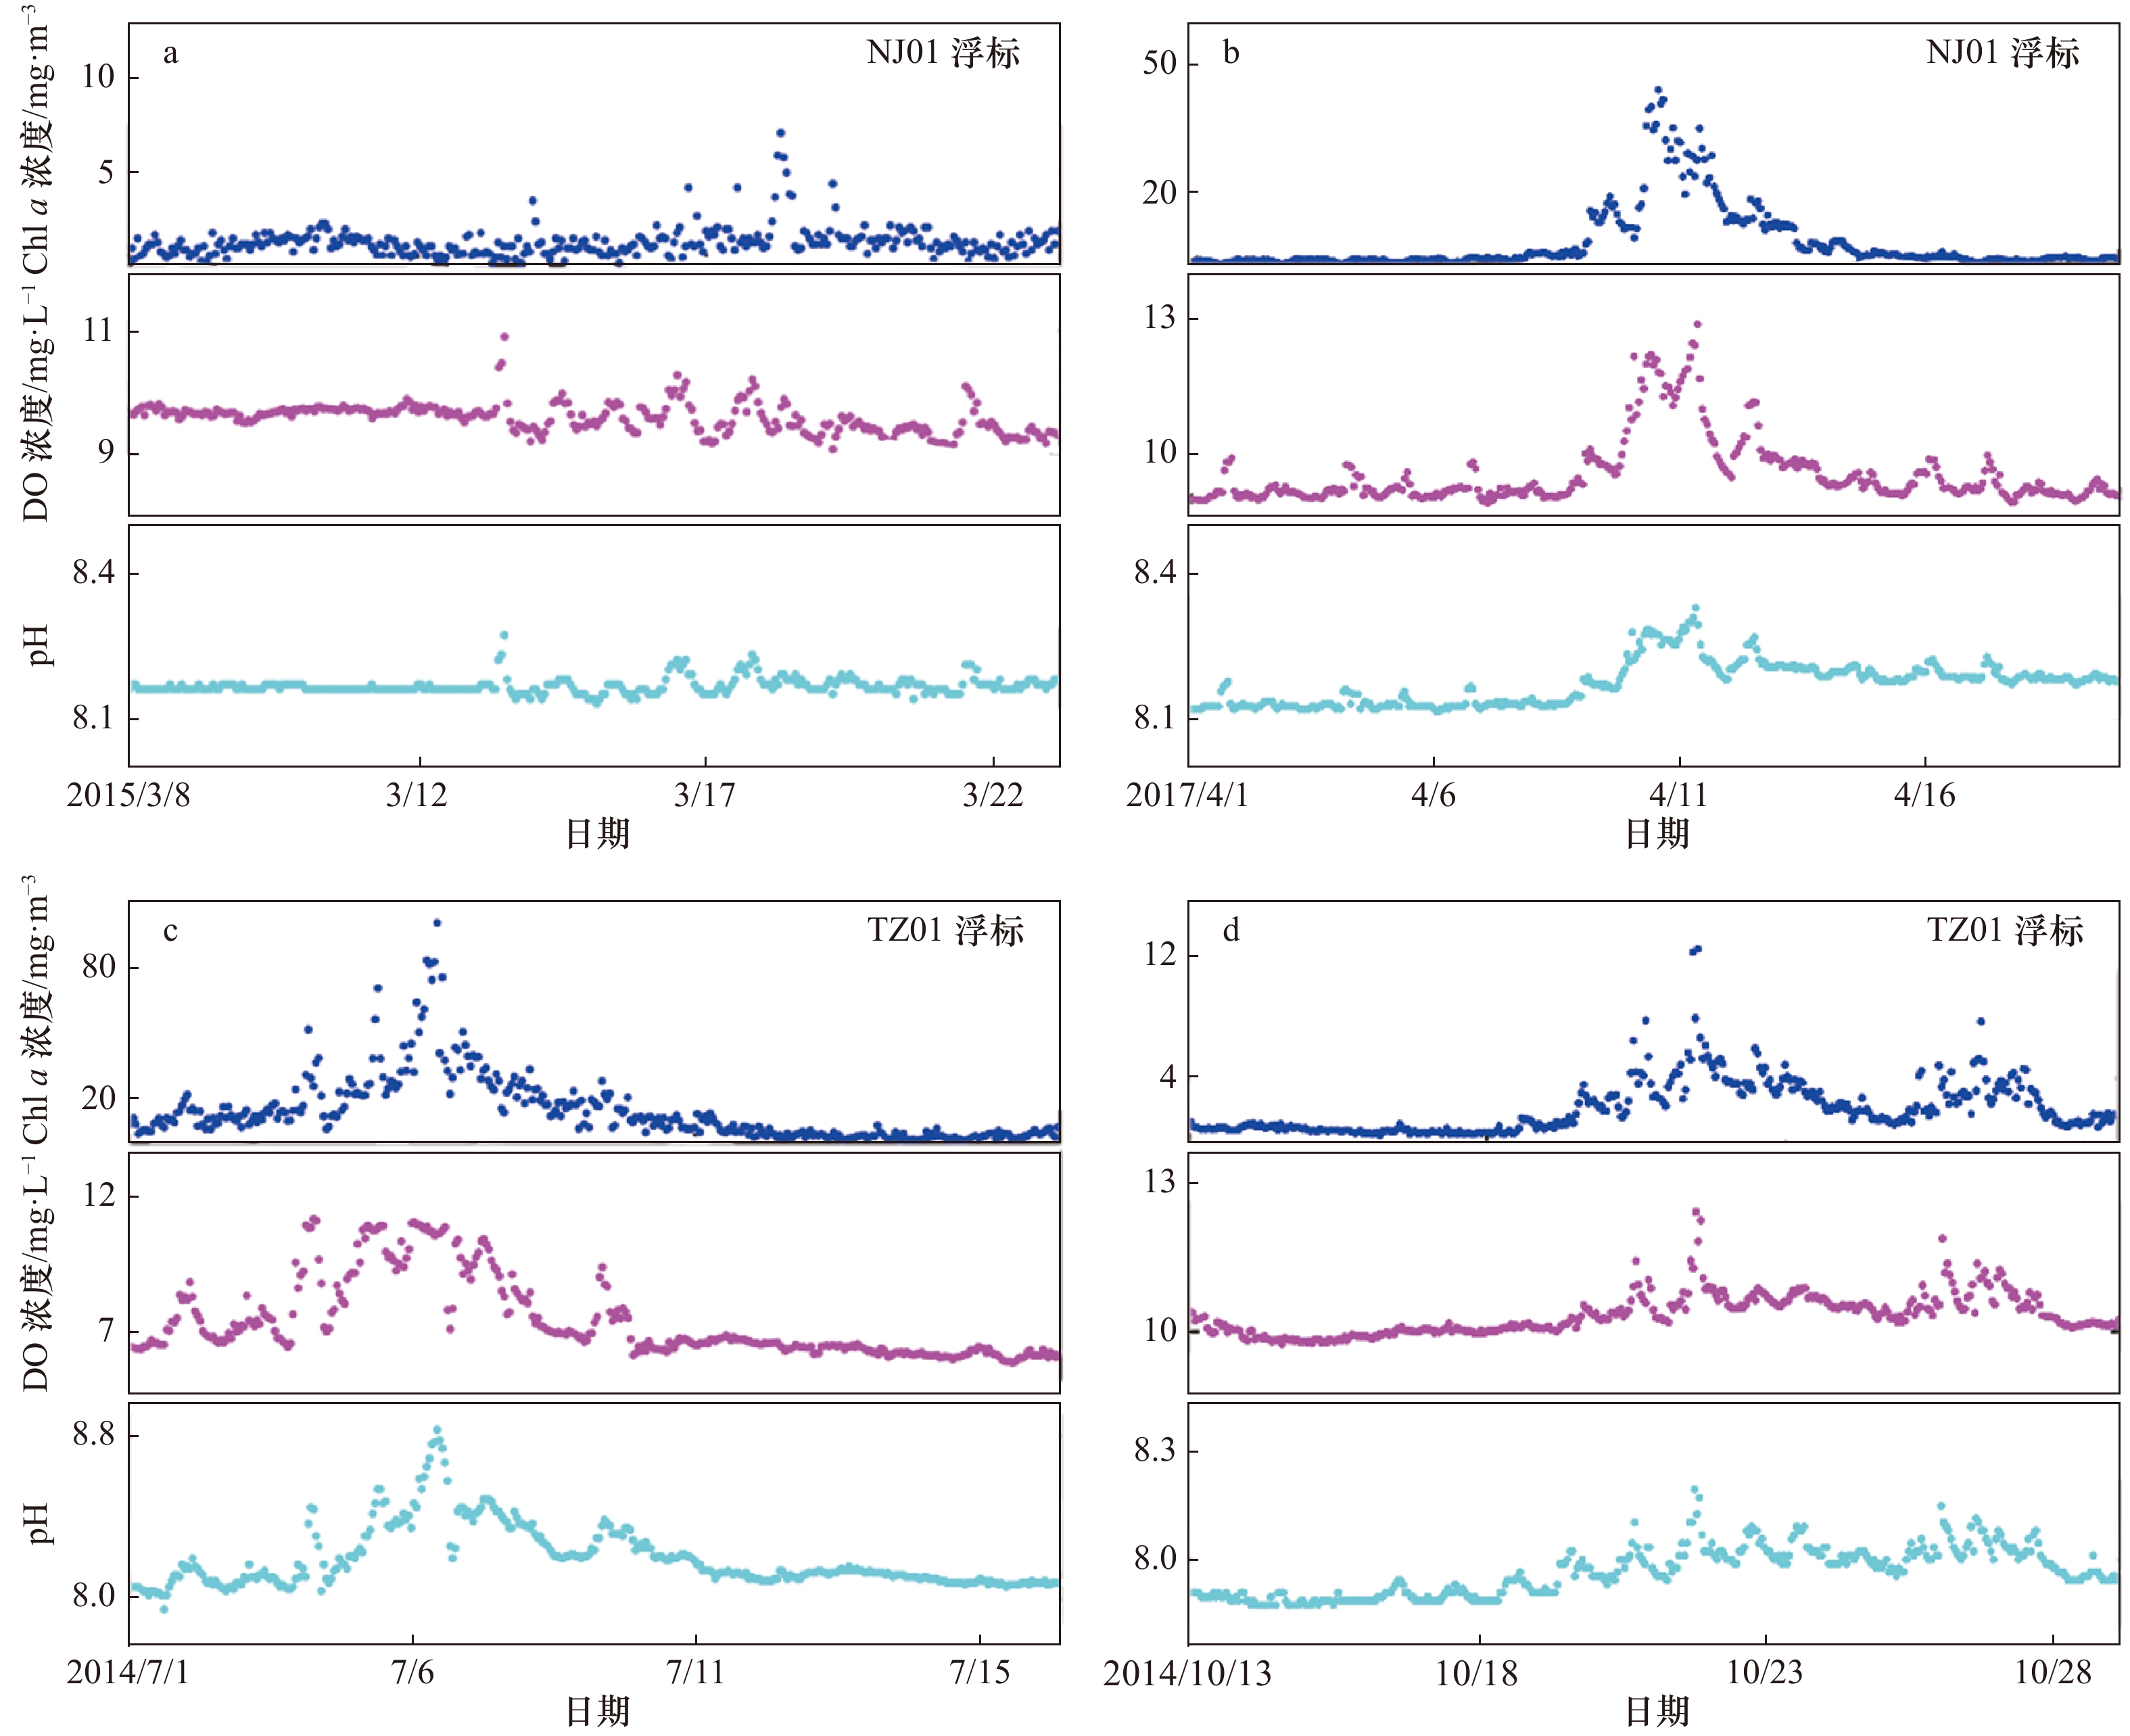
图 3 部分正确的浮标数据序列
a. 2015年3月NJ01浮标原始数据;b. 2017年4月NJ01浮标原始数据;c. 2014年7月TZ01浮标原始数据; d. 2014年10月TZ01浮标原始数据
Fig. 3 Partially correct buoy data sequence
a. NJ01 buoy raw data in March 2015; b. NJ01 buoy raw data in April 2017; c. TZ01 buoy raw data in July 2014; d. TZ01 buoy raw data in October 2014

图 4 不同时间窗口的相关系数(a)和基于8 d时间窗口的相关系数(b)
Fig. 4 Correlation coefficient for different time windows (a), and correlation coefficient for 8 d time window (b)

图 7 2015年4−6月(a−c)和2014年6−7月(d−f)TZ01浮标的原始数据(a,d)、R8 d(b,e)和ΔR(c,f)
Fig. 7 TZ01 buoy raw data (a, d), R8 d (b, e), and ΔR (c, f) in April to June, 2015 (a−c) and June to July, 2014 (d−f)

图 8 2013年5−6月TZ01浮标原始数据(a)、R8 d(b)和ΔR(c),2014年6月(d−f)和2015年3−4月(g−i)NJ01浮标原始数据(d,g)、R8 d(e,h)和ΔR(f,i)
Fig. 8 TZ01 buoy raw data (a), R8 d (b), and ΔR (c) in May to June, 2013, and NJ01 buoy raw data (d,g), R8 d (e,h), and ΔR (f,i) in June 2014 (d−f) and March to April 2015 (g−i)
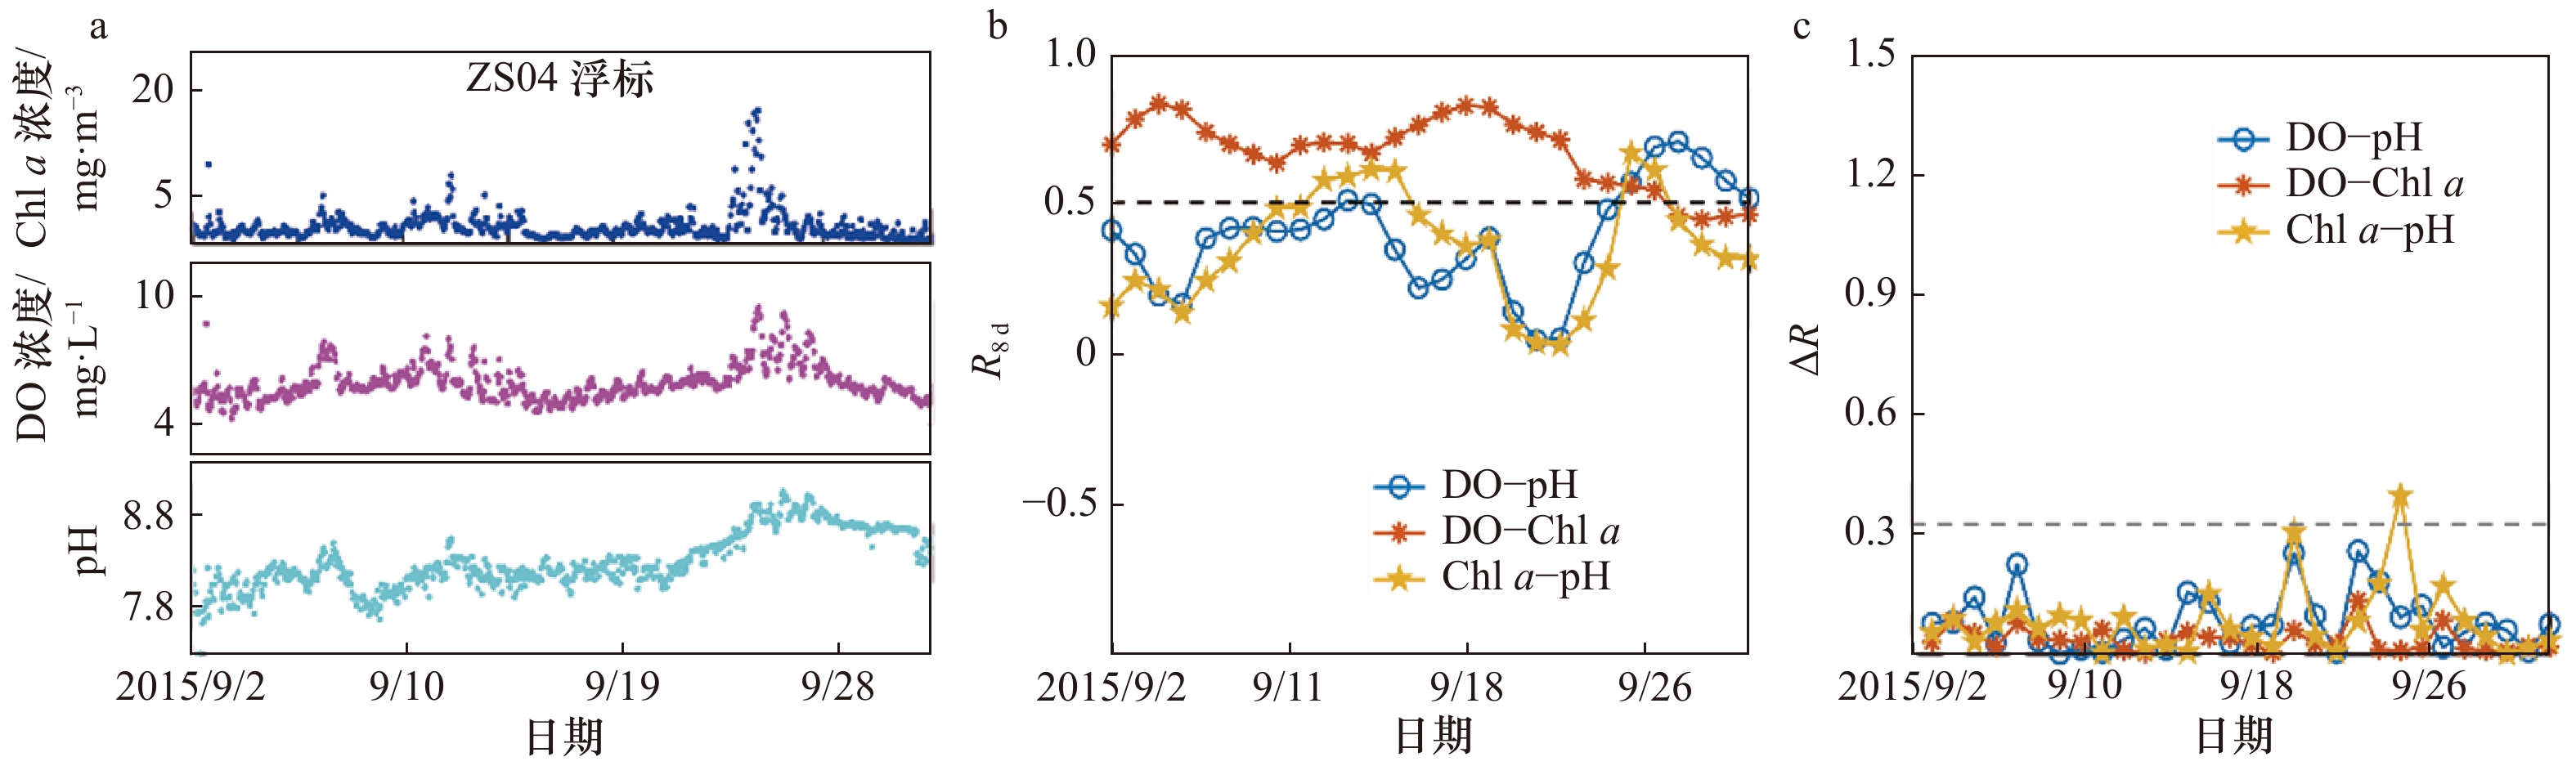
图 9 2015年9月ZS04浮标原始数据(a)、R8 d(b)和ΔR(c)
Fig. 9 ZS04 buoy raw data (a), R8 d (b), and ΔR (c) in September, 2015

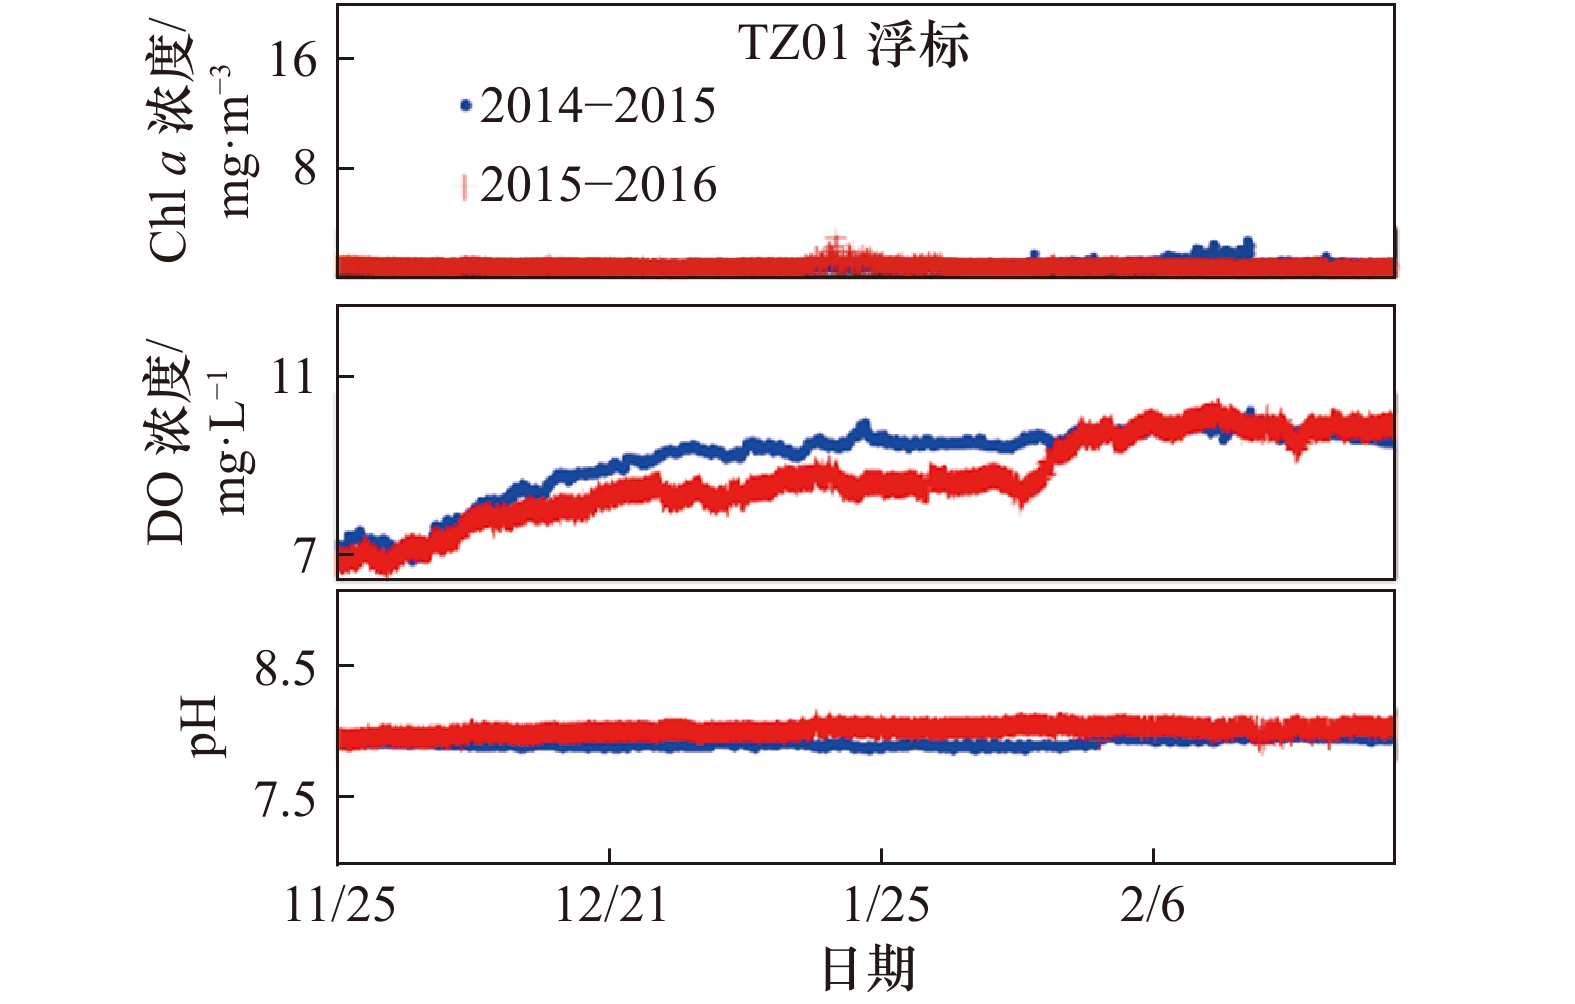
图 10 2014年冬季TZ01浮标原始数据(a)、R8 d(b)和ΔR(c)
Fig. 10 TZ01 buoy raw data (a), R8 d (b), and ΔR (c) in the winter of 2014
表 1 浮标数据统计
Tab. 1 Statistical buoys data
浮标 起止时间 原始
数据/组异常/维护等
状态数据/组正常状态
数据/组NJ01 2013年7月至2017年5月 57 070 5 006 52 064 TZ01 2012年8月至2017年5月 38 359 846 37 513 NB03 2014年7月至2017年5月 24 086 469 23 617 NB01 2013年7月至2017年5月 34 129 994 33 135 ZS04 2015年8月至2017年5月 15 573 556 15 017 ZS03 2015年8月至2017年5月 14 750 791 13 959 合计 183 967 8662 175 305  下载: 导出CSV
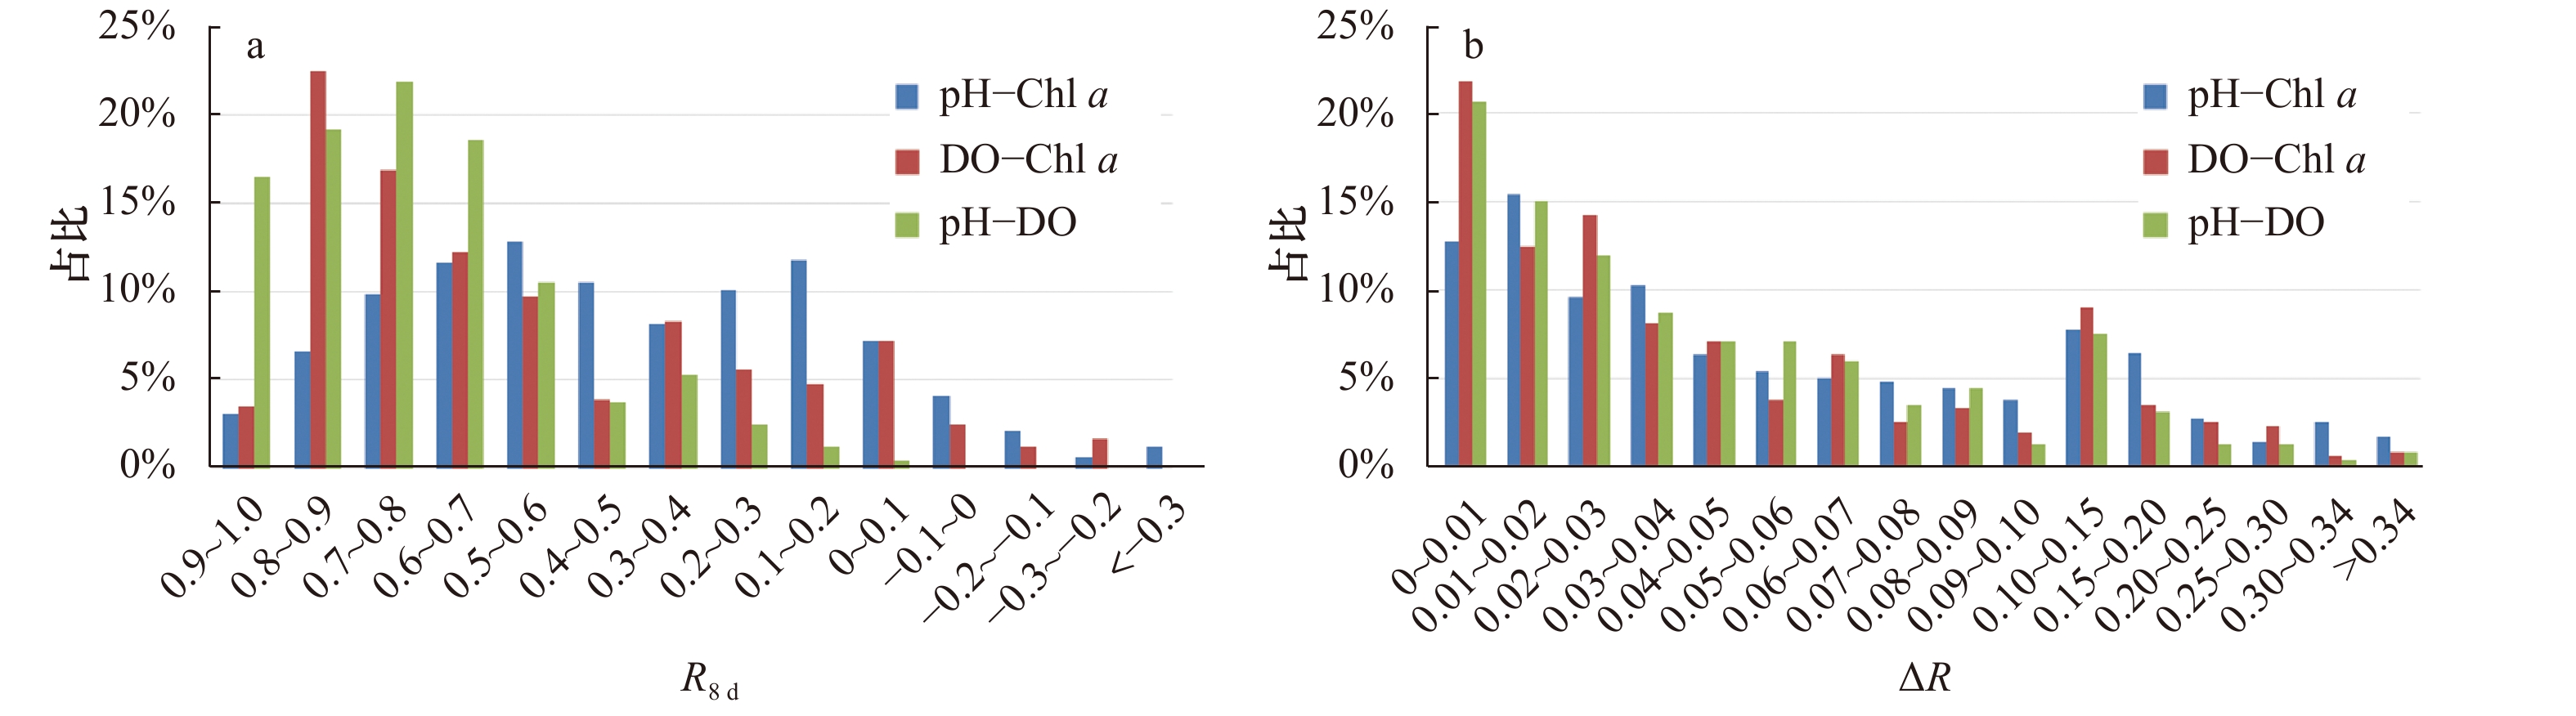
表 2 R8 d的分布情况
Tab. 2 Distribution of R8 d
R8 d值 R8 d(pH−DO) R8 d(DO−Chl a) R8 d(pH−Chl a) 0.5~1.0 86.80% 64.80% 44.20% 0~0.5 13.20% 29.80% 47.80% –0.3~0 0% 5.40% 6.80% <–0.3 0% 0% 1.20%
下载: 导出CSV
表 3 ΔR的分布情况
Tab. 3 Distribution of ΔR
ΔR ΔR(pH−DO) ΔR(DO−Chl a) ΔR(pH−Chl a) 0~0.03 47.50% 48.40% 37.70% 0.03~0.06 22.90% 19.00% 21.90% 0.06~0.10 15.20% 14.00% 18.00% 0.10~0.34 13.60% 17.90% 20.70% >0.34 0.80% 0.70% 1.70%
下载: 导出CSV
表 4 浮标出错日期的R8 d 和ΔR情况
Tab. 4 R8 d and ΔR of buoy error date
组别 R8 d(pH−DO) R8 d(DO−Chl a) R8 d(pH−Chl a) ΔR(pH−DO) ΔR(DO−Chl a) ΔR(pH−Chl a) 第一组(5月24日) −0.42 0.56 −0.39 0.89 0.17 0.90 第二组(6月9日) 0.96 −0.10 −0.16 0.003 0.41 0.44 第三组(4月7日) 0.38 −0.41 0.45 0.09 0.35 0.40
下载: 导出CSV
-
[1] 黄谟涛, 翟国君, 王瑞, 等. 海洋测量异常数据的检测[J]. 测绘学报, 1999, 28(3): 269−277. doi: 10.3321/j.issn:1001-1595.1999.03.015Huang Motao, Zhai Guojun, Wang Rui, et al. The detection of abnormal data in marine survey[J]. Acta Geodaetica et Cartographica Sinica, 1999, 28(3): 269−277. doi: 10.3321/j.issn:1001-1595.1999.03.015 [2] 中华人民共和国国家质量监督检验检疫总局, 中国国家标准化管理委员会. GB 17378.2−2007, 海洋监测规范 第2部分: 数据处理与分析质量控制[S]. 北京: 中国标准出版社, 2008.General Administration of Quality Supervision, Inspection and Quarantine of the People's Republic of China, Standardization Administration of China. GB 17378.2−2007, The specification for marine monitoring—Part 2: data processing and quality control of analysis[S]. Beijing: China Standard Press, 2008. [3] Sivareddy S, Paul A, Sluka T, et al. The pre-Argo ocean reanalyses may be seriously affected by the spatial coverage of moored buoys[J]. Scientific Reports, 2017, 7: 46685. doi: 10.1038/srep46685 [4] Dong Guozhong, Chen Dongying. Quality control algorithm for marine meteorological data based on interest degree association rules[J]. Journal of Coastal Research, 2019, 94(S1): 173−176. [5] 黄冬梅, 康培红, 张明华, 等. 一种基于ULDB的海洋环境监测数据管理系统[P]. 中国: 201110004234. X, 2011−06−01.Huang Dongmei, Kang Peihong, Zhang Minghua, et al. ULDB (Databases with Uncertainty and Lineage)-based marine environmental monitored data management system[P]. CN: 201110004234. X, 2011−06−01. [6] ARGO. Argo quality control management, Version 2.4, Argo data management[Z]. 2009. [7] D'Ortenzio F, Thierry V, Eldin G, et al. White book on oceanic autonomous platforms for biogeochemical studies: instrumentation and measure (PABIM), version 1.3[Z]. 2010. [8] Fu Wenju, Huang Guanwen, Yang Yuanxi, et al. Multi-GNSS combined precise point positioning using additional observations with opposite weight for real-time quality control[J]. Remote Sensing, 2019, 11(3): 311. doi: 10.3390/rs11030311 [9] Cosoli S, Grcic B, De Vos S, et al. Improving data quality for the Australian high frequency ocean radar network through real-time and delayed-mode quality-control procedures[J]. Remote Sensing, 2018, 10(9): 1476. doi: 10.3390/rs10091476 [10] Duan Boheng, Zhang Weimin, Yang Xiaofeng, et al. Assimilation of typhoon wind field retrieved from scatterometer and SAR based on the Huber norm quality control[J]. Remote Sensing, 2017, 9(10): 987. doi: 10.3390/rs9100987 [11] Fichot C G, Downing B D, Bergamaschi B A, et al. High-resolution remote sensing of water quality in the San Francisco Bay–Delta Estuary[J]. Environmental Science & Technology, 2016, 50(2): 573−583. [12] Schuckmann K, Garau B, Wehde H, et al. MyOcean: real time quality control of temperature and salinity measurements[R]. 2010. [13] 张明, 张韧, 王辉赞, 等. 基于Argo浮标数据的Aquarius数据产品质量评估[J]. 海洋信息, 2015(3): 21−28. doi: 10.3969/j.issn.1005-1724.2015.03.005Zhang Ming, Zhang Ren, Wang Zanhui, et al. Quality evaluation of Aquarius data products based on Argo buoy data[J]. Marine Information, 2015(3): 21−28. doi: 10.3969/j.issn.1005-1724.2015.03.005 [14] 史静涛. 海洋环境实时观测数据质量控制方法研究与软件实现[D]. 天津: 国家海洋技术中心, 2010.Shi Jingtao. The data quality control method research and software realization for marine environment real-time observation[D]. Tianjin: National Marine Technology Center, 2010. [15] Ishii M, Fukuda Y, Hirahara S, et al. Accuracy of global upper ocean heat content estimation expected from present observational data sets[J]. SOLA, 2017, 13: 163−167. doi: 10.2151/sola.2017-030 [16] Shulski M, Cooper S, Roebke G, et al. The Nebraska Mesonet: technical overview of an automated state weather network[J]. Journal of Atmospheric and Oceanic Technology, 2018, 35(11): 2189−2200. doi: 10.1175/JTECH-D-17-0181.1 [17] Jiang Jingang, Sun Lu, Fan Zhongya, et al. Outlier detection and sequence reconstruction in continuous time series of ocean observation data based on difference analysis and the Dixon criterion[J]. Limnology and Oceanography Methods, 2017, 15(11): 916−927. doi: 10.1002/lom3.10212 [18] 窦文洁, 蒋锦刚, 周斌, 等. 基于多参数差分相关的海洋时序观测数据滤波算法[J]. 海洋学报, 2012, 34(5): 50−58.Dou Wenjie, Jiang Jingang, Zhou Bin, et al. An algorithm for the difference correlation filter for multi-parameter marine timing observation data[J]. Haiyang Xuebao, 2012, 34(5): 50−58. [19] Oguma S, Nagata Y. Skewed water temperature occurrence frequency in the sea off Sanriku, Japan, and intrusion of the pure Kuroshio water[J]. Journal of Oceanography, 2002, 58(6): 787−796. doi: 10.1023/A:1022862911129 [20] Mardia K V, Kent J T, Bibby J M. Multivariate analysis[J]. Probability and Mathematical Statistics, 1979, 37(1): 123−131. [21] Wei W W S. Multivariate Time Series Analysis and Applications[M]. New York: John Wiley & Sons Inc., 2019. [22] Bartholomew D J. Time series analysis forecasting and control[J]. Journal of the Operational Research Society, 1971, 22(2): 199−201. doi: 10.1057/jors.1971.52 [23] Olson D A, Riedel T P, Long R, et al. Time series analysis of wintertime O3 and NOx formation using vector autoregressions[J]. Atmospheric Environment, 2019, 218: 116988. doi: 10.1016/j.atmosenv.2019.116988 [24] Tsay R S. Time series model specification in the presence of outliers[J]. Journal of the American Statistical Association, 1986, 81(393): 132−141. doi: 10.1080/01621459.1986.10478250 [25] Razi M A, Athappilly K. A comparative predictive analysis of neural networks (NNs), nonlinear regression and classification and regression tree (CART) models[J]. Expert Systems with Applications, 2005, 29(1): 65−74. doi: 10.1016/j.eswa.2005.01.006 [26] Martínez-Álvarez F, Troncoso A, Riquelme J C, et al. Discovery of motifs to forecast outlier occurrence in time series[J]. Pattern Recognition Letters, 2011, 32(12): 1652−1665. doi: 10.1016/j.patrec.2011.05.002 [27] Cucina D, Di Salvatore A, Protopapas M K. Outliers detection in multivariate time series using genetic algorithms[J]. Chemometrics and Intelligent Laboratory Systems, 2014, 132: 103−110. doi: 10.1016/j.chemolab.2014.01.007 [28] Tsay R S. Outliers, level shifts, and variance changes in time series[J]. Journal of Forecasting, 1988, 7(1): 1−20. doi: 10.1002/for.3980070102 [29] Harlé F, Chatelain F, Gouy-Pailler C, et al. Bayesian model for multiple change-points detection in multivariate time series[J]. IEEE Transactions on Signal Processing, 2016, 64(16): 4351−4362. doi: 10.1109/TSP.2016.2566609 [30] Boto K G, Bunt J S. Dissolved oxygen and pH relationships in northern Australian mangrove waterways[J]. Limnology and Oceanography, 1981, 26(6): 1176−1178. doi: 10.4319/lo.1981.26.6.1176 [31] Wallace J, Champagne P, Hall G. Time series relationships between chlorophyll-a, dissolved oxygen, and pH in three facultative wastewater stabilization ponds[J]. Environmental Science: Water Research & Technology, 2016, 2(6): 1032−1040. [32] 谢群, 张瑜斌, 孙省利, 等. 流沙湾溶解氧的分布特征及其相关因素的探讨[J]. 环境科学与技术, 2009, 32(9): 39−44. doi: 10.3969/j.issn.1003-6504.2009.09.010Xie Qun, Zhang Yubin, Sun Shengli, et al. Distribution characteristics of dissolved oxygen and correlating factors analysis in Liusha Bay[J]. Environmental Science & Technology, 2009, 32(9): 39−44. doi: 10.3969/j.issn.1003-6504.2009.09.010 [33] Hollinger D Y, Richardson A D. Uncertainty in eddy covariance measurements and its application to physiological models[J]. Tree Physiology, 2005, 25(7): 873−885. doi: 10.1093/treephys/25.7.873 [34] 刘增宏, 许建平, 修义瑞, 等. 参考数据集对Argo剖面浮标盐度观测资料校正的影响[J]. 海洋预报, 2006, 23(4): 1−12. doi: 10.3969/j.issn.1003-0239.2006.04.001Liu Zenghong, Xu Jianping, Xiu Yirui, et al. The effect of reference dataset on calibration of Argo profiling float salinity data[J]. Marine Forecasts, 2006, 23(4): 1−12. doi: 10.3969/j.issn.1003-0239.2006.04.001 [35] 王辉赞, 张韧, 王桂华, 等. Argo浮标温盐剖面观测资料的质量控制技术[J]. 地球物理学报, 2012, 55(2): 577−588.Wang Zanhui, Zhang Ren, Wang Guihua, et al. Quality control of Argo temperature and salinity observation profiles[J]. Chinese Journal of Geophysics, 2012, 55(2): 577−588. -

计量
- 文章访问数: 436
- HTML全文浏览量: 195
- PDF下载量: 14
- 被引次数: 0
