

Characteristics of dissolved oxygen and pH variations in summer off the Qinhuangdao
-
摘要: 溶解氧(DO)是海洋生物生存不可缺少的要素。随着人类活动的增加,全球近岸海域低氧情况愈发严重,已经成为威胁海洋生态系统健康的重要因素。通过对2017年5−9月秦皇岛外海区域的观测调查,探讨了该海域低氧与酸化的形成机制并计算了月平均耗氧速率。结果表明,5月秦皇岛外海水体混合较为均匀,表、底层DO浓度一致,均大于8 mg/L;6月开始形成密度跃层,与此同时底层DO浓度和pH开始下降;8月底层呈现明显的低氧和酸化状态,DO浓度下降至2~3 mg/L,pH下降至7.8以下;9月随着层化消失,底层水体DO浓度和pH逐渐升高。相关性分析显示,DO和叶绿素a (Chl a)以及pH具有良好的耦合性,说明秦皇岛外海区域的低氧发生过程主要为局地变化。同时表明DO浓度和pH主要受水体中浮游植物的光合作用和有机物有氧分解的影响。通过箱式模型计算得到2017年6−8月密度跃层以下水体及沉积物耗氧速率为951~1193 mg/(m2·d)[平均为975 mg/(m2·d)]。综合来看,水体分层是秦皇岛外海低氧和酸化发生的先决条件,跃层以下的有机物分解耗氧则是底层水体发生低氧和酸化的重要原因。Abstract: Dissolved oxygen is an indispensable element for the survival of marine organisms. With the increase of human activities, the situation of hypoxia in the global coastal waters has become exacerbated, which is considered as an important factor threatening the health of the marine ecosystem. The vertical distributions of water temperature, salinity and density were investigated in the offshore area of Qinhuangdao from May to September in 2017. Additionally, the average monthly oxygen consumption rate was evaluated, and hence the mechanism of hypoxia and acidification was discussed. The results showed that the water column in the studied area was vertically homogenous in May, and no obvious difference for dissolved oxygen (DO) between the surface and bottom layers, with the value larger than 8 mg/L. From June to August, the pycnocline presented in the mid of the water column. In this period, DO and pH in bottom water gradually decreased, and reached 2−3 mg/L for DO and less than 7.8 for pH in the end of August, suggesting significant hypoxia and acidification in this area. However, DO and pH in bottom water sharply increased in September, after the pycnocline disappeared. The result indicated that hypoxia and acidification of Qinhuangdao offshore waters are seasonal. DO was significantly correlated with chlorophyll a and pH, indicating that the hypoxic and acidified processes in the offshore area of Qinhuangdao were local. The evaluated oxygen consumption rate, based on the box model, in bottom water and sediment ranged from 951 mg/(m2·d) to 1193 mg/(m2·d) (mean: 975 mg/(m2·d)) from June to August in 2017. Comprehensive analysis showed that water stratification was the prerequisite for the occurrence of hypoxia and acidification in Qinhuangdao offshore waters, and DO consumption caused by organic matter decomposition was an important reason of hypoxia and acidification in bottom water.
-
Key words:
- the sea off Qinghuangdao /
- hypoxia /
- acidification /
- oxygen consumption rate
-

图 1 研究断面所在渤海位置(a)和断面具体站位分布(b)
蓝色箭头为夏季渤海环流模式[23];A1−A6站(黑色圆点)为5−8月站位分布,其中5月由于仪器问题只有A1、A2、A5和A6这4个站位数据;B58和B59站(蓝色五角星)为国家自然基金委黄渤海共享航次中9月份靠近本研究站位的两个站位分布;B4站(绿色三角形)是2018年8月上旬进行扩散系数测量的站位;等值线表示水深(单位:m)
Fig. 1 The location of the study section in the Bohai Sea (a), the location distribution of the stations in the section (b)
The blue arrow is circulation model in the Bohai Sea in summer [23]; stations A1−A6 (black dots) are distributed from May to August, among which there are only four stations (A1, A2, A5 and A6) in May due to instrument problems; Station B58 and Station B59 (blue pentacles) are close to this research stations during the Yellow Sea and Bohai Sea Shared Voyage of NSFC in September; Station B4 (green triangle) is the station where the diffusion coefficient was measured in early August 2018; the contour line represents the depth of water (unit: m)

图 2 5月(a)、6月(b)、7月(c)、8月(d)、9月(e)温度断面分布
灰色实线是根据计算的浮力频率所得到的密度跃层上下界位置(N2>10−3/s2)
Fig. 2 Distribution diagram of temperature cross section from May to September
The solid gray line is the upper and lower boundary position of the density jump obtained according to the calculated buoyancy frequency (N2>10−3/s2)

图 3 5月(a)、6月(b)、7月(c)、8月(d)、9月(e)盐度断面分布
灰色实线是根据计算的浮力频率所得到的密度跃层上下界位置(N2>10−3/s2)
Fig. 3 Distribution diagram of salinity cross section from May to September
The solid gray line is the upper and lower boundary position of the density jump obtained according to the calculated buoyancy frequency (N2>10−3/s2)

图 4 5月(a)、6月(b)、7月(c)、8月(d)、9月(e)Chl a浓度断面分布
灰色实线是根据计算的浮力频率所得到的密度跃层上下界位置(N2>10−3/s2)
Fig. 4 Distribution diagram of chlorophyll a concentration cross section from May to September
The solid gray line is the upper and lower boundary position of the density jump obtained according to the calculated buoyancy frequency (N2>10−3/s2)
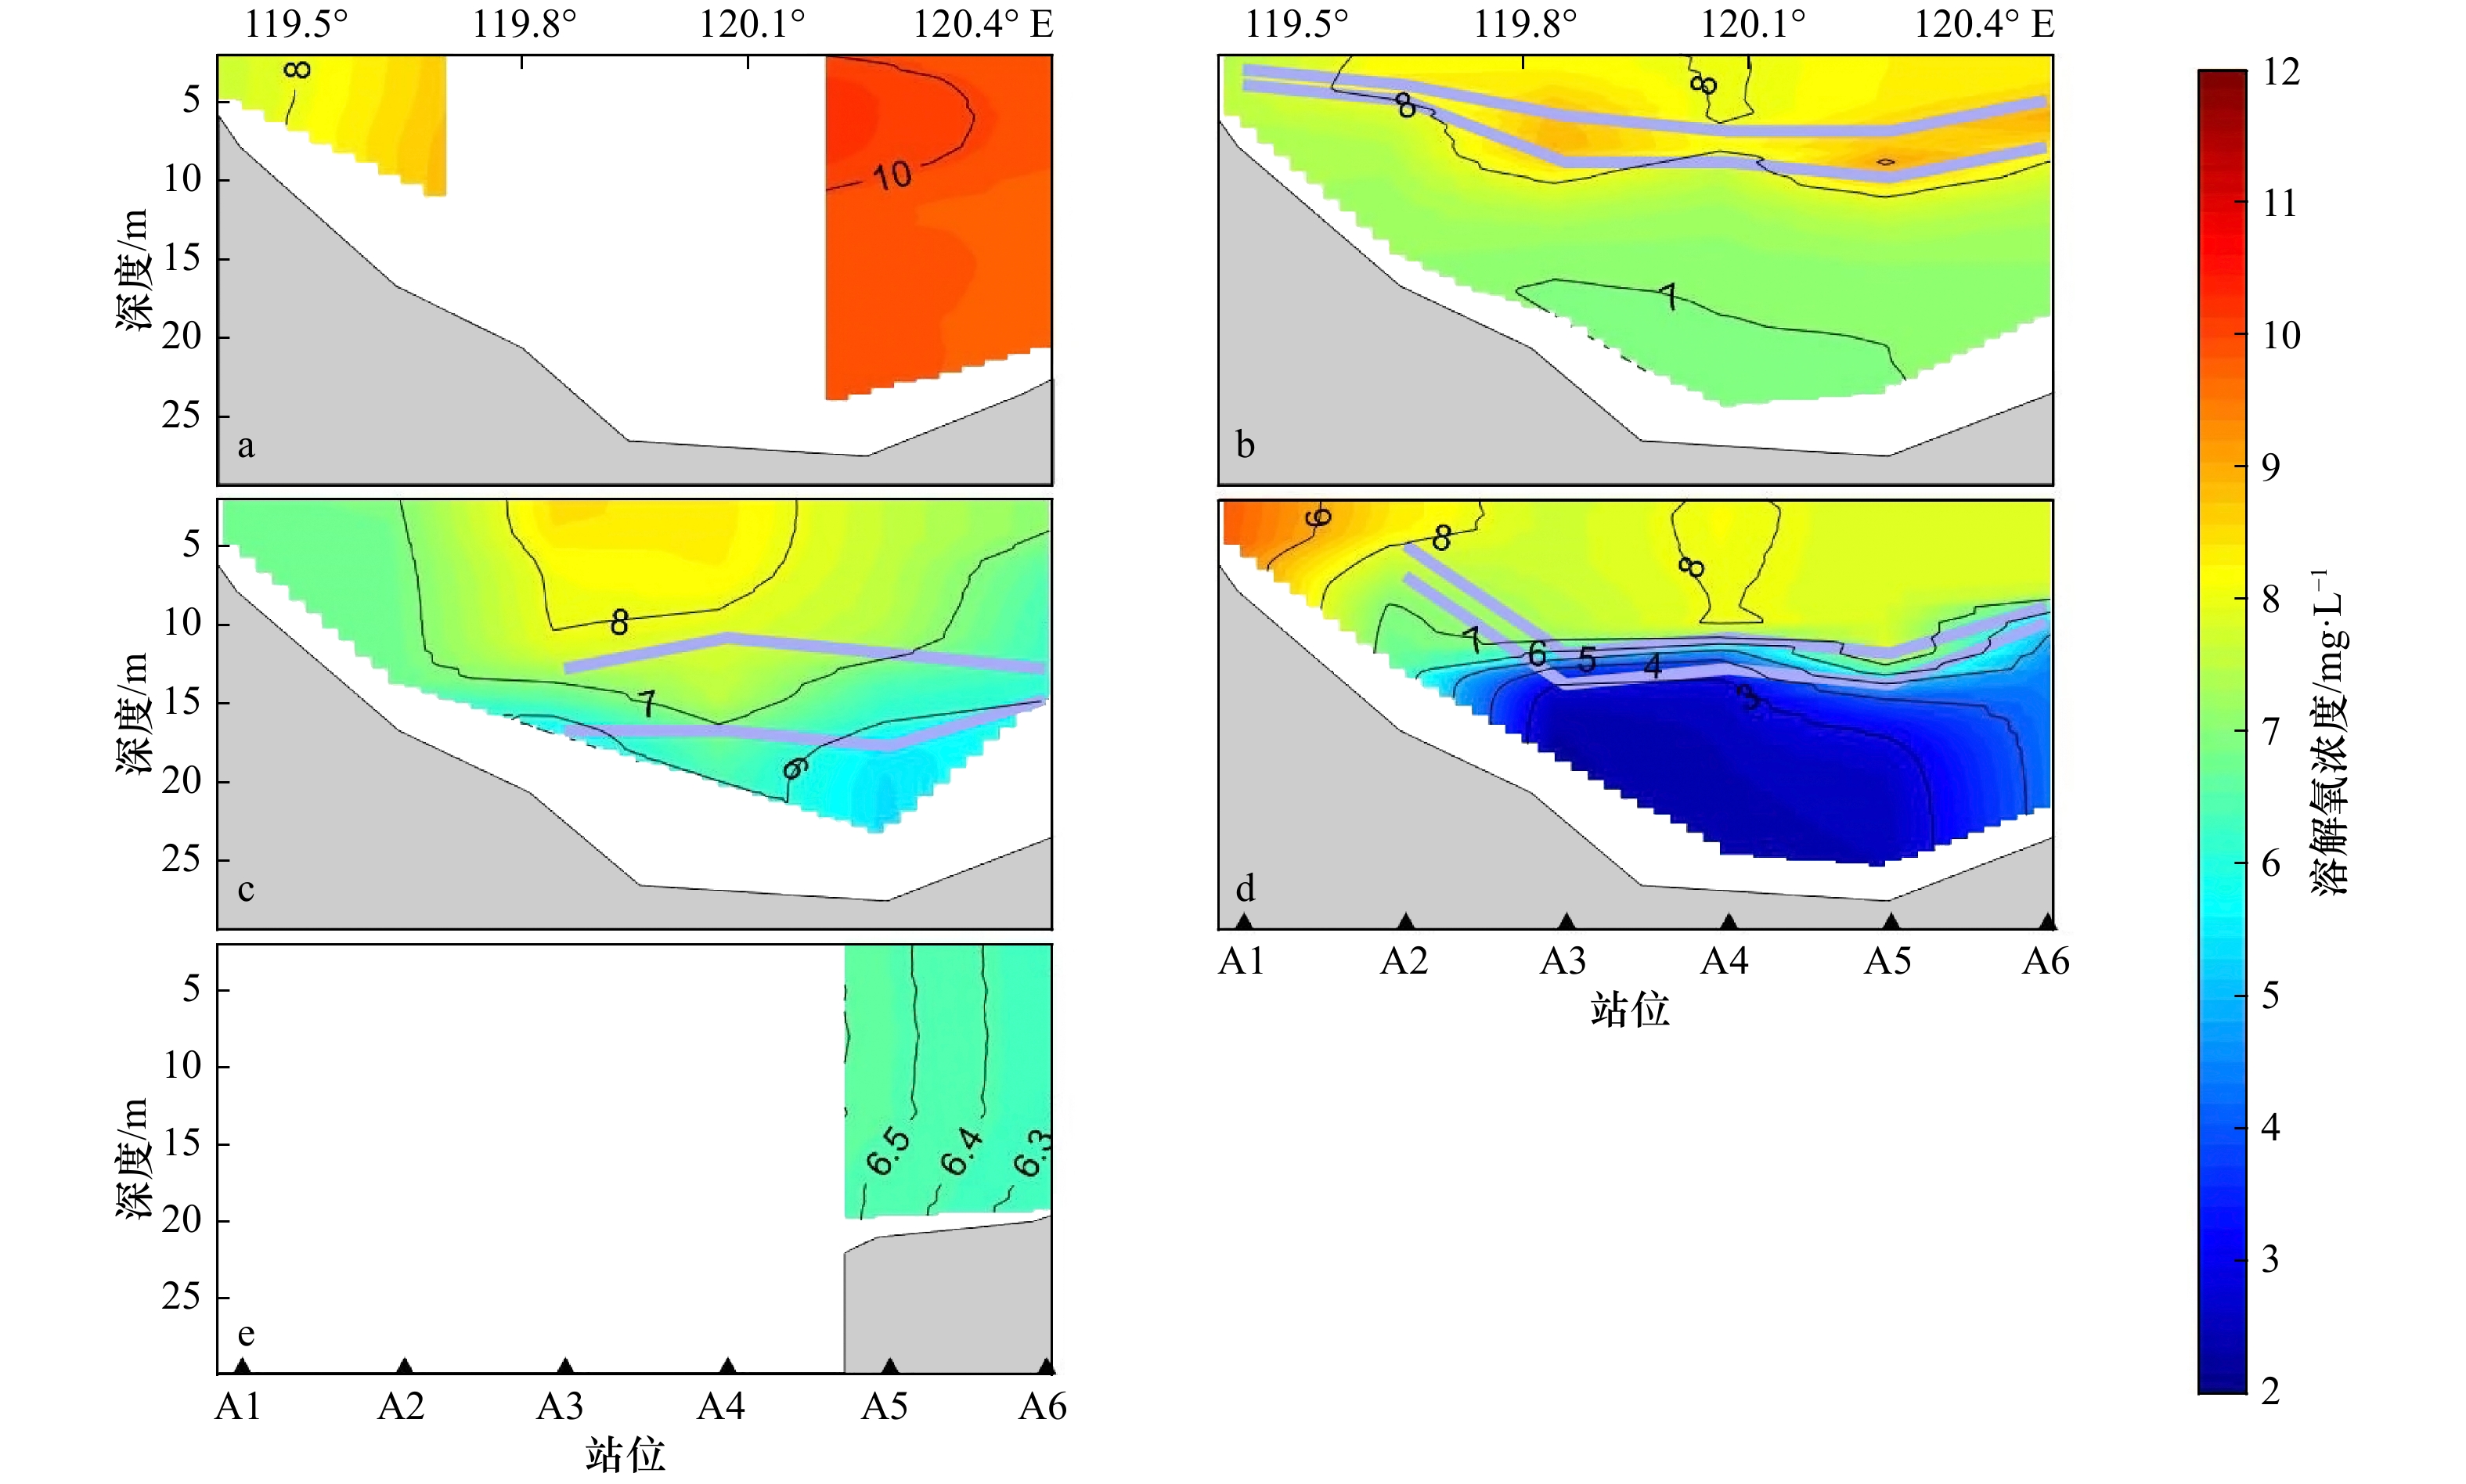
图 5 5月(a)、6月(b)、7月(c)、8月(d)、9月(e)DO浓度断面分布
灰色实线是根据计算的浮力频率所得到的密度跃层上下界位置(N2>10−3/s2)
Fig. 5 Distribution diagram of dissolved oxygen concentration cross section from May to September
The solid gray line is the upper and lower boundary position of the density jump obtained according to the calculated buoyancy frequency (N2>10−3/s2)
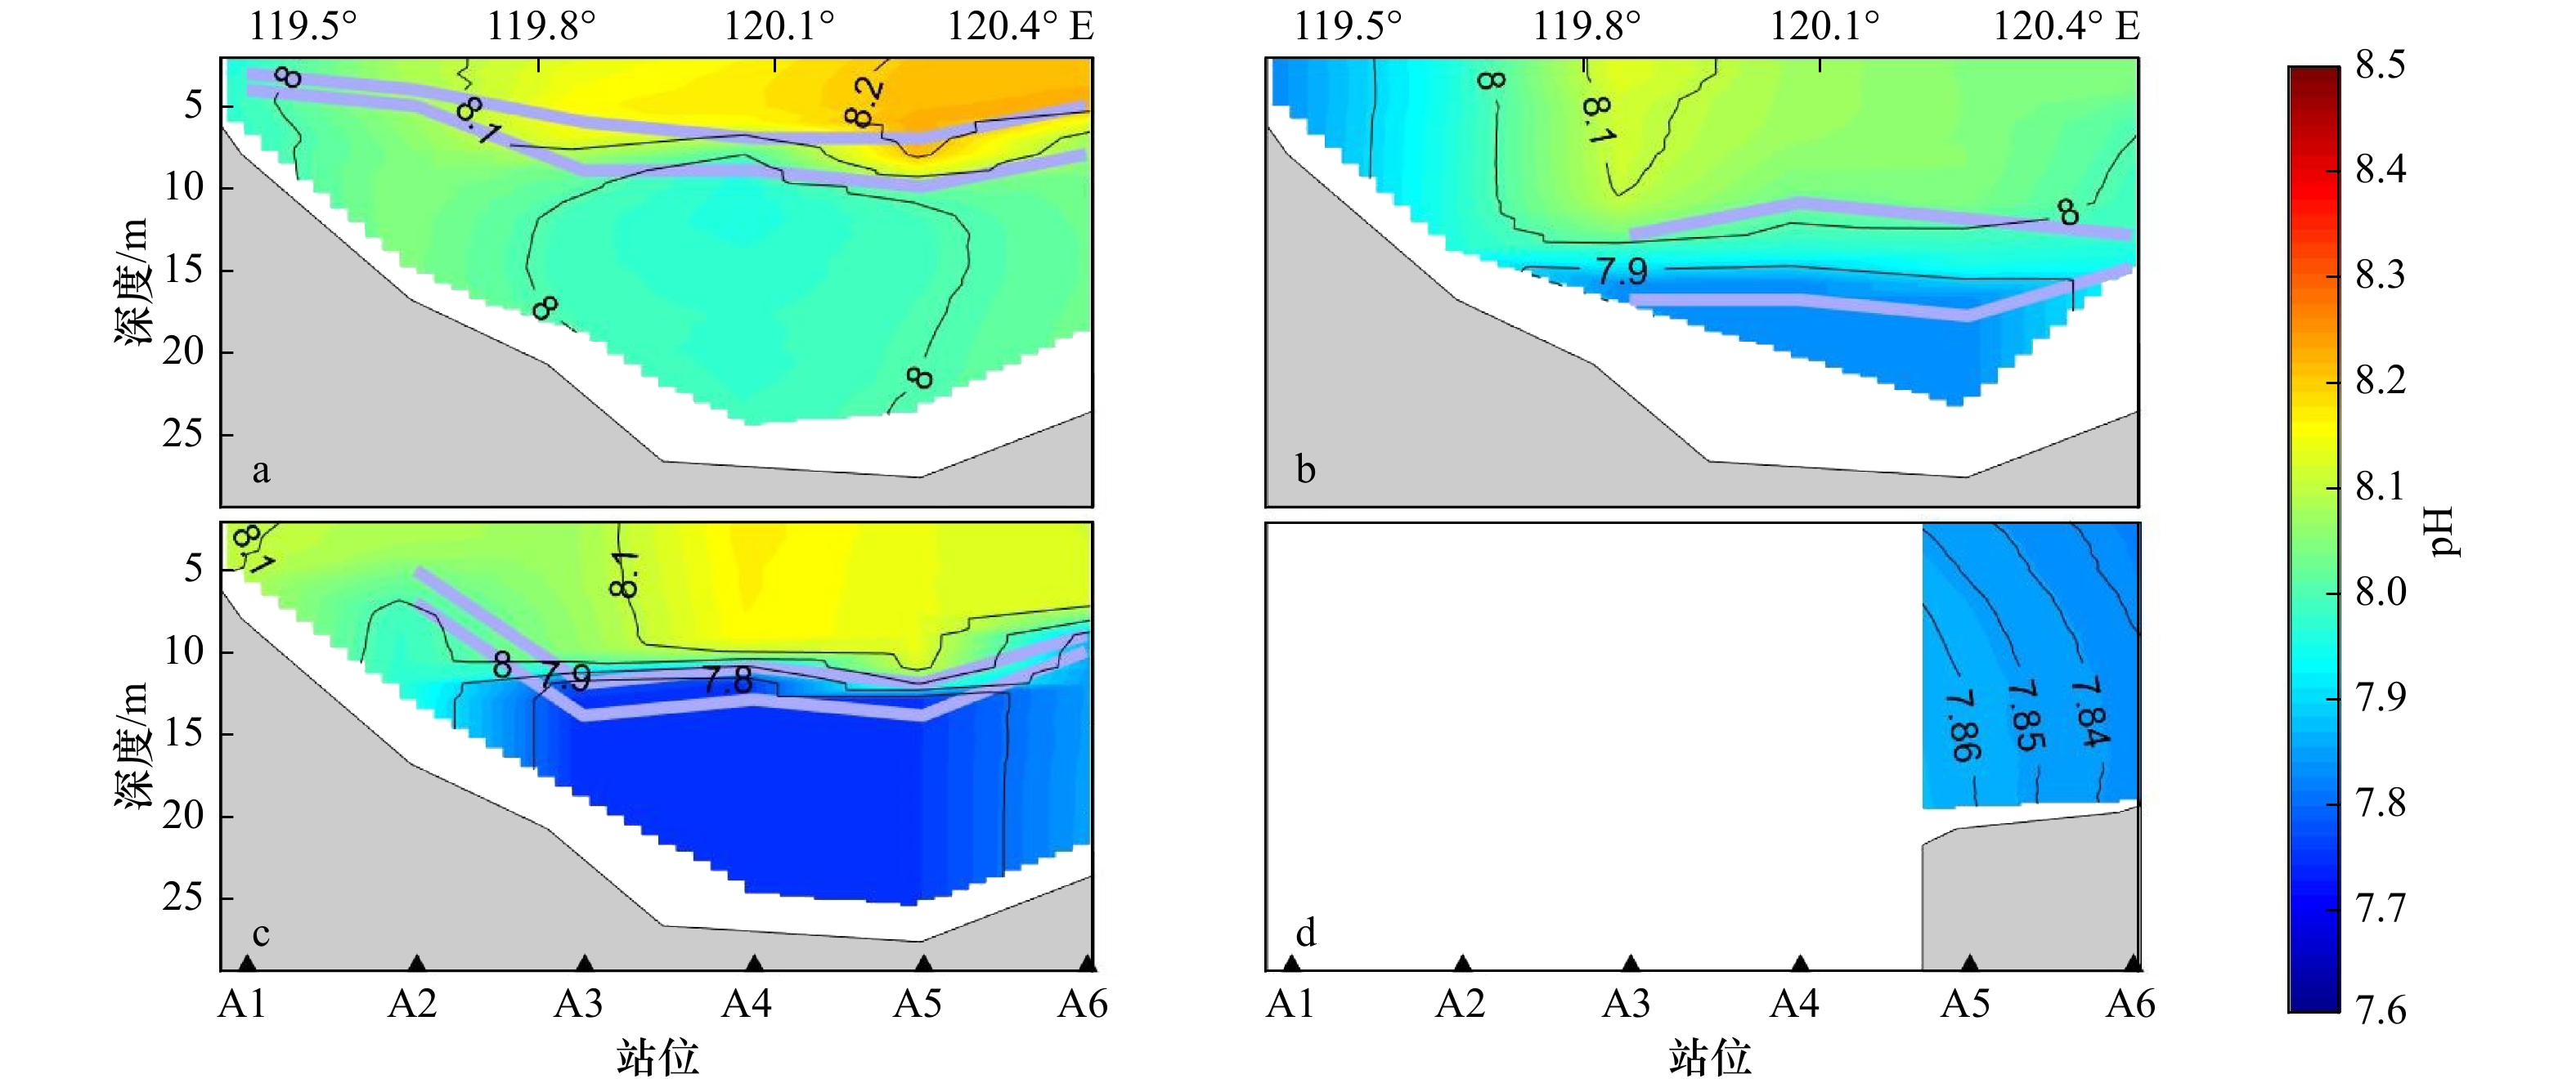
图 6 6月(a)、7月(b)、8月(c)、9月(d)pH断面分布
灰色实线是根据计算的浮力频率所得到的密度跃层上下界位置(N2>10−3/s2)
Fig. 6 Distribution diagram of pH cross section from June to September
The solid gray line is the upper and lower boundary position of the density jump obtained according to the calculated buoyancy frequency (N2>10−3/s2)

图 7 6月(a)、7月(b)、8月(c)、9月(d)AOU断面分布
灰色实线是根据计算的浮力频率所得到的密度跃层上下界位置(N2>10−3/s2)
Fig. 7 Distribution diagram of AOU cross section from June to September
The solid gray line is the upper and lower boundary position of the density jump obtained according to the calculated buoyancy frequency (N2>10−3/s2)
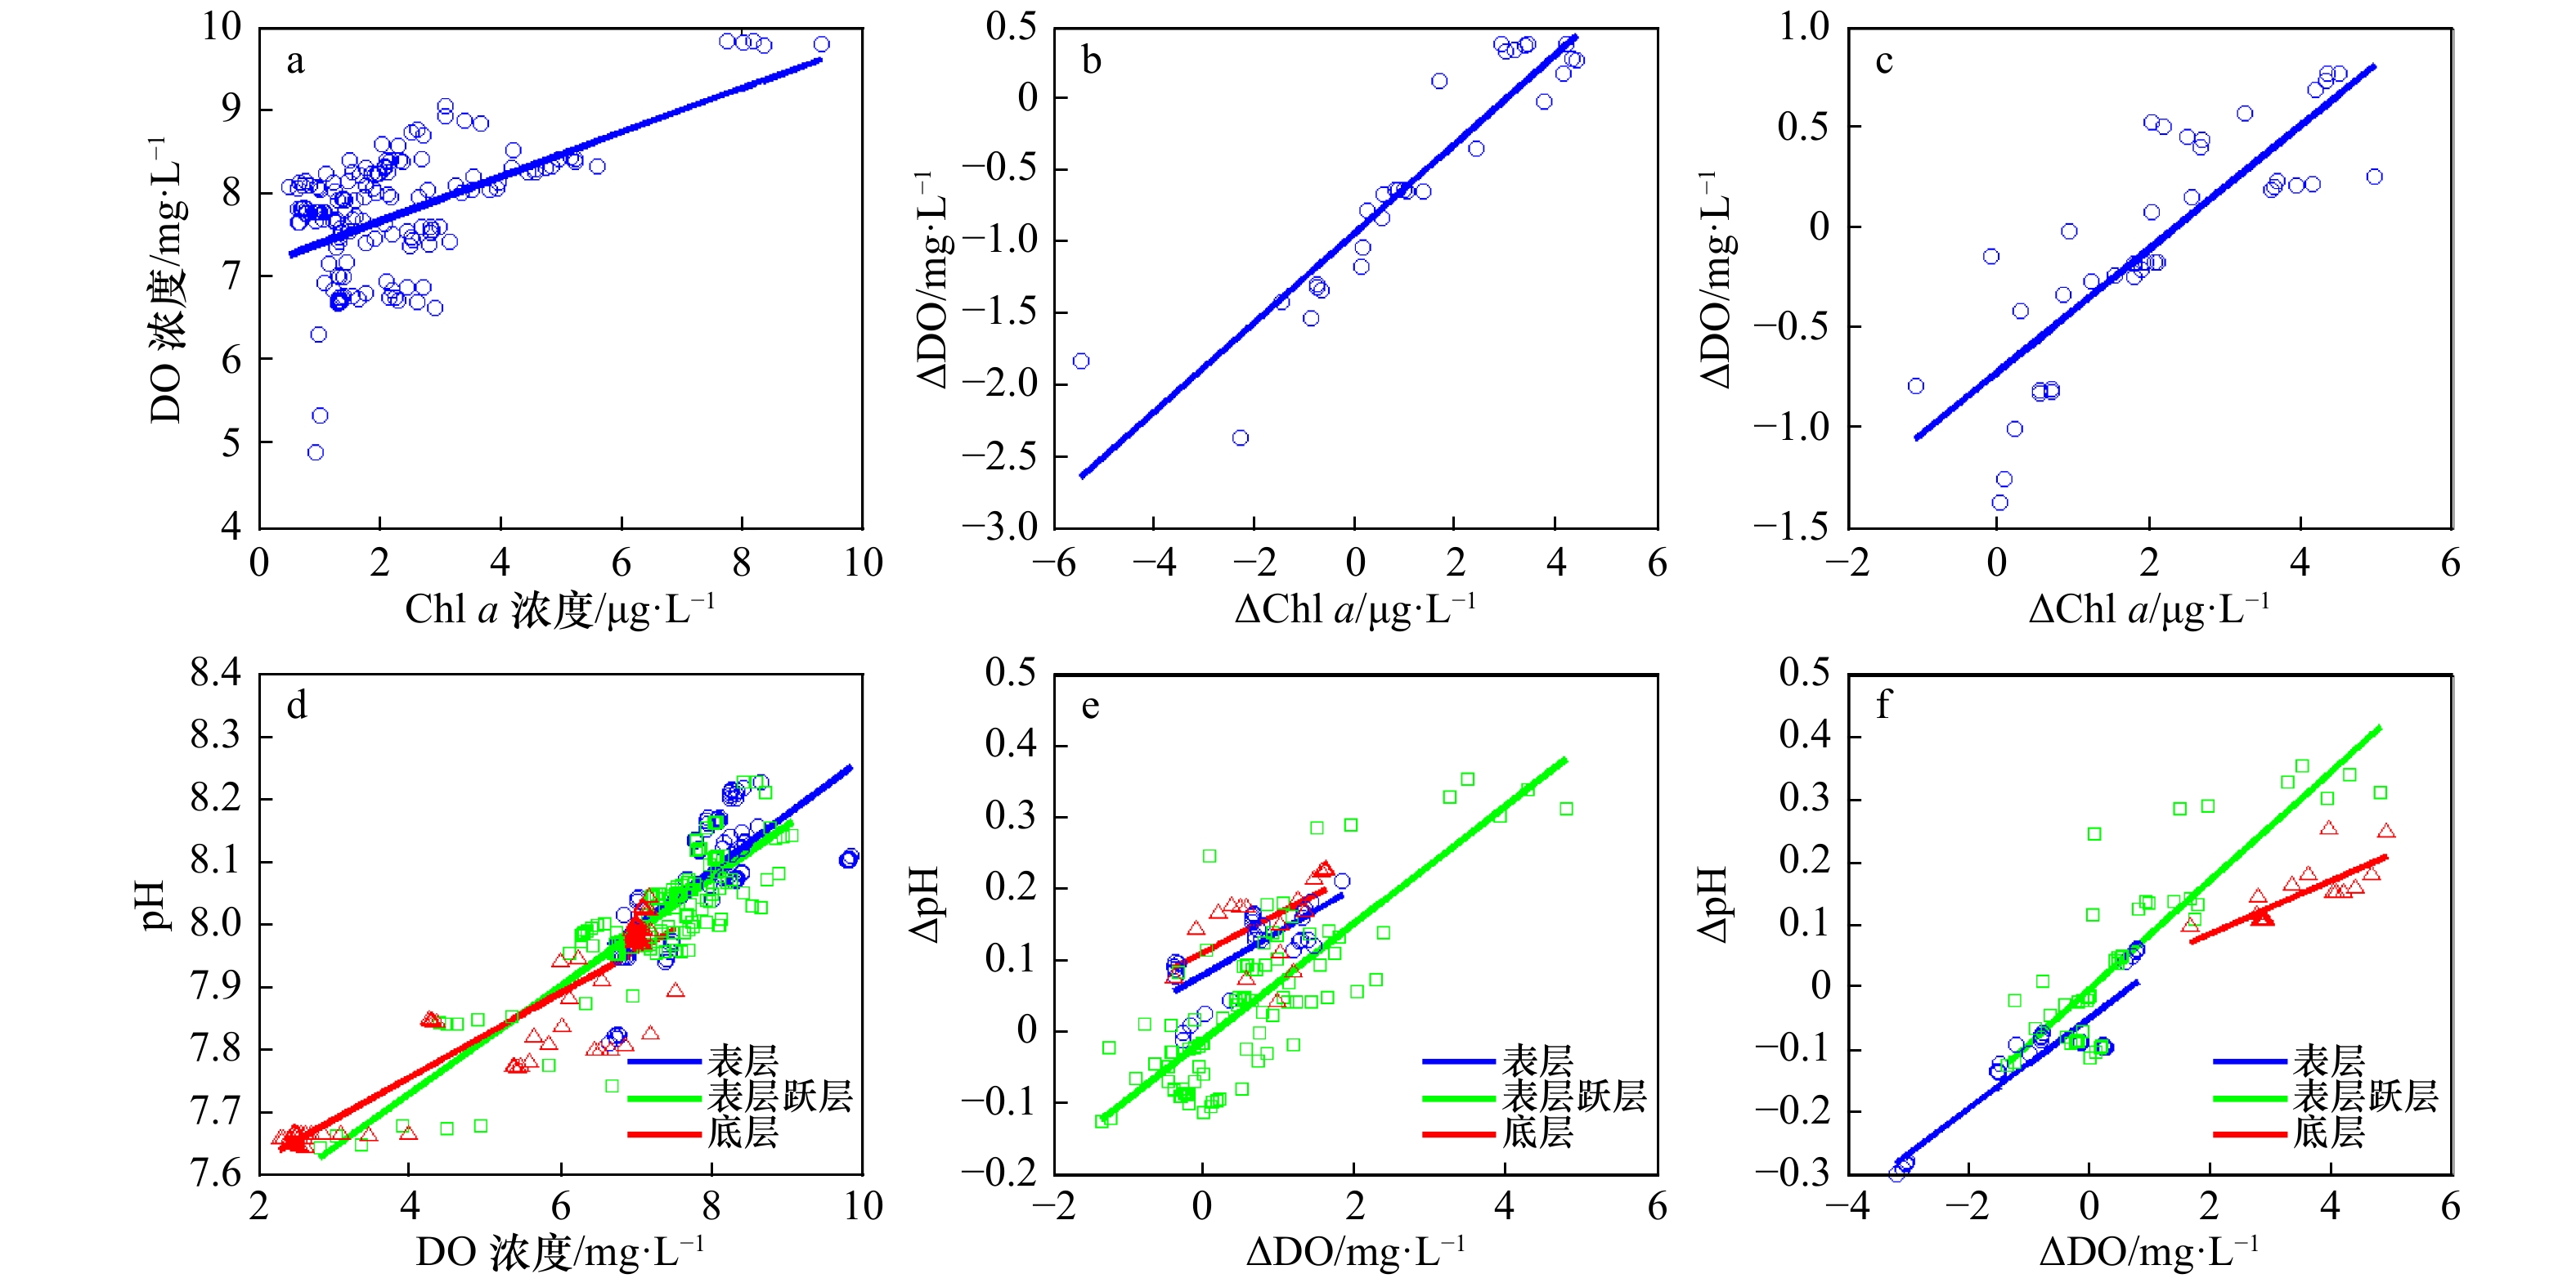
图 8 跃层以上DO和Chl a的相关性分析(a−c);表层、跃层和底层DO和pH的相关性分析(d−f)
a. 6月、7月和8月总DO和总Chl a相关性分析;b−c. 6−7月和7−8月DO和Chl a变化量的相关性分析;d. 6月、7月和8月总DO和总pH相关性分析;e−f. 6−7月和7−8月DO和pH变化量的相关性分析
Fig. 8 Correlation analysis of DO and Chl a above pycnocline (a−c); correlation analysis of DO and pH in surface layer, pycnocline and bottom layer (d−f)
a. The correlation analysis of total DO and total Chl a in June, July and August; b−c. the correlation analysis of changes in DO and Chl a in June to July and July to August; d. the correlation analysis of total DO and total pH in June, July and August; e−f. the correlation analysis of DO and pH change in June to July and July to August
表 1 航次具体信息
Tab. 1 The specific information of the voyage
站位 经纬度 水深/m 采样日期 A1 39.758°N,119.428°E 7 5月26日,6月29日,7月22日,8月22日 A2 39.688°N,119.634°E 16 5月26日,6月27日,7月22日,8月22日 A3 39.618°N,119.840°E 20 6月27日,7月22日,8月22日 A4 39.548°N,120.046°E 26 6月29日,7月22日,8月22日 A5 39.478°N,120.252°E 27 5月24日,6月27日,7月22日,8月22日 A6 39.408°N,120.458°E 23 5月24日,6月27日,7月22日,8月22日 注:水深为5−8月仪器所测得最大值。  下载: 导出CSV
表 2 不同地区耗氧情况以及对应的Chl a和营养盐浓度
Tab. 2 Oxygen consumption and corresponding chlorophyll a and nutrient in different regions
地区 沉积物耗氧速率
/mg·m−2·d−1跃层以下水柱呼吸
耗氧速率/mg·m−3·d−1Chl a
/μg·L−1硝酸盐
/μmol·L−1铵盐
/μmol·L−1磷酸盐
/μmol·L−1硅酸盐
/μmol·L−1文献 长江口 432~768 120~3600 0.1~22 0.1~39.8 4.4~5.3 0~1.93 0.6~70.1 [16-17], [39-40] 俄勒冈州大陆架 102~314 − − 31.5~34.9 0~2.2 2.8~3.2 61.5~62.6 [20] 墨西哥湾北部 352~832 1484~3344 0~30 2.2~6.9 1.1~4.6 0.5~1.2 − [18, 41] 秦皇岛外海 总和:975* 0~7 0.8~4.9 0~5.6 0~0.4 1.3~38.4 本文 注:*表示沉积物和跃层以下水柱呼吸的耗氧速率之和(单位:mg/(m2·d))。
下载: 导出CSV
-
[1] 石强. 北黄海夏季溶解氧与表观耗氧量年际变化时空模态[J]. 应用海洋学报, 2018, 37(1): 9−25.Shi Qiang. Spatio-temporal modes on inter-annual variation of dissolved oxygen and apparent oxygen utilization in summer of the North Yellow Sea[J]. Journal of Applied Oceanography, 2018, 37(1): 9−25. [2] Diaz R J, Rosenberg R. Spreading dead zones and consequences for marine ecosystems[J]. Science, 2008, 321(5891): 926−929. doi: 10.1126/science.1156401 [3] Ekau W, Auel H, Pörtner H O, et al. Impacts of hypoxia on the structure and processes in pelagic communities (zooplankton, macro-invertebrates and fish)[J]. Biogeosciences, 2010, 7(5): 1669−1699. doi: 10.5194/bg-7-1669-2010 [4] Levin L A, Ekau W, Gooday A J, et al. Effects of natural and human-induced hypoxia on coastal benthos[J]. Biogeosciences, 2009, 6(10): 2063−2098. doi: 10.5194/bg-6-2063-2009 [5] Naqvi S W A, Bange H W, Farías L, et al. Marine hypoxia/anoxia as a source of CH4 and N2O[J]. Biogeosciences, 2010, 7(7): 2159−2190. doi: 10.5194/bg-7-2159-2010 [6] Breitburg D, Levin L A, Oschlies A, et al. Declining oxygen in the global ocean and coastal waters[J]. Science, 2018, 359(6371): 7240. doi: 10.1126/science.aam7240 [7] Murphy R R, Kemp W M, Ball W P. Long-term trends in Chesapeake Bay seasonal hypoxia, stratification, and nutrient loading[J]. Estuaries and Coasts, 2011, 34(6): 1293−1309. doi: 10.1007/s12237-011-9413-7 [8] Turner R E, Rabalais N N, Justić D. Predicting summer hypoxia in the northern Gulf of Mexico: Redux[J]. Marine Pollution Bulletin, 2012, 64(2): 319−324. doi: 10.1016/j.marpolbul.2011.11.008 [9] Carstensen J, Conley D J, Bonsdorff E, et al. Hypoxia in the Baltic Sea: biogeochemical cycles, benthic fauna, and management[J]. AMBIO, 2014, 43(1): 26−36. doi: 10.1007/s13280-013-0474-7 [10] Wang Baodong. Hydromorphological mechanisms leading to hypoxia off the Changjiang Estuary[J]. Marine Environmental Research, 2009, 67(1): 53−58. doi: 10.1016/j.marenvres.2008.11.001 [11] Hagy J D, Boynton W R, Keefe C W, et al. Hypoxia in Chesapeake Bay, 1950−2001: long-term change in relation to nutrient loading and river flow[J]. Estuaries, 2004, 27(4): 634−658. doi: 10.1007/BF02907650 [12] Conley D J, Humborg C, Rahm L, et al. Hypoxia in the Baltic Sea and basin-scale changes in phosphorus biogeochemistry[J]. Environmental Science & Technology, 2002, 36(24): 5315−5320. [13] Neretin L N, Volkov I I, Böttcher M E, et al. A sulfur budget for the Black Sea anoxic zone[J]. Deep-Sea Research Part I: Oceanographic Research Papers, 2001, 48(12): 2569−2593. doi: 10.1016/S0967-0637(01)00030-9 [14] 韦钦胜, 王保栋, 于志刚, 等. 夏季长江口外缺氧频发的机制及酸化问题初探[J]. 中国科学: 地球科学, 2017, 60(2): 360−381. doi: 10.1007/s11430-015-5542-8Wei Qinsheng, Wang Baodong, Yu Zhigang, et al. Mechanisms leading to the frequent occurrences of hypoxia and a preliminary analysis of the associated acidification off the Changjiang Estuary in summer[J]. Science China: Earth Sciences, 2017, 60(2): 360−381. doi: 10.1007/s11430-015-5542-8 [15] Yu Liuqian, Fennel K, Laurent A. A modeling study of physical controls on hypoxia generation in the northern Gulf of Mexico[J]. Journal of Geophysical Research: Oceans, 2015, 120(7): 5019−5039. doi: 10.1002/2014JC010634 [16] Zhou Feng, Chai Fei, Huang Daji, et al. Investigation of hypoxia off the Changjiang Estuary using a coupled model of ROMS-CoSiNE[J]. Progress in Oceanography, 2017, 159: 237−254. doi: 10.1016/j.pocean.2017.10.008 [17] Zhang Haiyan, Zhao Liang, Sun Yao, et al. Contribution of sediment oxygen demand to hypoxia development off the Changjiang Estuary[J]. Estuarine, Coastal and Shelf Science, 2017, 192: 149−157. doi: 10.1016/j.ecss.2017.05.006 [18] Lehrter J C, Beddick D L Jr, Devereux R, et al. Sediment-water fluxes of dissolved inorganic carbon, O2, nutrients, and N2 from the hypoxic region of the Louisiana continental shelf[J]. Biogeochemistry, 2012, 109(1): 233−252. [19] McCarthy M J, Carini S A, Liu Zhanfei, et al. Oxygen consumption in the water column and sediments of the northern Gulf of Mexico hypoxic zone[J]. Estuarine, Coastal and Shelf Science, 2013, 123: 46−53. doi: 10.1016/j.ecss.2013.02.019 [20] Reimers C E, Özkan-Haller H T, Berg P, et al. Benthic oxygen consumption rates during hypoxic conditions on the Oregon continental shelf: Evaluation of the eddy correlation method[J]. Journal of Geophysical Research: Oceans, 2012, 117(C2): C02021. [21] Li Chenglong, Zhai Weidong. Decomposing monthly declines in subsurface-water pH and aragonite saturation state from spring to autumn in the North Yellow Sea[J]. Continental Shelf Research, 2019, 185: 37−50. doi: 10.1016/j.csr.2018.11.003 [22] 刘喜惠, 刘方, 丁页, 等. 渤海环流对近岸海域无机氮分布特征的影响[J]. 中国环境监测, 2019(6): 78−84.Liu Xihui, Liu Fang, Ding Ye, et al. Influence of circulation on the distribution characteristics of inorganic nitrogen in the Bohai Coastal Sea[J]. Environmental Monitoring in China, 2019(6): 78−84. [23] Zhou Feng, Huang Daji, Xue Huijie, et al. Circulations associated with cold pools in the Bohai Sea on the Chinese continental shelf[J]. Continental Shelf Research, 2017, 137: 25−38. doi: 10.1016/j.csr.2017.02.005 [24] Li Yanfang, Wolanski E, Zhang Hua. What processes control the net currents through shallow straits? A review with application to the Bohai Strait, China[J]. Estuarine, Coastal and Shelf Science, 2015, 158: 1−11. doi: 10.1016/j.ecss.2015.03.013 [25] Lin Xiapei, Xie Shangping, Chen Xinping, et al. A well-mixed warm water column in the central Bohai Sea in summer: Effects of tidal and surface wave mixing[J]. Journal of Geophysical Research: Oceans, 2006, 111(C11): C11017. doi: 10.1029/2006JC003504 [26] 周锋, 黄大吉, 苏纪兰. 夏季渤海温跃层下的双中心冷水结构的数值模拟[J]. 科学通报, 2009, 54(11): 1591−1599. doi: 10.1360/csb2009-54-11-1591Zhou Feng, Huang Daji, Su Jilan. Numerical simulation of the dual-core structure of the Bohai Sea bottom water in summer[J]. Chinese Science Bulletin, 2009, 54(11): 1591−1599. doi: 10.1360/csb2009-54-11-1591 [27] Wei Qinsheng, Wang Baodong, Yao Qingzhen, et al. Spatiotemporal variations in the summer hypoxia in the Bohai Sea (China) and controlling mechanisms[J]. Marine Pollution Bulletin, 2019, 138: 125−134. doi: 10.1016/j.marpolbul.2018.11.041 [28] 石强. 渤海夏季溶解氧与表观耗氧量年际变化时空模态[J]. 应用海洋学学报, 2016, 35(2): 243−255. doi: 10.3969/J.ISSN.2095-4972.2016.02.014Shi Qiang. Spatio-temporal mode for inter-annual change of dissolved oxygen and apparent oxygen utilization in summer Bohai Sea[J]. Journal of Applied Oceanography, 2016, 35(2): 243−255. doi: 10.3969/J.ISSN.2095-4972.2016.02.014 [29] 翟惟东, 赵化德, 郑楠, 等. 2011年夏季渤海西北部、北部近岸海域的底层耗氧与酸化[J]. 科学通报, 2012, 57(9): 753−758. doi: 10.1360/csb2012-57-9-753Zhai Weidong, Zhao Huade, Zheng Nan, et al. Coastal acidification in summer bottom oxygen-depleted waters in northwestern-northern Bohai Sea from June to August in 2011[J]. Chinese Science Bulletin, 2012, 57(9): 753−758. doi: 10.1360/csb2012-57-9-753 [30] 张华, 李艳芳, 唐诚, 等. 渤海底层低氧区的空间特征与形成机制[J]. 科学通报, 2016, 61(14): 1612−1620. doi: 10.1360/N972015-00915Zhang Hua, Li Yanfang, Tang Cheng, et al. Spatial characteristics and formation mechanisms of bottom hypoxia zone in the Bohai Sea during summer[J]. Chinese Science Bulletin, 2016, 61(14): 1612−1620. doi: 10.1360/N972015-00915 [31] Zhao Huade, Kao S J, Zhai Weidong, et al. Effects of stratification, organic matter remineralization and bathymetry on summertime oxygen distribution in the Bohai Sea, China[J]. Continental Shelf Research, 2017, 134: 15−25. doi: 10.1016/j.csr.2016.12.004 [32] Zhai Weidong, Zhao Huade, Su Jilan, et al. Emergence of summertime hypoxia and concurrent carbonate mineral suppression in the central Bohai Sea, China[J]. Journal of Geophysical Research: Biogeosciences, 2019, 124(9): 2768−2785. doi: 10.1029/2019JG005120 [33] 赵骞, 陈玥, 陈元, 等. 秦皇岛海域海流特征及规模化养殖对其影响的观测研究[J]. 海洋学报, 2019(6): 23−36.Zhao Qian, Chen Yue, Chen Yuan, et al. Current characteristics and its response to large-scale mariculture in Qinhuangdao coastal area based on in-situ observation[J]. Haiyang Xuebao, 2019(6): 23−36. [34] Song Guisheng, Zhao Liang, Chai Fei, et al. Summertime oxygen depletion and acidification in Bohai Sea, China[J]. Frontiers in Marine Science, 2020, 7: 252. doi: 10.3389/fmars.2020.00252 [35] Gill A E. Atmosphere-Ocean Dynamics[M]. London: Academic Press, 1982. [36] 石晓勇, 陆茸, 张传松, 等. 长江口邻近海域溶解氧分布特征及主要影响因素[J]. 中国海洋大学学报, 2006, 36(2): 287−290, 294.Shi Xiaoyong, Lu Rong, Zhang Chuansong, et al. Distribution and main influence factors process of dissolved oxygen in the adjacent area of the Changjiang Estuary in autumn[J]. Journal of Ocean University of China, 2006, 36(2): 287−290, 294. [37] 张莹莹, 张经, 吴莹, 等. 长江口溶解氧的分布特征及影响因素研究[J]. 环境科学, 2007, 28(8): 1649−1654. doi: 10.3321/j.issn:0250-3301.2007.08.001Zhang Yingying, Zhang Jing, Wu Ying, et al. Characteristics of dissolved oxygen and its affecting factors in the Yangtze Estuary[J]. Environmental Science, 2007, 28(8): 1649−1654. doi: 10.3321/j.issn:0250-3301.2007.08.001 [38] 高小丰, 吴莹, 朱卓毅. 长江口外浮游植物死亡释放溶解有机质的降解及其溶氧消耗[J]. 海洋与湖沼, 2015, 46(5): 1010−1017.Gao Xiaofeng, Wu Ying, Zhu Zhuoyi. Degradation of dissolved organic matter from dead phytoplankton off the Changjiang River Estuary and the resulting dissolved oxygen consumption[J]. Oceanologia et Limnologia Sinica, 2015, 46(5): 1010−1017. [39] 王奎, 陈建芳, 金海燕, 等. 长江口及邻近海域营养盐四季分布特征[J]. 海洋学研究, 2011, 29(3): 18−35. doi: 10.3969/j.issn.1001-909X.2011.03.004Wang Kui, Chen Jianfang, Jin Haiyan, et al. The four seasons nutrients distribution in Changjiang River Estuary and its adjacent East China Sea[J]. Journal of Marine Sciences, 2011, 29(3): 18−35. doi: 10.3969/j.issn.1001-909X.2011.03.004 [40] Zhu Zhuoyi, Hu Jun, Song Guodong, et al. Phytoplankton-driven dark plankton respiration in the hypoxic zone off the Changjiang Estuary, revealed by in vitro incubations[J]. Journal of Marine Systems, 2016, 154: 50−56. doi: 10.1016/j.jmarsys.2015.04.009 [41] Murrell C M, Lehrter C J. Sediment and lower water column oxygen consumption in the seasonally hypoxic region of the Louisiana continental shelf[J]. Estuaries and Coasts, 2011, 34(5): 912−924. doi: 10.1007/s12237-010-9351-9 [42] Fu Yanzhao, Xu Shiguo, Liu Jianwei. Temporal-spatial variations and developing trends of Chlorophyll-a in the Bohai Sea, China[J]. Estuarine, Coastal and Shelf Science, 2016, 173: 49−56. doi: 10.1016/j.ecss.2016.02.016 [43] Xu Xin, Yu Zhiming, He Liyan, et al. Nano- and microphytoplankton community characteristics in brown tide bloom-prone waters of the Qinhuangdao coast, Bohai Sea, China[J]. Science China: Earth Sciences, 2017, 60(6): 1189−1200. doi: 10.1007/s11430-017-9036-0 -

 点击查看大图
计量
- 文章访问数: 221
- HTML全文浏览量: 40
- PDF下载量: 30
- 被引次数: 0
