

The distribution and controlling factors of the concentration and structure of dissolved inorganic nutrients in the Shenhu Area, northern South China Sea
-
摘要: 生源要素是海洋初级生产的基础,其在海洋环境中的循环受到多种物理、化学和生物过程的影响,对其浓度分布、结构特点及影响因素的认识是理解海洋生态系统动力学的基础。于2019年2月在南海北部神狐海域进行了现场考察和海水样品采集,对海水中的溶解态无机营养盐浓度进行了分析,并结合温度、盐度、叶绿素a(Chl a)、pH和溶解氧(DO)等水文环境参数,研究了神狐海域海水中营养盐浓度与结构的分布特征及影响因素等。在0~30 m的海水中各营养盐浓度均很低,随着深度的增加,营养盐浓度逐渐增大。在水深3 000 m左右处,无机氮、磷酸盐和硅酸盐浓度分别达到了38.02 μmol/L、2.71 μmol/L和149.07 μmol/L。温度、pH和DO与各营养盐浓度均具有显著的相关性,表明环境因素影响着营养盐的生物地球化学过程。此外,在75 m深度,研究区域东北方向的站位营养盐浓度相对较低,并呈现向西南方向逐渐增大的变化趋势,可能与高温、高盐和低营养盐的黑潮水入侵有关。根据端元混合模型计算所得保守混合浓度与实测值的差值显示,在75 m深度硅酸盐和磷酸盐以生物消耗为主,而硝酸盐存在添加。随磷酸盐浓度增加,各站位无机氮浓度呈线性升高,但硅酸盐浓度则以幂函数式升高,表明不同营养盐之间再生速率和再利用效率有所不同。神狐海域的N/P比与Si/N比和Si/P比呈现出截然相反的变化趋势。在0~30 m,N/P比较小而Si/N比和Si/P比较大;在75 m,受不同生物作用影响,N/P比变大,Si/N比和Si/P比变小;在75 m以下N/P比逐渐降低至14.44,而Si/N比和Si/P比则逐渐升高;在1 000 m以下,各营养盐比例均保持稳定。氮异常指数的计算结果显示,神狐海域300 m以上的海水中固氮作用强于反硝化作用,而300 m以下反硝化作用增强。神狐海域营养盐浓度与结构的分布特征表明黑潮入侵和生物活动显著影响了此区域营养盐的生物地球化学过程。Abstract: Biogenic elements are the basis of primary production in marine systems. Their cycles in marine environments are affected by various physical, chemical, and biological processes. Understanding the concentration distribution, structural characteristics, and influencing factors of biogenic elements are essential to understand the dynamics of marine ecosystems. In February 2019, a field investigation was conducted in the Shenhu Area of the northern South China Sea and seawater samples were collected to analyze dissolved inorganic nutrients. Combined with the hydrological environment parameters, such as temperature, salinity, chlrophyll a (Chl a), pH and dissolved oxygen (DO), the distribution and controlling factor of nutrient concentration and structure in the Shenhu Area were discussed. Concentrations of each nutrient in the seawaters from 0 m to 30 m were very low, and the nutrient concentrations gradually increased with the increase of depth. At the depth of about 3 000 m, the concentrations of dissolved inorganic nitrogen (DIN), phosphate and silicate reached 38.02 μmol/L, 2.71 μmol/L and 149.07 μmol/L, respectively. Temperature, pH and DO were significantly correlated with nutrients, indicating that environmental factors greatly affected the biogeochemical processes of nutrients. In addition, the concentration of nutrients in the northeast direction of the study area at a depth of 75 m was relatively low and showed a gradual increasing trend in the southwest direction, which may be related to the intrusion of Kuroshio water with high temperature, high salinity and low nutrients. Meanwhile, the difference between the conservative mixing concentrations calculated based on an end-member mixing model and the measured values of nutrients showed that, at 75 m depth, silicate and phosphate were consumed by biological activities, while nitrates were controlled by biological addition. With the increase of phosphate, the DIN at each site increased linearly, but the silicate increased with a power function, indicating that the regeneration rate and recycling efficiency were different for different nutrients. The ratios of N/P in the Shenhu Area showed opposite trends compared with the ratios of Si/N and Si/P. At 0−30 m, the N/P ratios were low and the Si/N and Si/P ratios were high. At 75 m, the N/P ratios increased along with the decrease of Si/N and Si/P ratios possibly because of different biological effects. Below 75 m, the N/P ratios gradually decreased to 14.44, while the Si/N and Si/P ratios gradually increased. All nutrient ratios remained stable below 1 000 m. The calculation results of the N−anomaly showed that nitrogen fixation in seawater above 300 m was stronger than denitrification, and denitrification below 300 m was enhanced. The distribution characteristics of the concentration and structure of nutrients in the Shenhu Area indicated that the Kuroshio intrusion and biological activities significantly affected the biogeochemical process of nutrients in this area.
-
Key words:
- Shenhu Area /
- nutrients /
- concentration /
- structure /
- controlling factors
-

图 2 神狐海域水文环境参数和营养盐的垂直分布
Fig. 2 Vertical distributions of hydrological parameters and nutrients in the Shenhu Area
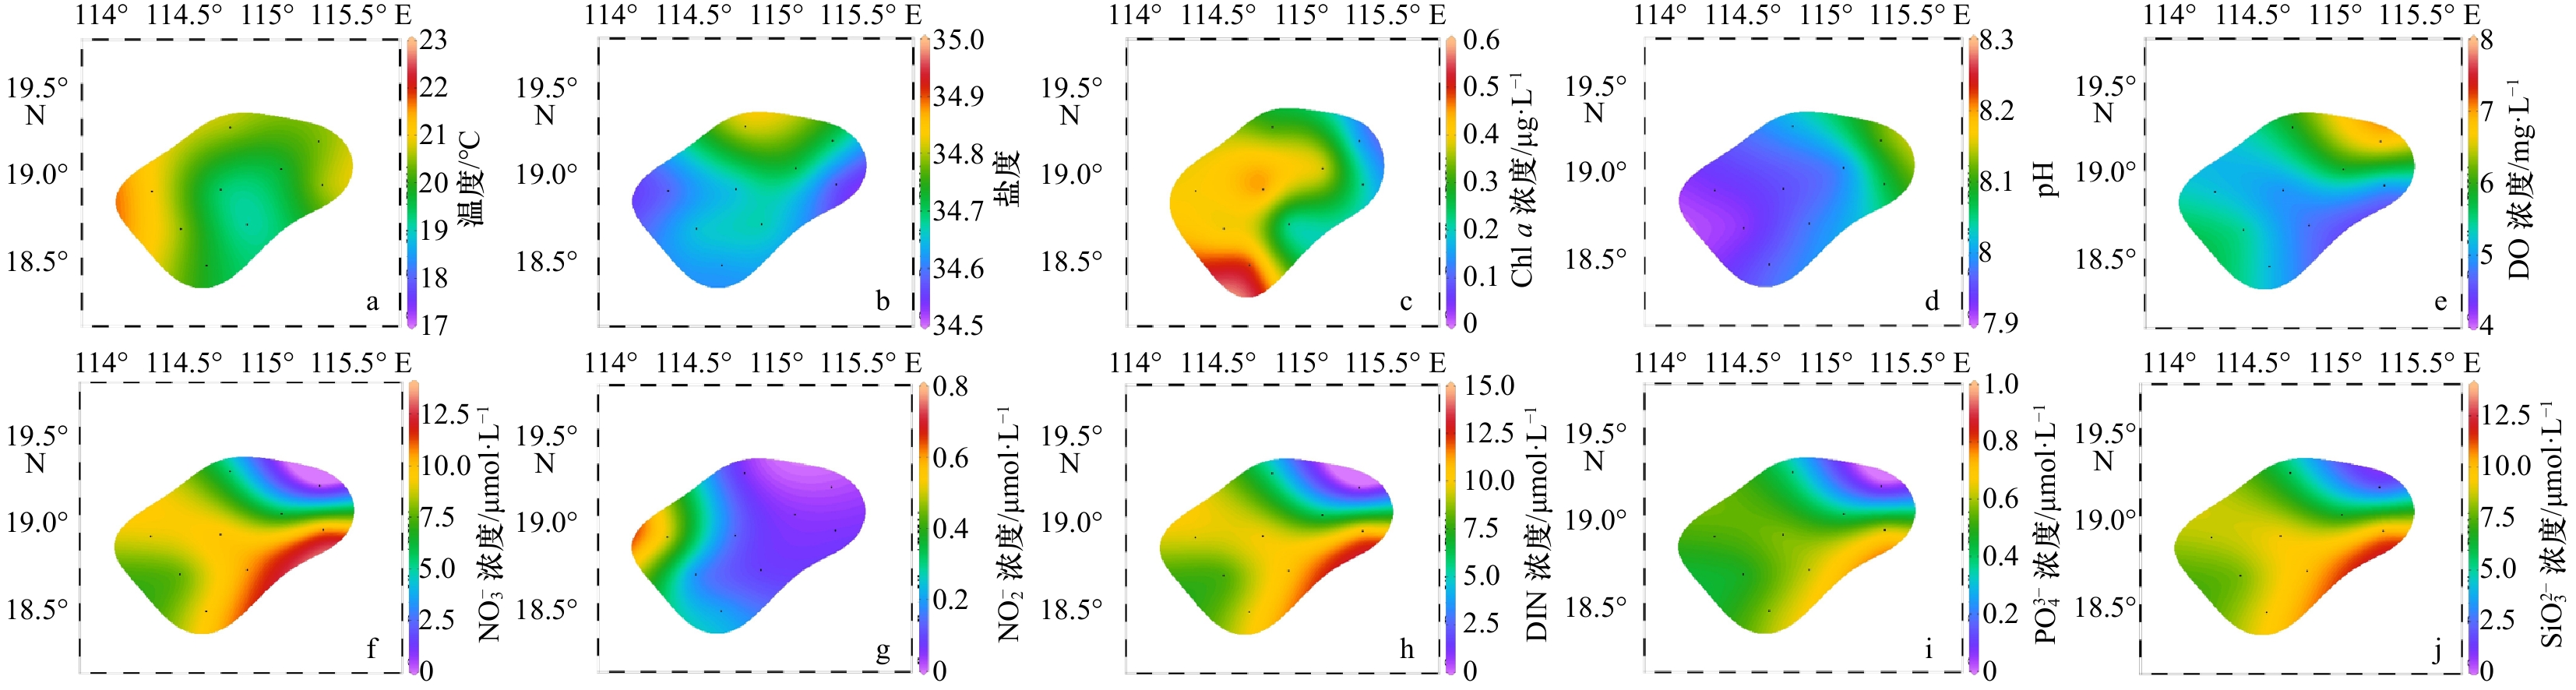
图 3 神狐海域75 m深度水文环境参数和营养盐的水平分布
Fig. 3 Horizontal distributions of hydrological parameters and nutrients at 75 m depth in the Shenhu Area
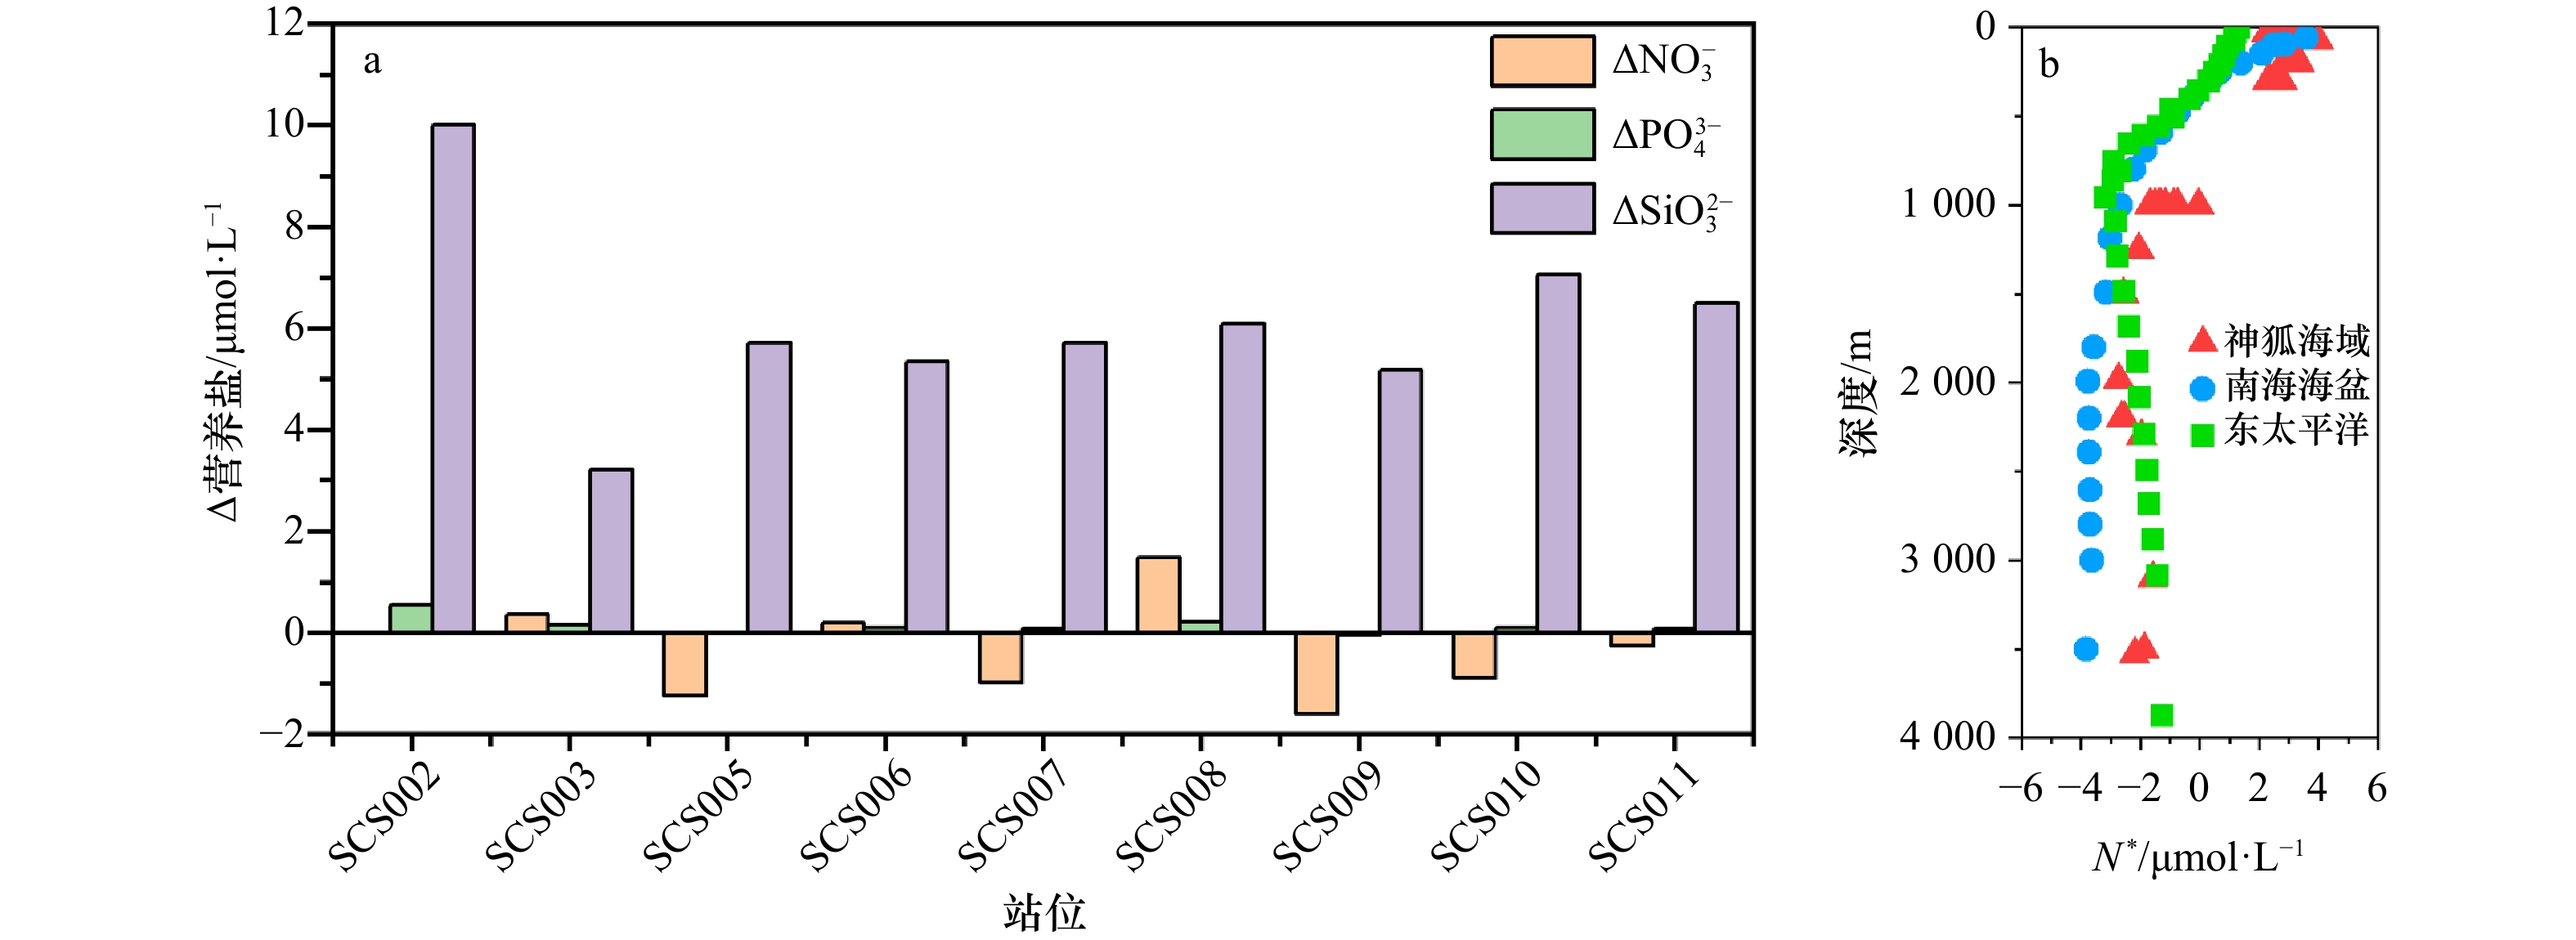
图 4 神狐海域75 m深度的Δ营养盐(a)和N*(b)的垂直分布
Fig. 4 Δnutrient at 75 m depth (a) and vertical distribution of N* (b) in the Shenhu Area

图 5 神狐海域营养盐比例的垂直分布(a. N/P,b. Si/N,c. Si/P,黑色虚线代表Redfield比值[1])和75 m深度的水平分布(d. N/P,e. Si/N,f. Si/P)
Fig. 5 Vertical distribution of nutrient ratios (a. N/P, b. Si/N, c. Si/P, black dotted line represents the Redfield ratio[1]) and horizontal distributions of nutrient ratios at 75 m depth (d. N/P, e. Si/N, f. Si/P) in the Shenhu Area
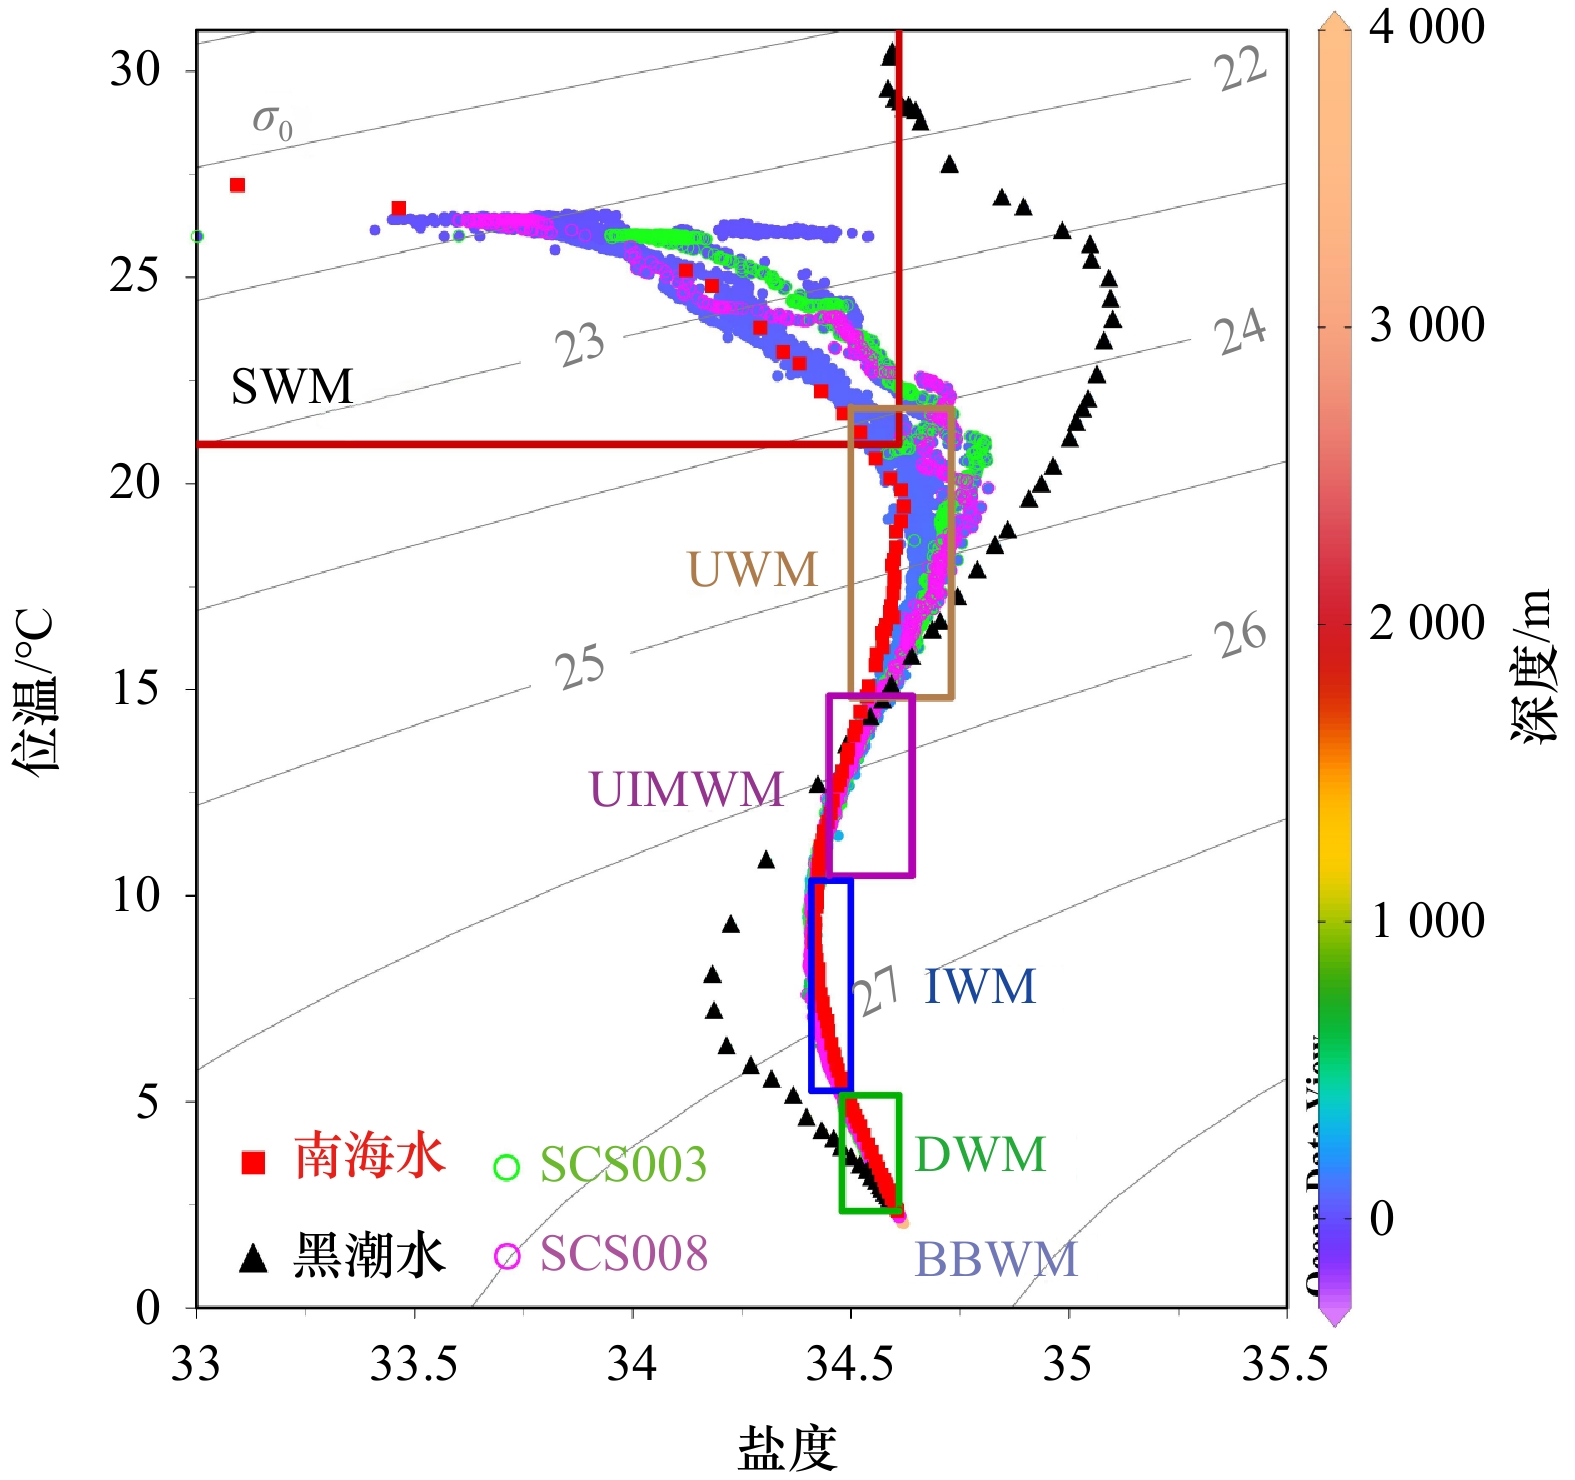
图 6 神狐海域位温−盐度点聚图
等值线为海水密度σ0(单位:kg/m3),由ODV软件计算得到。红色正方形代表南海水(14°12′44″N,114°0′47″E),黑色三角形代表黑潮水(18°2′34″N,123°57′32″E),数据源自中国Argo实时资料中心(www.argo.org.cn);SWM代表南海表层水团;UWM代表南海次表层水团,UIMWM代表南海次–中层混合水团,IWM代表南海中层水团,DWM代表南海深层水团,BBWM代表南海底盆水团
Fig. 6 Temperature-Salinity diagrams of the Shenhu Area
The contour line is the seawater density σ0 in kg/m3, calculated by ODV software. The red square represents the South China Sea water (14°12′44″N, 114°0′47″E), and the black triangle represents the Kurishio water (18°2′34″N, 123°57′32″E), data from China Argo Real-time Data Center (www.argo.org.cn);SWM represents surface water mass, UWM represents subsurface water mass, UIMWM represents subsurface-intermediate mixed water mass, IWM represents intermediate water mass, DWM represents deep water mass, BBWM represents bottom basin water mass

图 7 神狐海域营养盐与基础水文参数的相关性(**代表p<0.01)
Fig. 7 Correlation between nutrient and hydrological parameters in the Shenhu Area (**: represents p<0.01)
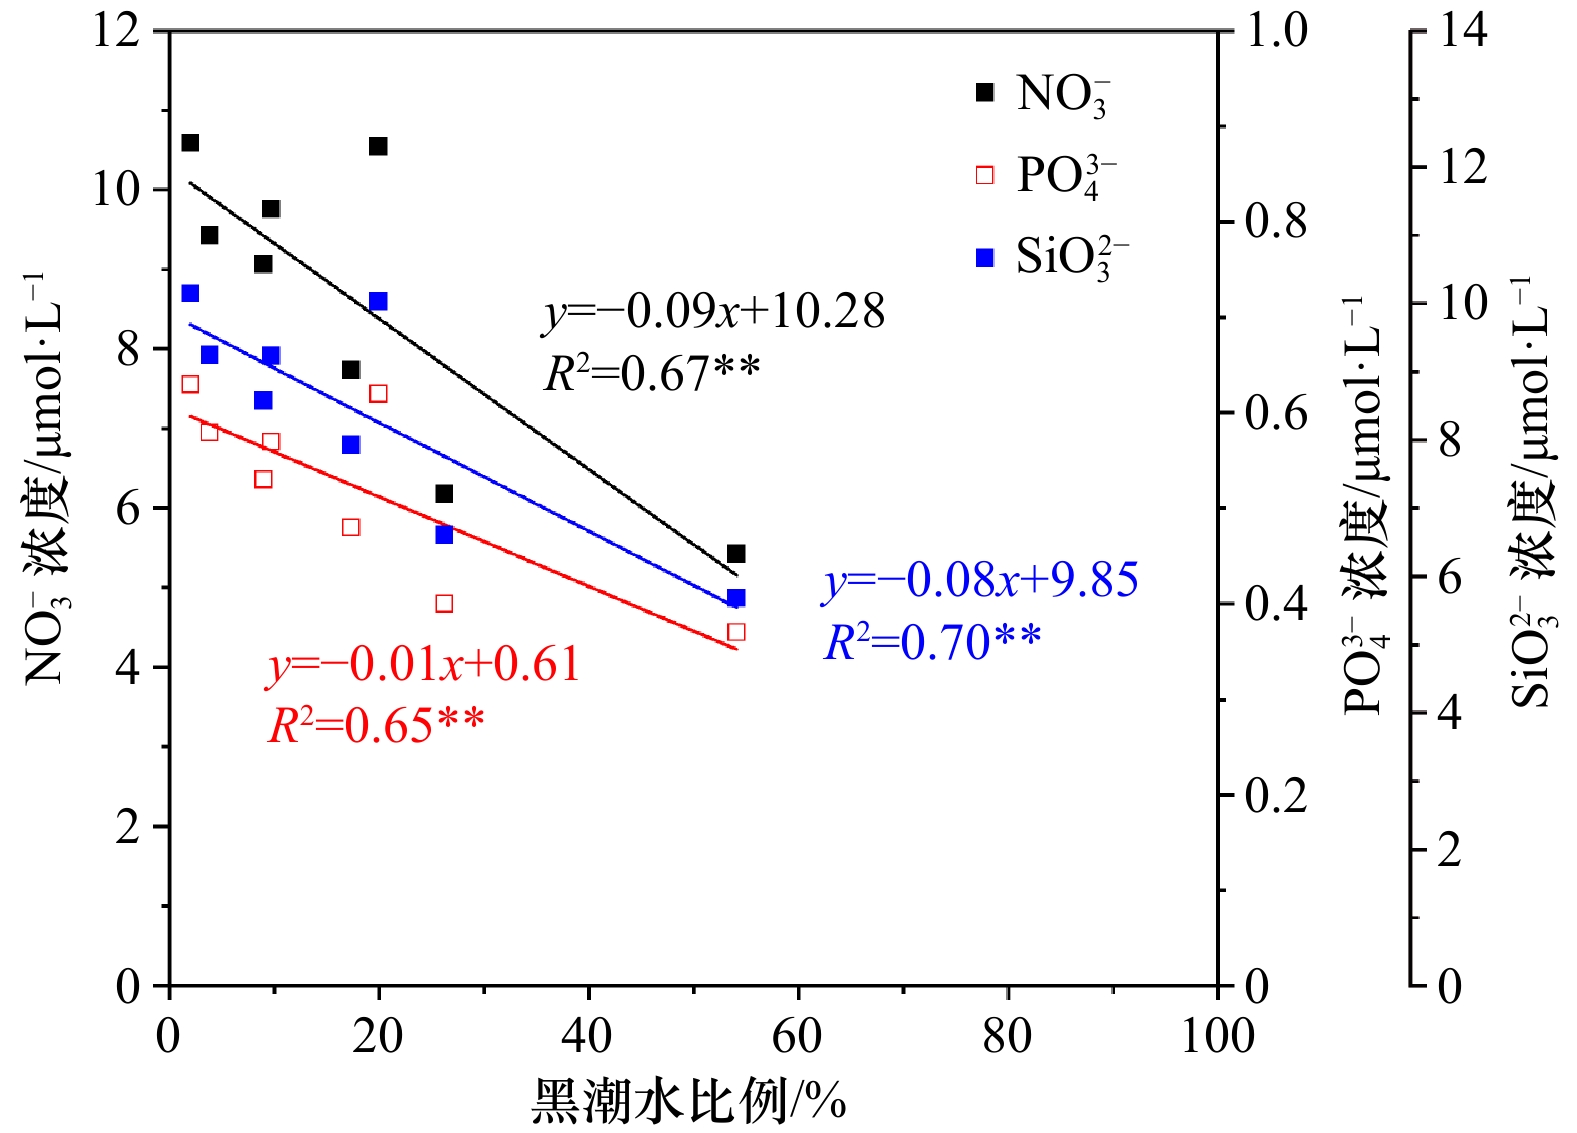
图 8 神狐海域75 m深度黑潮水比例与营养盐的相关性(**代表p<0.01)
Fig. 8 Correlation between nutrients and Kuroshio water fraction at 75 m depth of the Shenhu Area (** represents p<0.01)
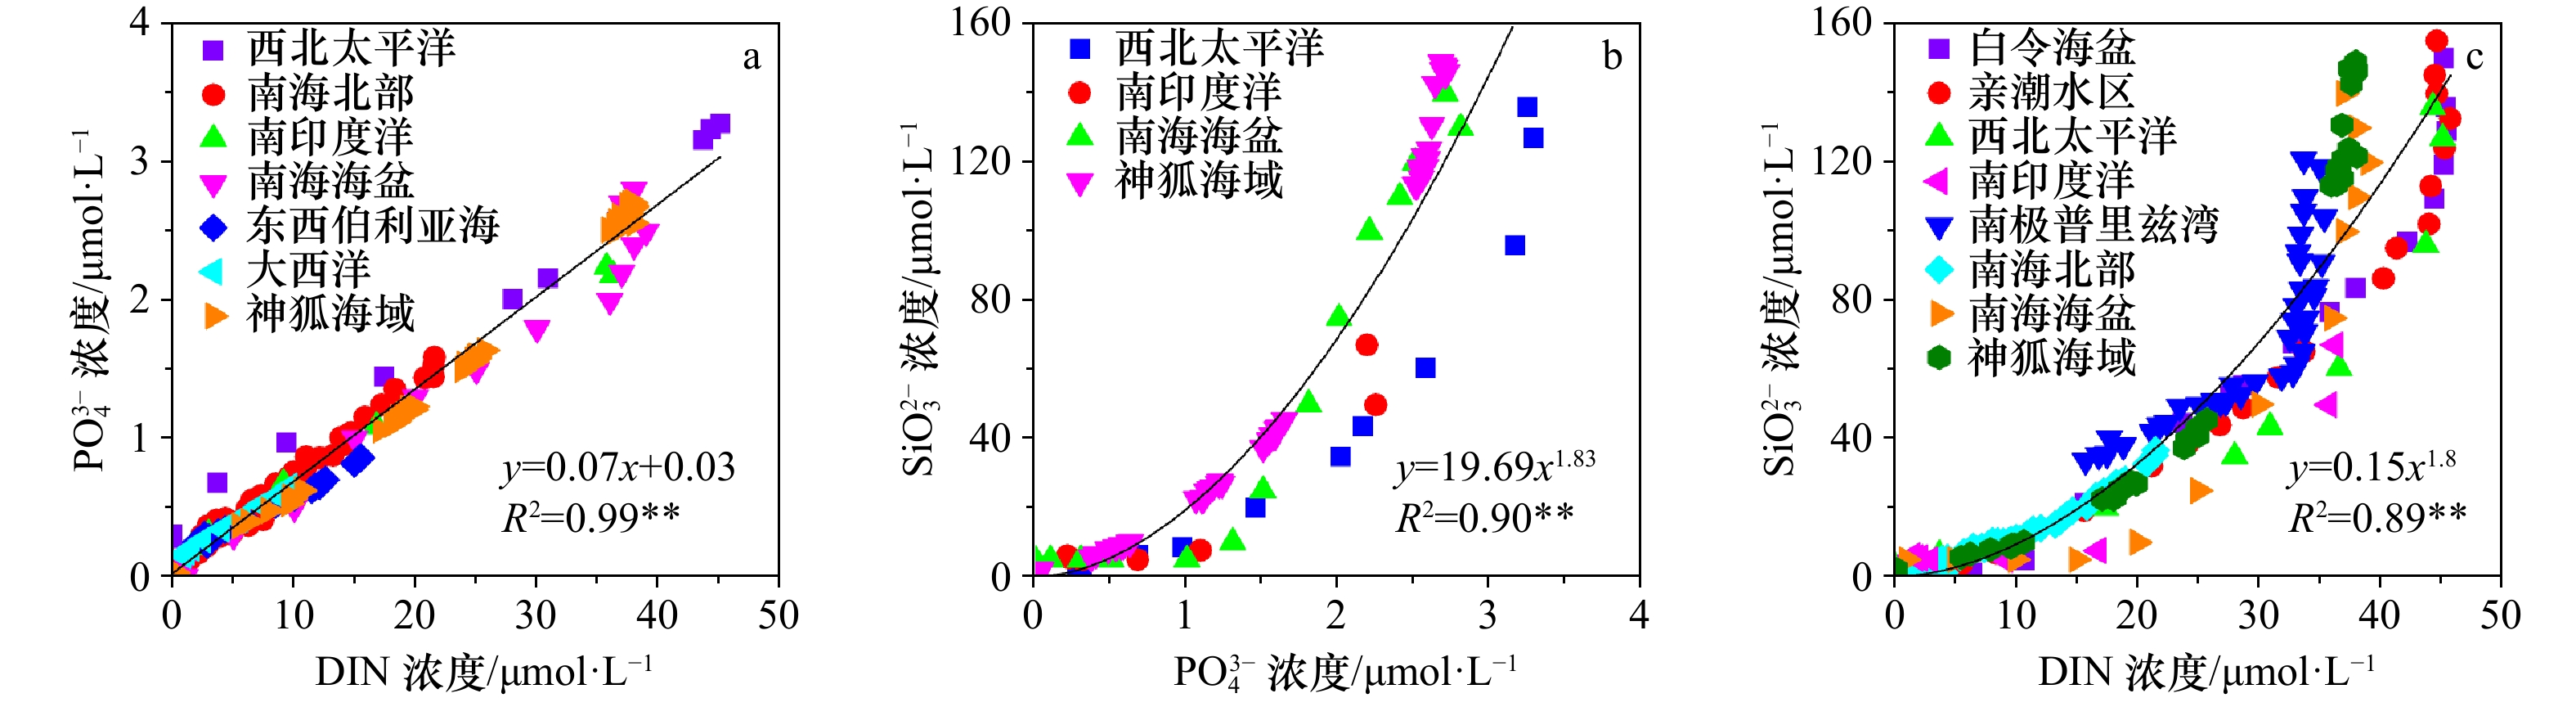
图 9 神狐海域营养盐之间的关系(**代表p<0.01)
Fig. 9 Relationships between nutrients in the Shenhu Area (** represents p<0.01)
表 1 神狐海域中黑潮水比例(%)
Tab. 1 Kuroshio water fraction in the Shenhu Area (%)
采样深度 SCS002 SCS003 SCS005 SCS006 SCS007 SCS008 SCS009 SCS010 SCS011 平均值 5 m 23.60 14.80 12.23 13.94 11.96 6.91 7.94 9.41 15.84 12.96 30 m 27.40 25.15 3.44 5.94 − 18.30 3.62 1.35 8.01 11.65 75 m 27.18 54.05 9.00 17.33 9.71 26.19 1.96 19.91 3.83 18.80 200 m − − − − − − − − − − 300 m − − − − 1.83 − − − 1.06 1.44 1 000 m 17.82 11.98 13.61 8.27 7.69 16.46 18.36 4.92 15.05 12.68 底层 − − − − − − − − − − 注:−表示无数据。  下载: 导出CSV
-
[1] Redfield A C, Ketchum B, Richards F. The influence of organisms on the composition of seawater[M]//The Sea, Vol. 2, The Composition of Sea-Water Comparative and Descriptive Oceanography. New York: Interscience Publishers, 1963: 26−77. [2] Deutsch C, Weber T. Nutrient ratios as a tracer and driver of ocean biogeochemistry[J]. Annual Review of Marine Science, 2012, 4: 113−141. doi: 10.1146/annurev-marine-120709-142821 [3] Du Chuanjun, Liu Zhiyu, Kao S J, et al. Impact of the Kuroshio intrusion on the nutrient inventory in the upper northern South China Sea: insights from an isopycnal mixing model[J]. Biogeosciences, 2013, 10(10): 6419−6432. doi: 10.5194/bg-10-6419-2013 [4] Wang Lei, Wu Shiguo, Li Qingping, et al. Architecture and development of a multi-stage Baiyun submarine slide complex in the Pearl River Canyon, northern South China Sea[J]. Geo-Marine Letters, 2014, 34(4): 327−343. doi: 10.1007/s00367-014-0372-4 [5] Zhu Chaoqi, Cheng Sheng, Li Qingping, et al. Giant submarine landslide in the South China Sea: evidence, causes and implications[J]. Journal of Marine Science and Engineering, 2019, 7(5): 152. doi: 10.3390/jmse7050152 [6] Zhang Haiqi, Yang Shengxiong, Wu Nengyou, et al. Successful and surprising results for China's first gas hydrate drilling expedition[J]. Fire in the Ice: Methane Hydrate Newsletter, 2007, 7(3): 6−9. [7] Wu Nengyou, Zhang Haiqi, Yang Shengxiong, et al. Gas hydrate system of Shenhu area, northern South China Sea: geochemical results[J]. Journal of Geological Research, 2011, 2011: 370298. [8] Cai Weijun, Dai Minhan, Wang Yongchen, et al. The biogeochemistry of inorganic carbon and nutrients in the Pearl River estuary and the adjacent northern South China Sea[J]. Continental Shelf Research, 2004, 24(12): 1301−1319. doi: 10.1016/j.csr.2004.04.005 [9] Kaiser D, Unger D, Qiu Guanglong, et al. Natural and human influences on nutrient transport through a small subtropical Chinese estuary[J]. Science of the Total Environment, 2013, 450−451: 92−107. doi: 10.1016/j.scitotenv.2013.01.096 [10] Wong G T F, Pan Xiaoju, Li Kuoyuan, et al. Hydrography and nutrient dynamics in the northern South China Sea Shelf-sea (NoSoCS)[J]. Deep-Sea Research Part II: Topical Studies in Oceanography, 2015, 117: 23−40. doi: 10.1016/j.dsr2.2015.02.023 [11] Chen C T A, Wang Shulun, Wang B J, et al. Nutrient budgets for the South China Sea Basin[J]. Marine Chemistry, 2001, 75(4): 281−300. doi: 10.1016/S0304-4203(01)00041-X [12] Fang Guohong, Fang Wendong, Fang Yue, et al. A survey of studies on the South China Sea upper ocean circulation[J]. Acta Oceanographica Taiwanica, 1998, 37(1): 1−16. [13] Qu Tangdong, Girton J B, Whitehead J A. Deepwater overflow through Luzon Strait[J]. Journal of Geophysical Research: Oceans, 2006, 111(C1): C01002. [14] Nan Feng, Xue Huijie, Yu Fei. Kuroshio intrusion into the South China Sea: a review[J]. Progress in Oceanography, 2015, 137: 314−333. doi: 10.1016/j.pocean.2014.05.012 [15] Winkler L W. Die bestimmung des im wasser gelösten sauerstoffes[J]. Berichte der Deutschen Chemischen Gesellschaft, 1888, 21(2): 2843−2854. doi: 10.1002/cber.188802102122 [16] Morris A W, Riley J P. The determination of nitrate in sea water[J]. Analytica Chimica Acta, 1963, 29: 272−279. doi: 10.1016/S0003-2670(00)88614-6 [17] Bendschneider K, Robinson R J. A new spectrophotometric method for the determination of nitrite in sea water[J]. Journal of Marine Research, 1952, 11(8): 87−96. [18] Catalano G. An improved method for the determination of ammonia in seawater[J]. Marine Chemistry, 1987, 20(3): 289−295. doi: 10.1016/0304-4203(87)90079-X [19] Murphy J, Riley J P. A modified single solution method for the determination of phosphate in natural waters[J]. Analytica Chimica Acta, 1962, 27: 31−36. doi: 10.1016/S0003-2670(00)88444-5 [20] Koroleff F. Determination of urea[C]//Grasshoff K, Ehrhardt M, Kremling K. Methods of Seawater Analysis. New York: Verlag Chemie, 1983: 158−162. [21] Deutsch C, Gruber N, Key R M, et al. Denitrification and N2 fixation in the Pacific Ocean[J]. Global Biogeochemical Cycles, 2001, 15(2): 483−506. doi: 10.1029/2000GB001291 [22] Wong G T F, Tseng C M, Wen L S, et al. Nutrient dynamics and N-anomaly at the SEATS station[J]. Deep-Sea Research Part II: Topical Studies in Oceanography, 2007, 54(14/15): 1528−1545. [23] 李磊, 李凤岐, 苏洁, 等. 1998年夏、冬季南海水团分析[J]. 海洋与湖沼, 2002, 33(4): 393−401. doi: 10.3321/j.issn:0029-814X.2002.04.008Li Lei, Li Fengqi, Su Jie, et al. Analysis on water masses in the South China Sea in summer and winter of 1998[J]. Oceanologia et Limnologia Sinica, 2002, 33(4): 393−401. doi: 10.3321/j.issn:0029-814X.2002.04.008 [24] Nan Feng, Xue Huijie, Chai Fei, et al. Identification of different types of Kuroshio intrusion into the South China Sea[J]. Ocean Dynamics, 2011, 61(9): 1291−1304. doi: 10.1007/s10236-011-0426-3 [25] 姚鹏, 陈霖, 傅亮, 等. 南海三沙永乐龙洞营养盐垂直分布及控制因素[J]. 科学通报, 2018, 63(23): 2393−2402. doi: 10.1360/N972018-00155Yao Peng, Chen Lin, Fu Liang, et al. Controls on vertical nutrient distributions in the Sansha Yongle Blue Hole, South China Sea[J]. Chinese Science Bulletin, 2018, 63(23): 2393−2402. doi: 10.1360/N972018-00155 [26] Koike I, Ogawa H, Nagata T, et al. Silicate to nitrate ratio of the upper sub-Arctic Pacific and the Bering Sea Basin in summer: its implication for phytoplankton dynamics[J]. Journal of Oceanography, 2001, 57(3): 253−260. doi: 10.1023/A:1012474327158 [27] Vance D, de Souza G F, Zhao Ye, et al. The relationship between zinc, its isotopes, and the major nutrients in the North-East Pacific[J]. Earth and Planetary Science Letters, 2019, 525: 115748. doi: 10.1016/j.jpgl.2019.115748 [28] Louanchi F, Najjar R G. Annual cycles of nutrients and oxygen in the upper layers of the North Atlantic Ocean[J]. Deep-Sea Research Part II: Topical Studies in Oceanography, 2001, 48(10): 2155−2171. doi: 10.1016/S0967-0645(00)00185-5 [29] 倪建宇, 王方国, 姚旭莹, 等. 南印度洋海区营养盐的分布特征[J]. 现代地质, 2011, 25(2): 322−331. doi: 10.3969/j.issn.1000-8527.2011.02.016Ni Jianyu, Wang Fangguo, Yao Xuying, et al. Nutrients distribution in the South Indian Ocean[J]. Geoscience, 2011, 25(2): 322−331. doi: 10.3969/j.issn.1000-8527.2011.02.016 [30] 陈兴群, 陈其焕, 庄亮钟. 南海中部叶绿素a分布和光合作用及其与环境因子的关系[J]. 海洋学报, 1989, 11(3): 349−355.Chen Xingqun, Chen Qihuan, Zhuang Liangzhong. Distribution and photosynthesis of chlorophyll a and its relationship with environmental factors in the central South China Sea[J]. Haiyang Xuebao, 1989, 11(3): 349−355. [31] 马威, 孙军. 夏、冬季南海北部浮游植物群落特征[J]. 生态学报, 2014, 34(3): 621−632.Ma Wei, Sun Jun. Characteristics of phytoplankton community in the northern South China Sea in summer and winter[J]. Acta Ecologica Sinica, 2014, 34(3): 621−632. [32] 刘洋. 南海次表层、中层水团结构及其运动学特征的研究[D]. 青岛: 中国海洋大学, 2010.Liu Yang. Study on the strucrures and the kinetics characteristics for the subsurface and intermediate water masses in the South China Sea[D]. Qingdao: Ocean University of China, 2010. [33] 李登辉. 南海北部陆坡区水团分析[D]. 上海: 上海交通大学, 2017.Li Denghui. Analysis of water masses on the northern slope of the South China Sea[D]. Shanghai: Shanghai Jiao Tong University, 2017. [34] Cai Weijun, Hu Xinping, Huang W J, et al. Acidification of subsurface coastal waters enhanced by eutrophication[J]. Nature Geoscience, 2011, 4(11): 766−770. doi: 10.1038/ngeo1297 [35] Tréguer P J, De La Rocha C L. The world ocean silica cycle[J]. Annual Review of Marine Science, 2013, 5: 477−501. doi: 10.1146/annurev-marine-121211-172346 [36] Han Aiqin, Dai Minhan, Kao S J, et al. Nutrient dynamics and biological consumption in a large continental shelf system under the influence of both a river plume and coastal upwelling[J]. Limnology and Oceanography, 2012, 57(2): 486−502. doi: 10.4319/lo.2012.57.2.0486 [37] Humborg C, Geibel M C, Anderson L G, et al. Sea-air exchange patterns along the central and outer East Siberian Arctic Shelf as inferred from continuous CO2, stable isotope, and bulk chemistry measurements[J]. Global Biogeochemical Cycles, 2017, 31(7): 1173−1191. doi: 10.1002/2017GB005656 [38] 陈际雨, 韩正兵, 扈传昱, 等. 南极普里兹湾营养盐分布特征及季节性消耗[J]. 极地研究, 2017, 29(3): 327−337.Chen Jiyu, Han Zhengbing, Hu Chuanyu, et al. Distribution and seasonal depletion of nutrients in Prydz Bay, Antarctica[J]. Chinese Journal of Polar Research, 2017, 29(3): 327−337. [39] Hurd D C. Physical and Chemical Properties of Siliceous Skeletons[M]. London, UK: Academic Press, 1983: 189−244. [40] Wu Meilin, Liu Qinyan, Dong Junde, et al. Primary nitrite maximum in the euphotic layer near the Xisha Islands, South China Sea[J]. Aquatic Ecosystem Health & Management, 2015, 18(4): 414−423. [41] Gilson H C. The Nitrogen Cycle, the John Murray Expedition, 1933−1934[M]. London: British Museum (Natural History), 1937: 21−81. [42] Brandhorst W. Nitrification and denitrification in the eastern tropical North Pacific[J]. ICES Journal of Marine Science, 1959, 25(1): 3−20. doi: 10.1093/icesjms/25.1.3 [43] Lam P, Jensen M M, Kock A, et al. Origin and fate of the secondary nitrite maximum in the Arabian Sea[J]. Biogeosciences, 2011, 8(2): 1565−1577. [44] Buchwald C, Santoro A E, Stanley R H R, et al. Nitrogen cycling in the secondary nitrite maximum of the eastern tropical North Pacific off Costa Rica[J]. Global Biogeochemical Cycles, 2015, 29(12): 2061−2081. doi: 10.1002/2015GB005187 [45] Brauer V S, Stomp M, Huisman J. The nutrient-load hypothesis: patterns of resource limitation and community structure driven by competition for nutrients and light[J]. The American Naturalist, 2012, 179(6): 721−740. doi: 10.1086/665650 [46] Wu Jingfeng, Chung S W, Wen L S, et al. Dissolved inorganic phosphorus, dissolved iron, and Trichodesmium in the oligotrophic South China Sea[J]. Global Biogeochemical Cycles, 2003, 17(1): 8−1. [47] Justić D, Rabalais N N, Turner R E. Stoichiometric nutrient balance and origin of coastal eutrophication[J]. Marine Pollution Bulletin, 1995, 30(1): 41−46. doi: 10.1016/0025-326X(94)00105-I [48] 李丹阳, 张润. 南海水域生物固氮作用研究进展[J]. 厦门大学学报:自然科学版, 2018, 57(6): 760−767.Li Danyang, Zhang Run. Research progresses in biological nitrogen fixation in the South China Sea[J]. Journal of Xiamen University: Natural Science, 2018, 57(6): 760−767. -

计量
- 文章访问数: 688
- HTML全文浏览量: 125
- PDF下载量: 53
- 被引次数: 0
