

A general regression neural network approach to reconstruct global 1°×1° resolution sea surface pCO2
-
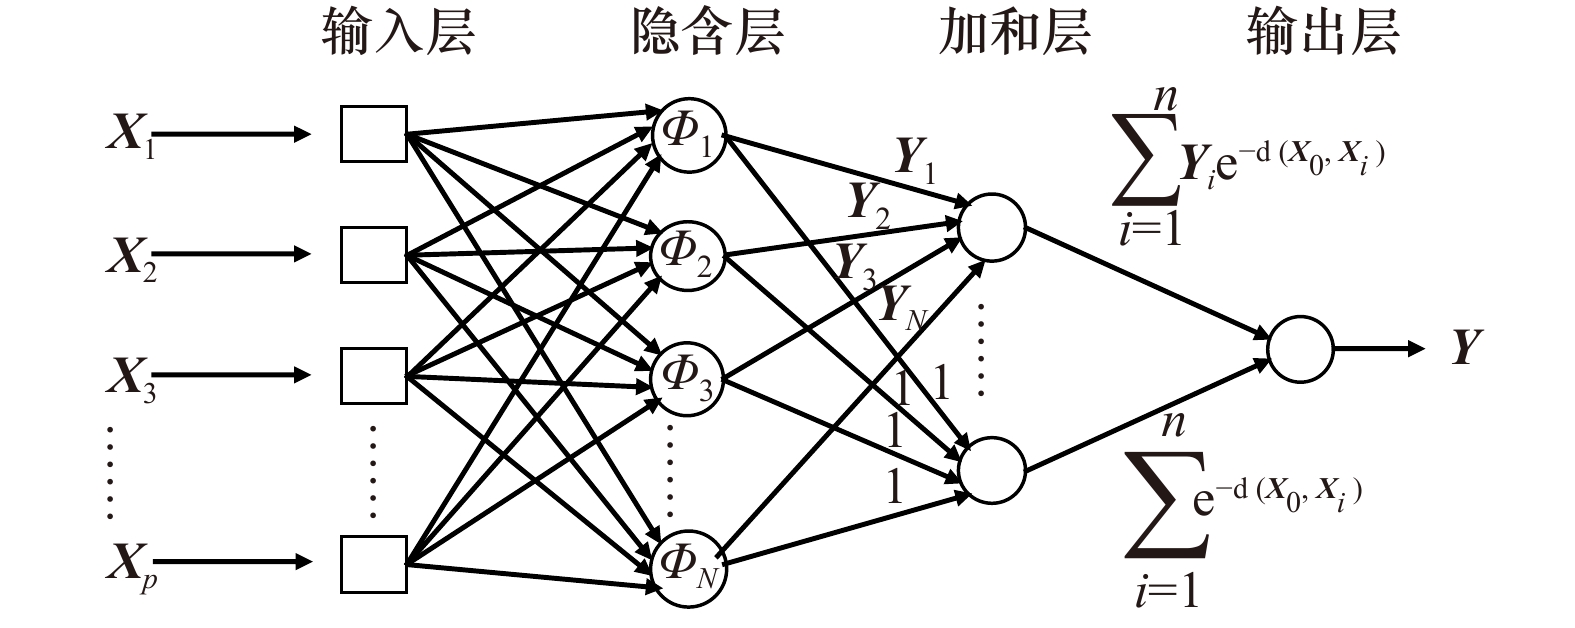
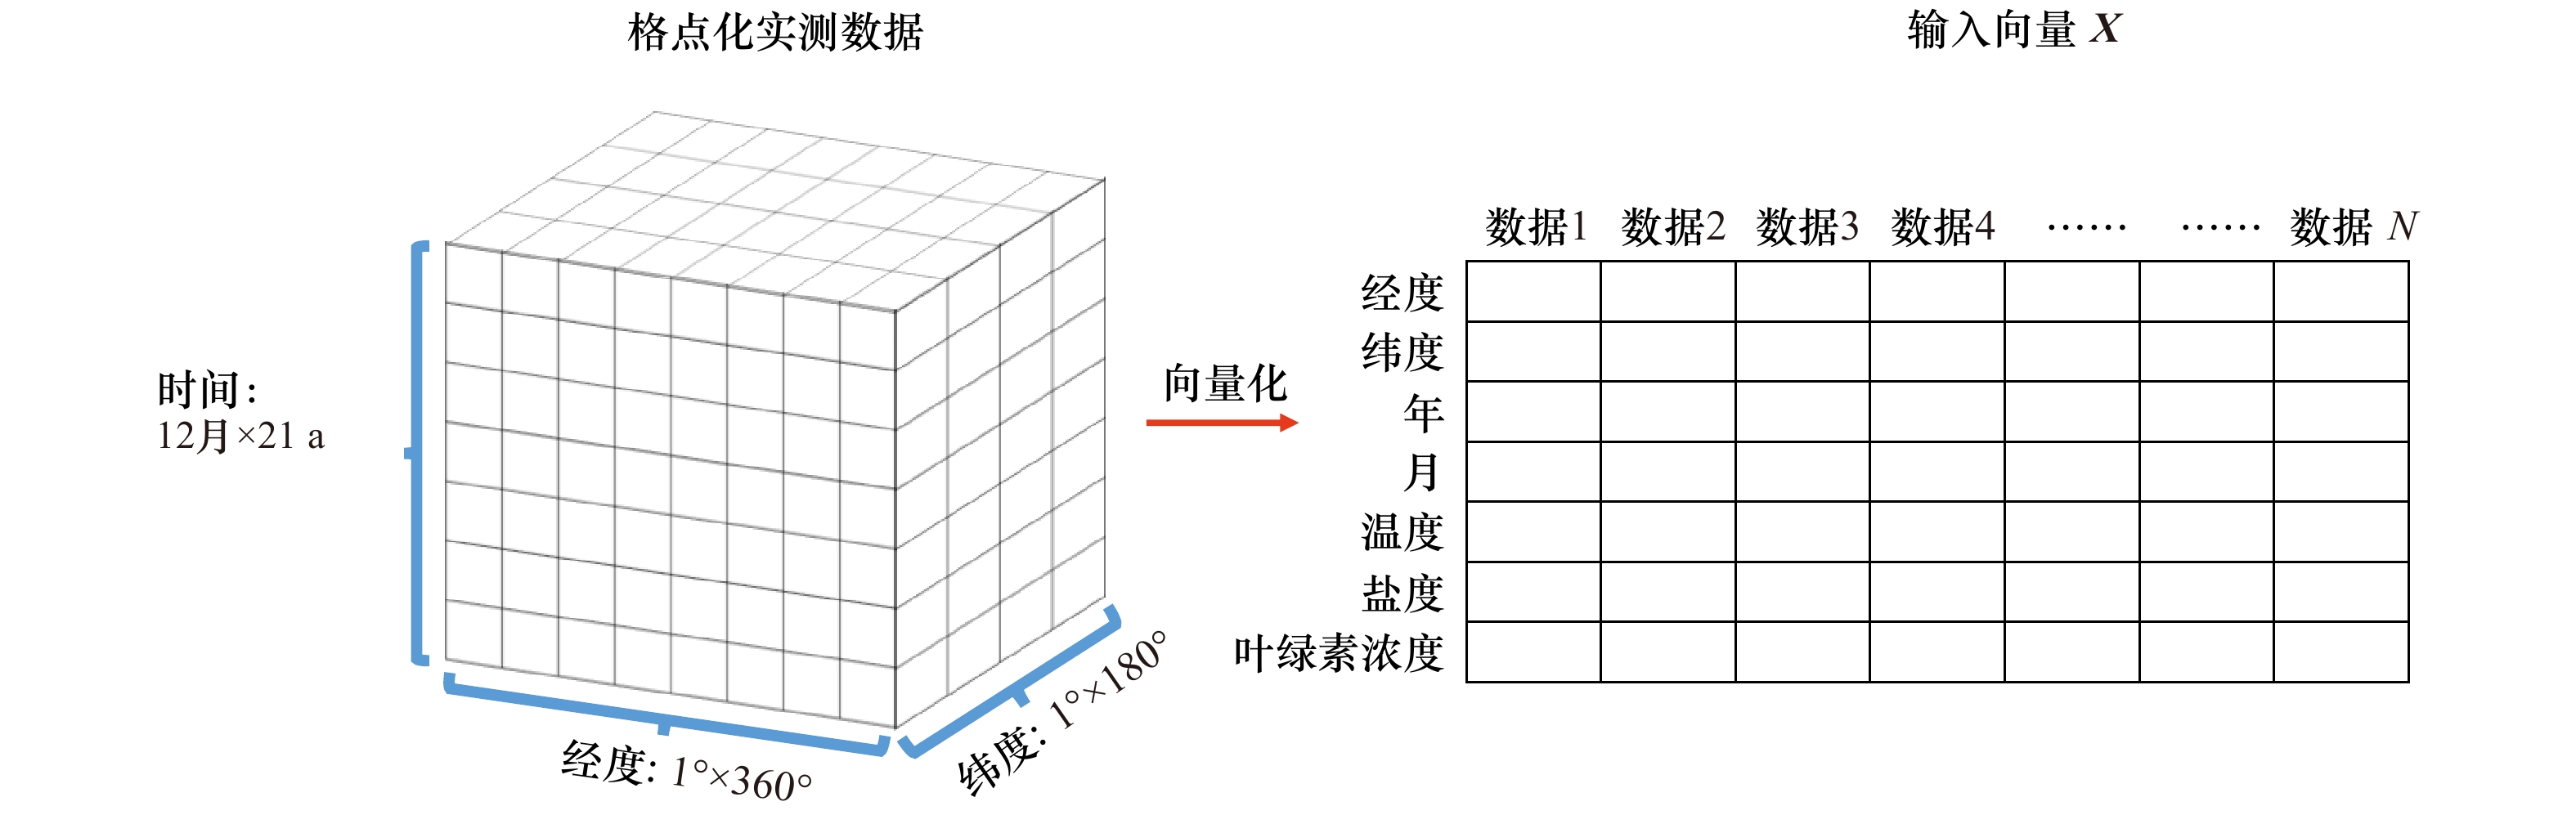
摘要: 表层海水二氧化碳分压是评估海洋碳源汇强度的关键参数,但其实测数据较少、时空分布极不均匀,导致二氧化碳交换通量的估算有很大的不确定性,海洋源汇特征就不能确切获取。为了解决这个难题,在收集的表层大洋二氧化碳地图(Surface Ocean CO2 Atlas,SOCAT)实测数据集基础上,运用广义回归神经网络建立二氧化碳分压与经纬度、时间、温度、盐度和叶绿素浓度间的非线性关系,构建了1998−2018年间全球1°×1°经纬度的表层海水二氧化碳分压格点数据,其标准误差为16.93 μatm,平均相对误差为2.97%,优于现有研究中的前反馈神经网络、自组织映射神经网络和机器学习算法等方法。根据构建的数据所绘制的全球表层海水二氧化碳分压的分布与现有研究有较好的一致性。
-
关键词:
- 广义回归神经网络 /
- 表层海水二氧化碳分压 /
- 全球大洋格点数据
Abstract: Sea surface partial pressure of carbon dioxide (pCO2) is a crucial parameter for estimating ocean carbon source and sink term, but its sparse and uneven in situ measurements in space and time lead to large uncertainty in the estimate of sea-air CO2 flux and characteristics of ocean carbon source and sink. To eliminate this uncertainty, a general regression neural network approach using the Surface Ocean CO2 Atlas (SOCAT) dataset, based on the non-liner regression of pCO2 and longitude, latitude, time, temperature, salinity and concentration of chlorophyll, was successfully used in the reconstruction of global 1°×1° resolution monthly sea surface pCO2 from 1998 to 2018, with a root mean square error (RMSE) of 16.93 μatm and a mean relative error (MRE) of 2.97%, lower than existing feed-forward neural network (FFNN), self-organizing neural network (SOM) and machine learning approaches. The global distribution of pCO2 obtained by this approach agrees well with existing researches. -
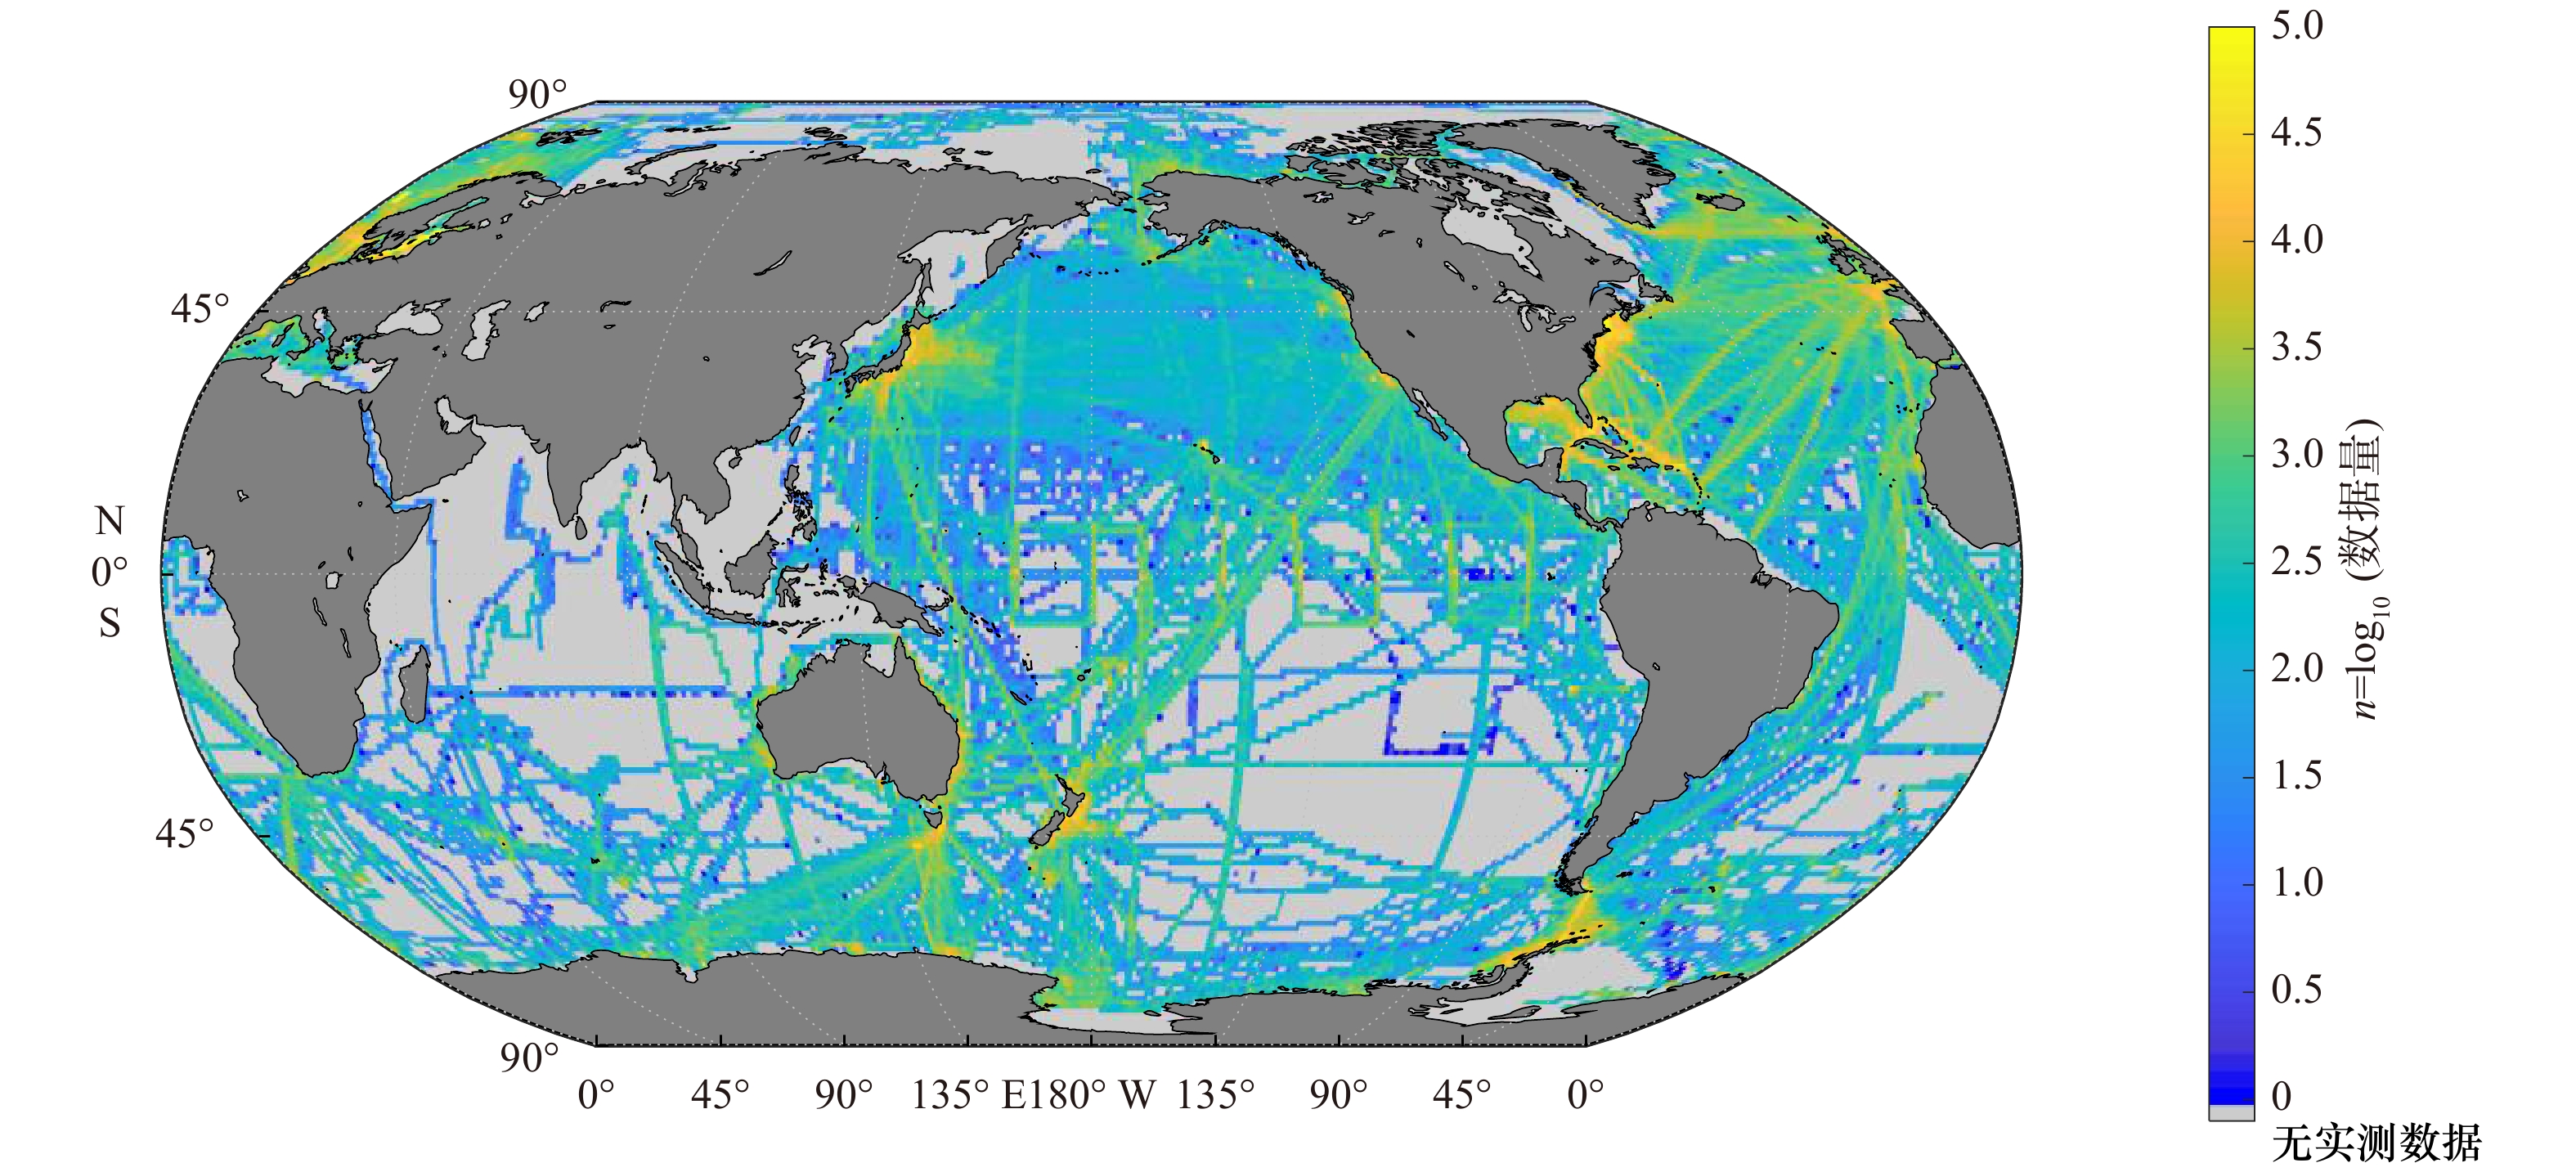
图 1 1998–2018年间SOCAT二氧化碳分压数据分布情况
Fig. 1 Spatial distribution of pCO2 observations in SOCAT dataset from 1998 to 2018

图 2 SOCAT pCO2实测数据时间分布
Fig. 2 Temporal distribution of pCO2 observations in SOCAT dataset

图 6 GRNN与实测值及其他神经网络方法同时间点pCO2数据结果对比
Fig. 6 Comparation of pCO2 distribution between in situ measurements, GRNN and other approaches

表 1 数据来源
Tab. 1 Data source
参数 时间范围 分辨率 数据来源 pCO2 1957−2018年 − Surface Ocean CO2 Atlas (https://www.socat.info/) 盐度 1940−2018年 1°×1° IAP, Global Ocean Heat Content Change (http://159.226.119.60/cheng/) 叶绿素 1997−2019年 1°×1° European Service for Ocean Colour, Globcolour Project (http://www.globcolour.info/) 温度 1981−2019年 0.25°×0.25° NOAA OI SST V2 High Resolution Dataset (https://www.esrl.noaa.gov/psd/data/gridded/data.noaa.oisst.v2.highres.html)  下载: 导出CSV
表 2 GRNN与其他方法误差对比
Tab. 2 Comparation of errors between GRNN and other approaches
区域 标准误差/μatm FFNN[13] 机器学习算法[17] SOM[11, 12, 18-19] SOM-FFNN[20-21] GRNN 全球大洋 17.97 9.10(墨西哥湾) 17.60~20.20 20.00~22.80 16.93(2.97%)b 全球大洋及近岸a − − − − 21.60(3.52%)b 北极 22.05 − − − 23.92(6.00%)b 近极地大西洋 22.99 − − − 21.39(3.49%)b 近极地太平洋 34.77 − − − 24.57(4.59%)b 亚热带大西洋 17.28 − − − 13.87(2.66%)b 亚热带太平洋 15.86 − − − 11.50(2.15%)b 赤道大西洋 17.27 − − − 14.26(2.52%)b 赤道太平洋 15.73 − − − 10.45(1.93%)b 南大西洋 17.81 − − − 15.37(2.60%)b 南太平洋 13.52 − − − 9.97(2.04%)b 印度洋 17.25 − − − 11.64(2.25%)b 南大洋 17.40 − − − 24.59(4.87%)b 近岸区域a − − − 42.40~48.00 46.87(8.83%)b 注:a表示此处近岸区域指水深小于200 m的海域;b表示括号内为本文方法的平均相对误差;−表示无数据;FFNN:前反馈神经网络;SOM:自组织映射神经网络;SOM-FFNN:自组织映射神经网络与前反馈神经联用法;GRNN:本文所使用的广义回归神经网络。
下载: 导出CSV
-
[1] 曲宝晓, 宋金明, 袁华茂, 等. 东海海−气界面二氧化碳通量的季节变化与控制因素研究进展[J]. 地球科学进展, 2013, 28(7): 783−793. doi: 10.11867/j.issn.1001-8166.2013.07.0783Qu Baoxiao, Song Jinming, Yuan Huamao, et al. Advances of seasonal variations and controlling factors of the air-sea CO2 flux in the East China Sea[J]. Advances in Earth Science, 2013, 28(7): 783−793. doi: 10.11867/j.issn.1001-8166.2013.07.0783 [2] Takahashi T, Sutherland S C, Feely R A, et al. Decadal change of the surface water pCO2 in the North Pacific: a synthesis of 35 years of observations[J]. Journal of Geophysical Research: Oceans, 2006, 111(C7): C07S05. [3] Song Jinming. Biogeochemical Processes of Biogenic Elements in China Marginal Seas[M]. Berlin, Heidelberg: Springer Science & Business Media, 2010: 140−144. [4] 宋金明, 李学刚, 袁华茂, 等. 渤黄东海生源要素的生物地球化学[M]. 北京: 科学出版社, 2019: 45-47.Song Jinming, Li Xuegang, Yuan Huamao, et al. Biogeochemistry of Biogenic Elements in the Bohai Sea, Yellow Sea and East China Sea[M]. Beijing: Science Press, 2019: 45−47. [5] Takahashi T, Sutherland S C, Wanninkhof R, et al. Climatological mean and decadal change in surface ocean pCO2, and net sea-air CO2 flux over the global oceans[J]. Deep-Sea Research Part II: Topical Studies in Oceanography, 2009, 56(8/10): 554−577. [6] Takamura T R, Inoue H Y, Midorikawa T, et al. Seasonal and inter-annual variations in $ {{p{\rm{CO}}}}_2^{{\rm{sea}}} $ and air-sea CO2 fluxes in mid-latitudes of the western and eastern North Pacific during 1999−2006: recent results utilizing voluntary observation ships[J]. Journal of the Meteorological Society of Japan, 2010, 88(6): 883−898. doi: 10.2151/jmsj.2010-602[7] Sarma V V S S, Saino T, Sasaoka K, et al. Basin-scale pCO2 distribution using satellite sea surface temperature, Chl a, and climatological salinity in the North Pacific in spring and summer[J]. Global Biogeochemical Cycles, 2006, 20(3): GB3005. [8] Lefévre N, Watson A J, Watson A R. A comparison of multiple regression and neural network techniques for mapping in situ pCO2 data[J]. Tellus B: Chemical and Physical Meteorology, 2005, 57(5): 375−384. doi: 10.1111/j.1600-0889.2005.00164.x [9] Zeng J Y, Nojiri Y, Nakaoka S I, et al. Surface ocean CO2 in 1990−2011 modelled using a feed-forward neural network[J]. Geoscience Data Journal, 2015, 2(1): 47−51. doi: 10.1002/gdj3.26 [10] Zeng J, Nojiri Y, Landschützer P, et al. A global surface ocean fCO2 climatology based on a feed-forward neural network[J]. Journal of Atmospheric and Oceanic Technology, 2014, 31(8): 1838−1849. doi: 10.1175/JTECH-D-13-00137.1 [11] Telszewski M, Chazottes A, Schuster U, et al. Estimating the monthly pCO2 distribution in the North Atlantic using a self-organizing neural network[J]. Biogeosciences, 2009, 6(8): 1405−1421. doi: 10.5194/bg-6-1405-2009 [12] Nakaoka S, Telszewski M, Nojiri Y, et al. Estimating temporal and spatial variation of ocean surface pCO2 in the North Pacific using a self-organizing map neural network technique[J]. Biogeosciences, 2013, 10(9): 6093−6106. doi: 10.5194/bg-10-6093-2013 [13] Denvil-Sommer A, Gehlen M, Vrac M, et al. LSCE-FFNN-v1: a two-step neural network model for the reconstruction of surface ocean pCO2 over the global ocean[J]. Geoscientific Model Development, 2019, 12(5): 2091−2105. doi: 10.5194/gmd-12-2091-2019 [14] Körtzinger A. Determination of carbon dioxide partial pressure (p(CO2))[M]//Grasshoff K, Kremling K, Ehrhardt M. Methods of Seawater Analysis. 3rd ed. New York: Wiley, 1999: 149−158. [15] Specht D F. A general regression neural network[J]. IEEE Transactions on Neural Networks, 1991, 2(6): 568−576. doi: 10.1109/72.97934 [16] 陈明. MATLAB神经网络原理与实例精解[M]. 北京: 清华大学出版社, 2013: 208−237.Chen Ming. MATLAB Neural Network Principle and Example Fine Solution[M]. Beijing: Tsinghua University Press, 2013: 208−237. [17] Chen Shuangliang, Hu Chuanmin, Barnes B B, et al. A machine learning approach to estimate surface ocean pCO2 from satellite measurements[J]. Remote Sensing of Environment, 2019, 228: 203−226. doi: 10.1016/j.rse.2019.04.019 [18] Friedrich T, Oschlies A. Neural network-based estimates of North Atlantic surface pCO2 from satellite data: a methodological study[J]. Journal of Geophysical Research: Oceans, 2009, 114(C3): C03020. [19] Hales B, Strutton P G, Saraceno M, et al. Satellite-based prediction of pCO2 in coastal waters of the eastern North Pacific[J]. Progress in Oceanography, 2012, 103: 1−15. doi: 10.1016/j.pocean.2012.03.001 [20] Landschützer P, Gruber N, Bakker D C E, et al. A neural network-based estimate of the seasonal to inter-annual variability of the Atlantic Ocean carbon sink[J]. Biogeosciences, 2013, 10(11): 7793−7815. doi: 10.5194/bg-10-7793-2013 [21] Laruelle G G, Landschützer P, Gruber N, et al. Global high-resolution monthly pCO2 climatology for the coastal ocean derived from neural network interpolation[J]. Biogeosciences, 2017, 14(19): 4545−4561. doi: 10.5194/bg-14-4545-2017 [22] Zeng Jiye, Matsunaga T, Saigusa N, et al. Technical note: Evaluation of three machine learning models for surface ocean CO2 mapping[J]. Ocean Science, 2017, 13(2): 303−313. doi: 10.5194/os-13-303-2017 [23] Landschützer P, Gruber N, Bakker D C E. Decadal variations and trends of the global ocean carbon sink[J]. Global Biogeochemical Cycles, 2016, 30(10): 1396−1417. doi: 10.1002/2015GB005359 [24] Takahashi T, Sutherland S C, Chipman D W, et al. Climatological distributions of pH, pCO2, total CO2, alkalinity, and CaCO3 saturation in the global surface ocean, and temporal changes at selected locations[J]. Marine Chemistry, 2014, 164: 95−125. doi: 10.1016/j.marchem.2014.06.004 -


计量
- 文章访问数: 474
- HTML全文浏览量: 91
- PDF下载量: 54
- 被引次数: 0
