

Historical evolutions of metal contamination in the Guangdong-Hong Kong-Macao Greater Bay Area: A risk assessment based on the fuzzy comprehensive assessment in the Daya Bay
-
摘要: 本研究测定了粤港澳大湾区典型海域—大亚湾沉积物中主要重金属元素的含量水平与污染状况。利用我国海洋沉积物质量标准和模糊综合评价法,系统探讨了大亚湾海洋沉积物质量的历史演变过程,为我国大湾区可持续发展提供了科学理论支持。结果表明,大亚湾海域的重金属污染状况在过去近百年经历了3个主要变化阶段:(1)20世纪80年代之前,大部分重金属含量较低,沉积物质量处于一类等级,与重金属污染相关的生态风险较小,对沉积物生态风险贡献最高的元素为Cr,最低的为Cd;(2)1980−2000年间,大亚湾沉积物中的重金属含量明显高于背景值,表明该阶段出现了较为严重的重金属污染,使近岸海域的沉积物质量等级处于二类与三类,但大亚湾外部海域沉积物受污染影响较小,仍处于一类等级,在此期间,Cu取代Cr成为最主要的污染元素;(3)2000年以后,沉积物重金属的污染水平显著降低,生态风险迅速下降,沉积物质量等级恢复到了一类水平,Cr是这一阶段最主要的污染元素。Abstract: The metal contents in the core sediments collected from the Daya Bay, a typical marine environment in the Guangdong-Hong Kong-Macao Greater Bay Area were measured in this study. National standard for marine sediment quality and fuzzy comprehensive assessment were applied to evaluate the historical evolution of the sediment quality in the past one hundred years. Our results indicate that the metal contamination in the bay experienced three major stages: (1) Before 1980s, the concentrations of most metals were low and the sediment quality fell into the category of class I. Accordingly, the metal risk was low in this period. Cr contributed most and Cd contributed least to the risk, respectively. (2) Between 1980 and 2000, the metal contents were significantly higher than the background values, suggesting that there was a sharp increase of metal input. The category of sediment quality fell down to class II and class III. However, the sediments in the margin areas of the Daya Bay were only slightly affected and still belonged to class I quality. Cu acted as a major metal pollutant instead of Cr in this period. (3) After the year of 2000, the metal levels and the metal risk decreased sharply. The sediment quality recovered back to class I and Cr contributed most to the risk at the time.
-
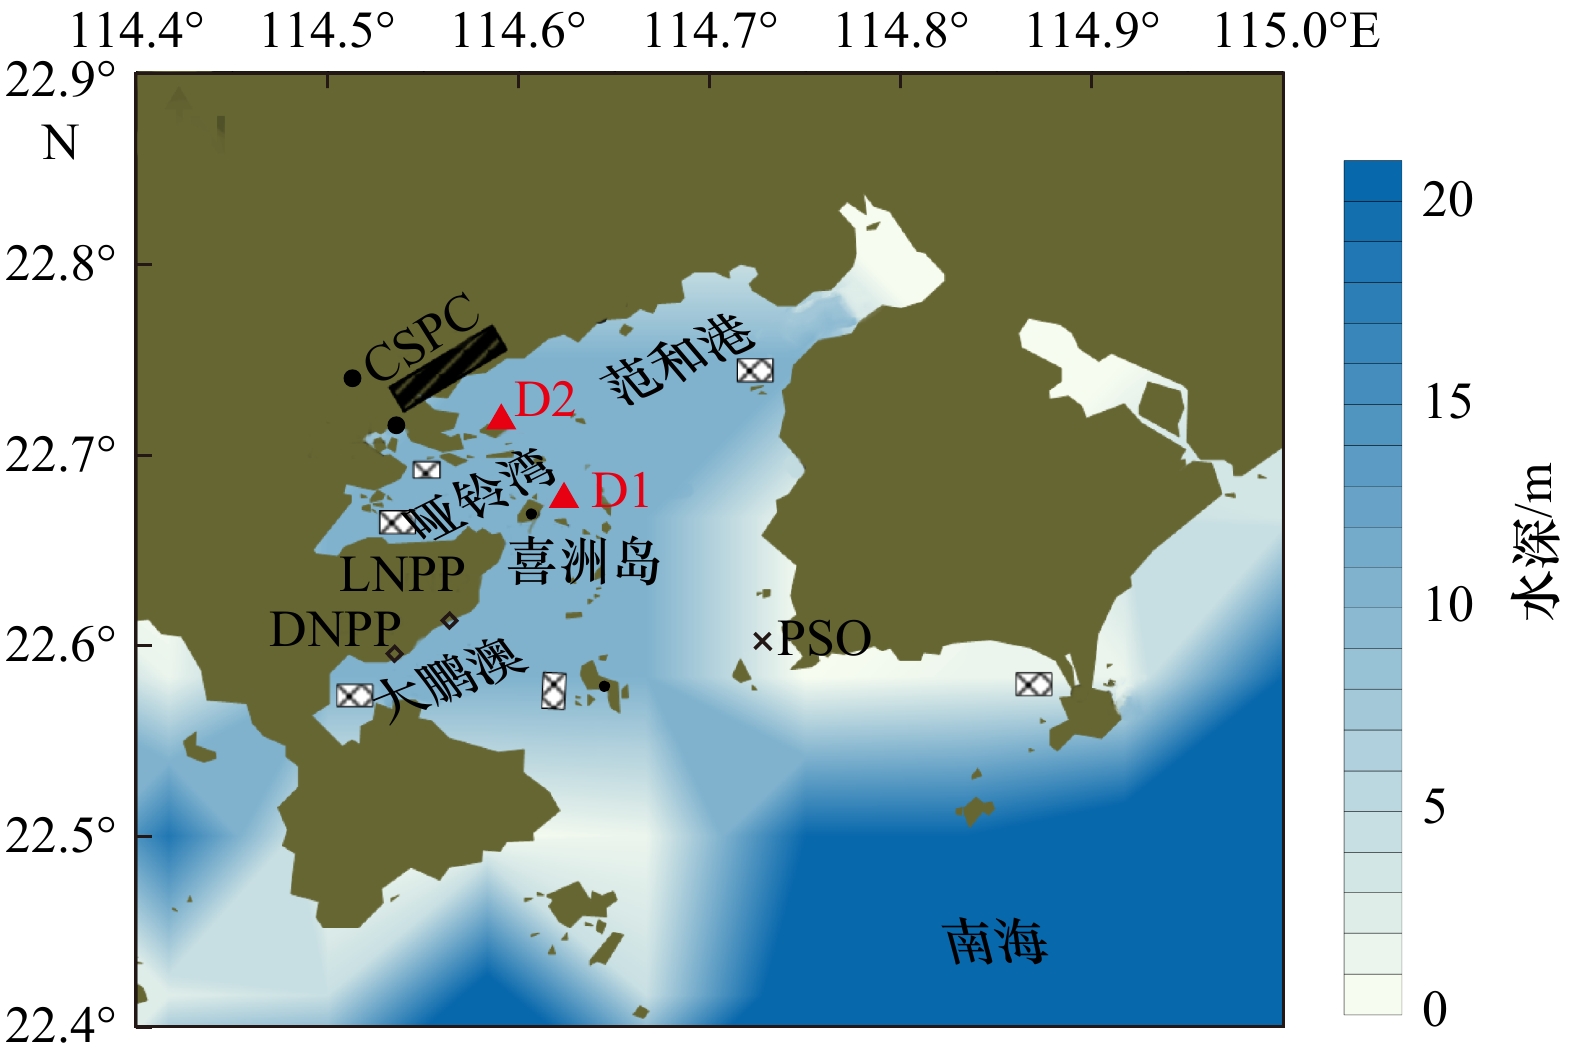
图 1 大亚湾调查站位
红色三角形表示柱状沉积物采样站位(D1和D2),黑色阴影矩形CSPC代表位于“惠州·大亚湾经济技术开发区”内的中海壳牌石油化工有限公司,×PSO代表大亚湾石化排污口,灰色阴影矩形表示网箱养殖区。DNPP表示大亚湾核电站;LNPP表示岭澳核电站
Fig. 1 Sampling stations in the Daya Bay
The cores were collected in D1 and D2, which were marked as red triangles. The black shadow rectangle stands for the CNOOC and Shell Petrochemical Company Limited (CSPC) in the Huizhou Daya Bay Economic and Technological Development Zone. The black cross stands for the Petrochemical Sewage Outlet (PSO) of CSPC. Gray dashed rectangles stand for the aquaculture regions. DNPP and LNPP stand for the abbreviations of the Daya Bay Nuclear Power Plant and the Lingao Nuclear Power Plant

图 2 大亚湾D1沉积柱中重金属(Cd、Cr、Cu、Pb、Zn)富集因子的历史变化
Fig. 2 Historical variations of enrichment factor in the Core D1 of the Daya Bay

图 3 大亚湾D2沉积柱中重金属(Cd、Cr、Cu、Pb、Zn)富集因子的历史变化
Fig. 3 Historical variations of enrichment factor in the Core D2 of the Daya Bay
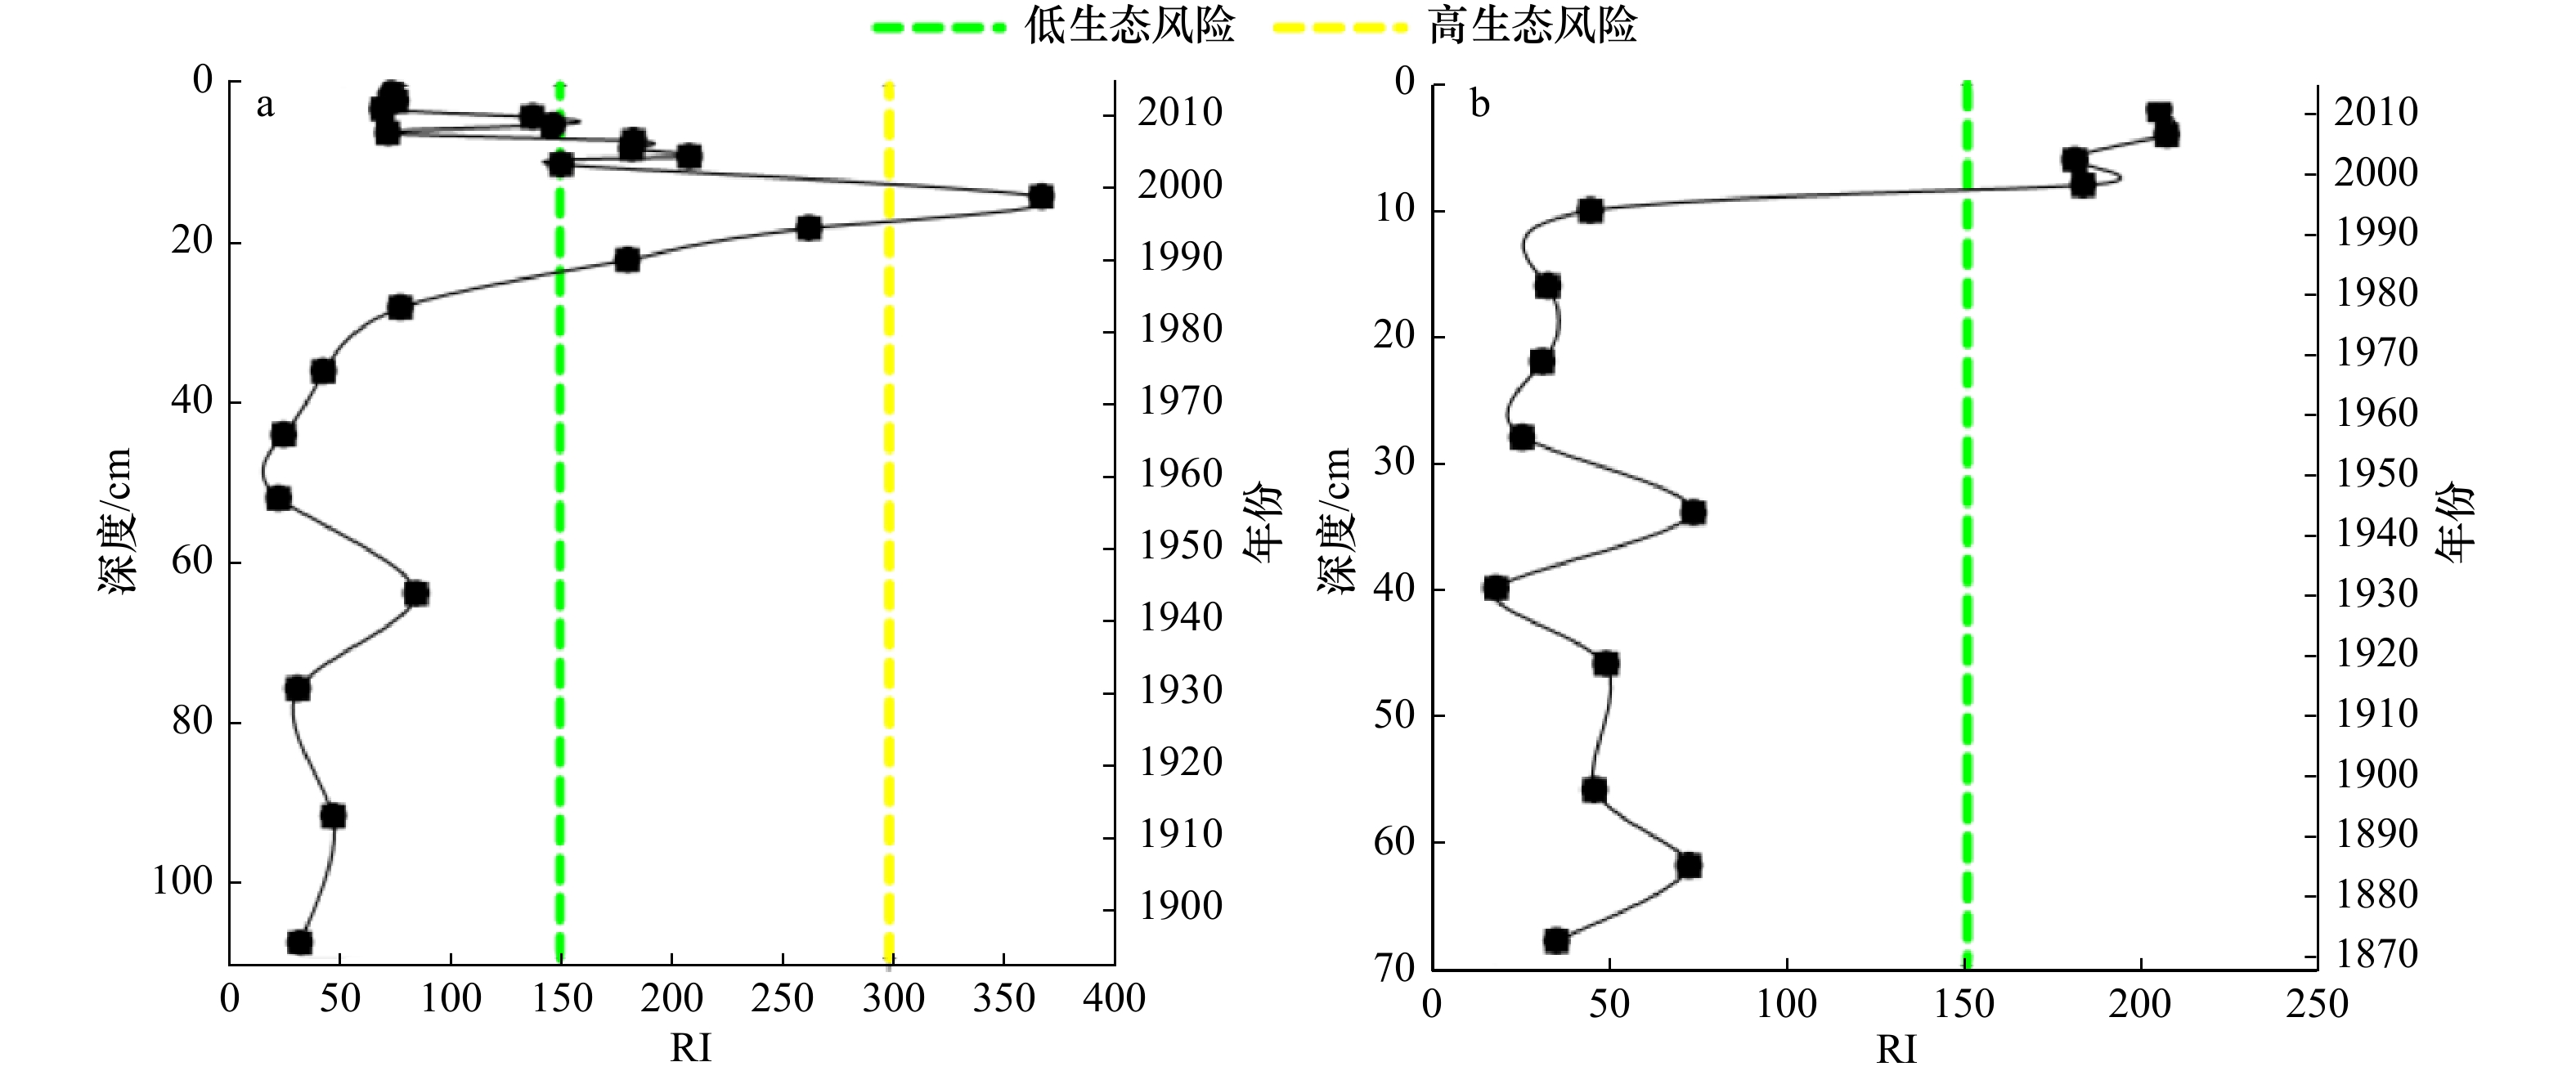
图 4 大亚湾D1(a)、D2(b)沉积柱中重金属(Cd、Cr、Cu、Pb、Zn)潜在生态风险指数(RI)的历史变化
Fig. 4 Historical variations of RI in the Core D1 (a) and Core D2 (b) of the Daya Bay
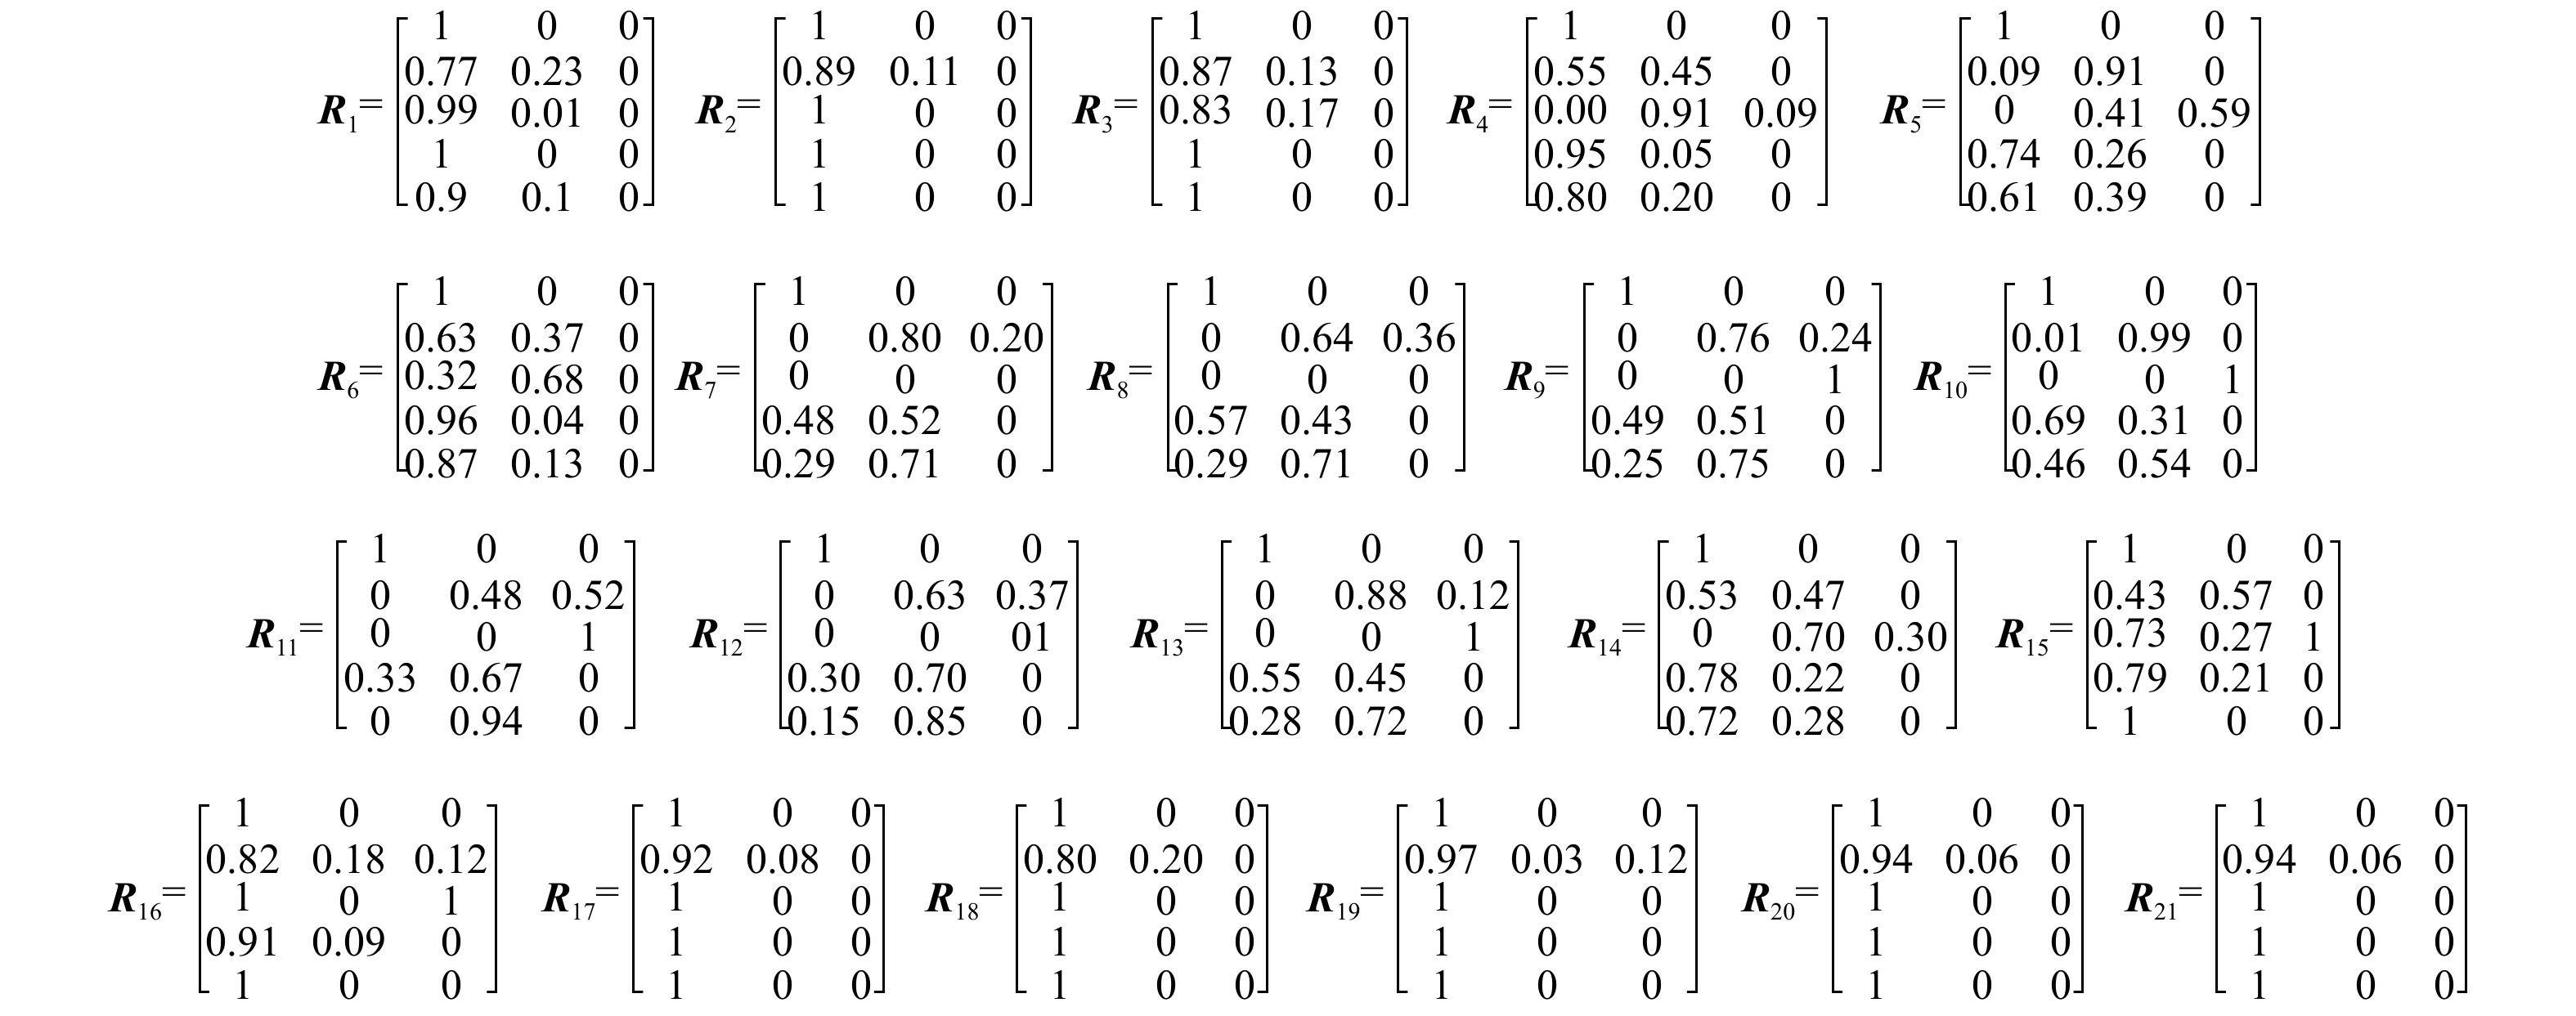
图 5 大亚湾D1沉积柱中重金属的模糊矩阵
R1代表首层沉积物样品,以下以此类推
Fig. 5 The fuzzy matrix R of each sediment sample in the Core D1 of the Daya Bay
The R1 stands for sediment sample from the first depth (k1), and the rest can be deduced in the same manner
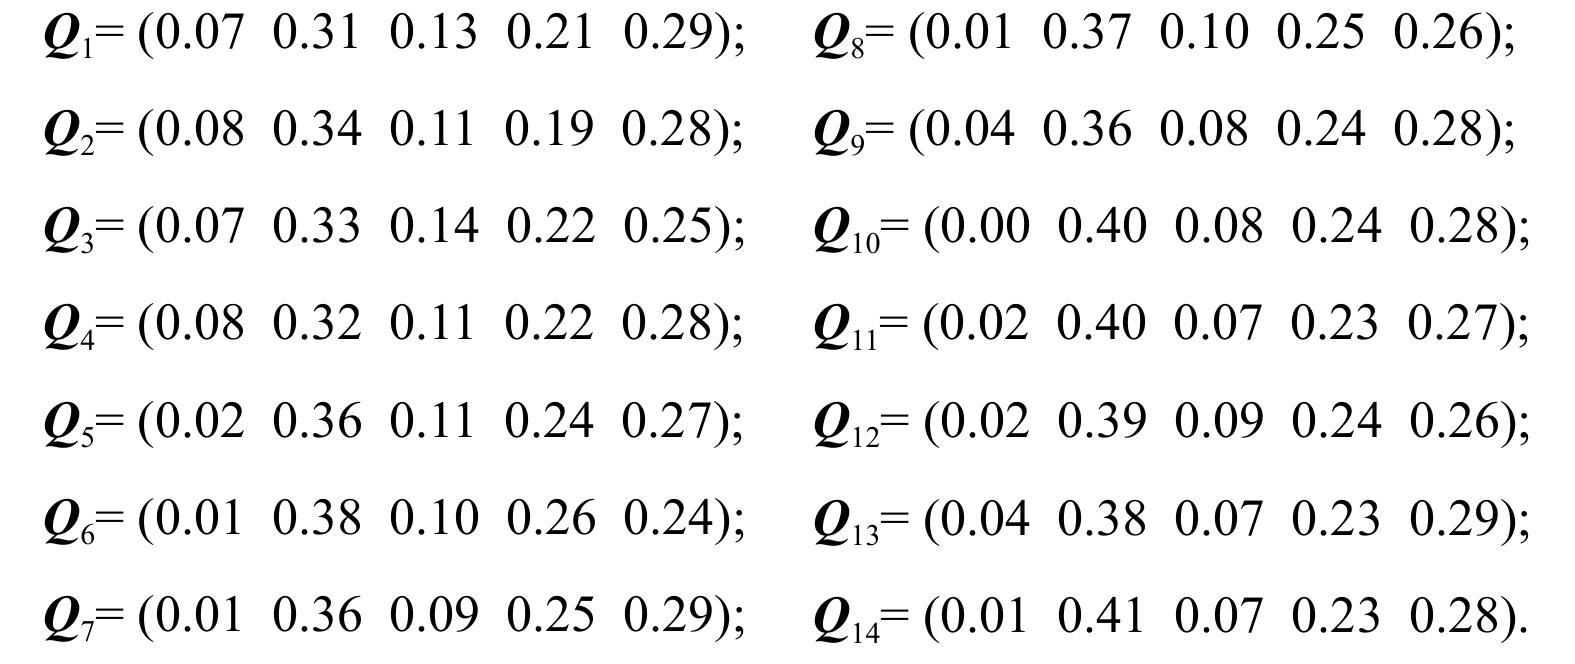
图 8 大亚湾D2沉积柱中重金属的权值矩阵
其中Q1代表首层沉积物样品,以下以此类推
Fig. 8 The weigh matrices Q of each sediment sample in the Core D2 of the Daya Bay
The Q1 stands for sediment sample from the first depth (k1), and the rest can be deduced in the same manner
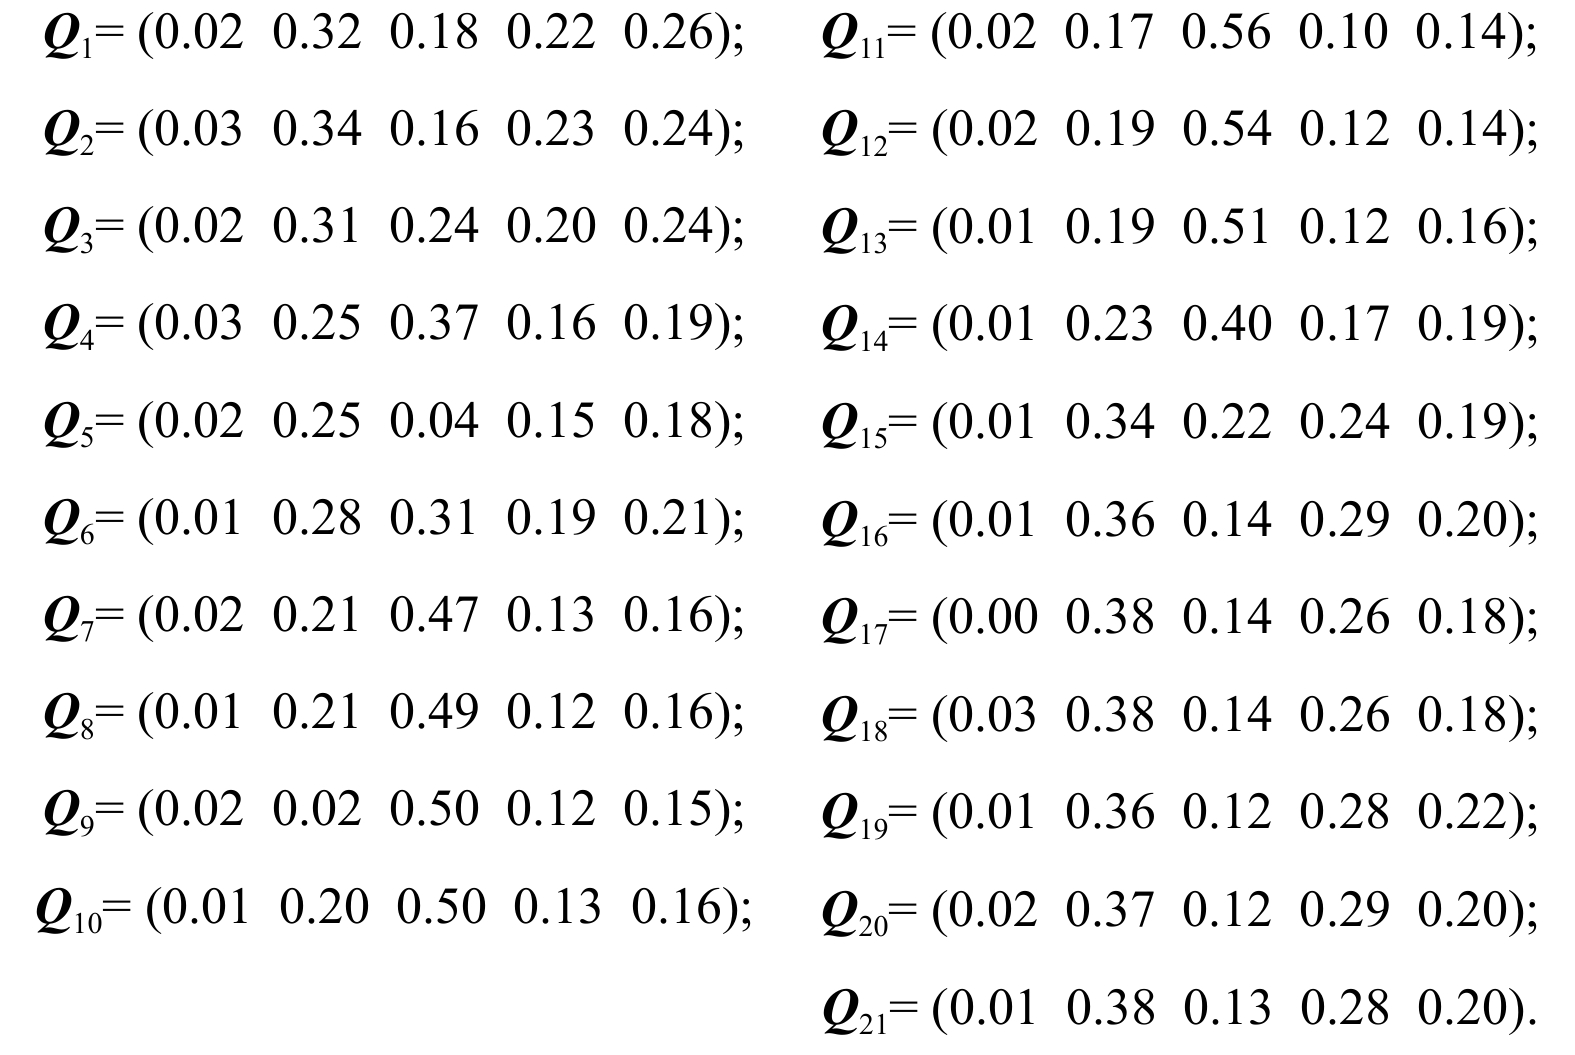
图 7 大亚湾D1沉积柱中重金属的权值矩阵
Q1代表首层沉积物样品,以下以此类推
Fig. 7 The weigh matrices Q of each sediment sample in the Core D1 of the Daya Bay
The Q1 stands for sediment sample from the first depth (k1), and the rest can be deduced in the same manner

图 9 大亚湾D1、D2沉积柱中重金属(Cd、Cr、Cu、Pb、Zn)占整体污染权重的历史变化
Fig. 9 Profiles of weight matrices for sediments from the Core D1 (a) and the Core D2 (b) of the Daya Bay

图 10 大亚湾D1沉积柱中重金属模糊综合评价结果
F1代表首层沉积物样品,以下以此类推
Fig. 10 The results of FCA for sediments of the Core D1 in the Daya Bay
The F1 stands for sediment sample from the first depth (k1), and the rest can be deduced in the same manner

图 11 大亚湾D2沉积柱中重金属模糊综合评价结果
F1代表首层沉积物样品,以下以此类推
Fig. 11 The results of FCA for sediments of the Core D2 in the Daya Bay
The F1 stands for sediment sample from the first depth (k1), and the rest can be deduced in the same manner
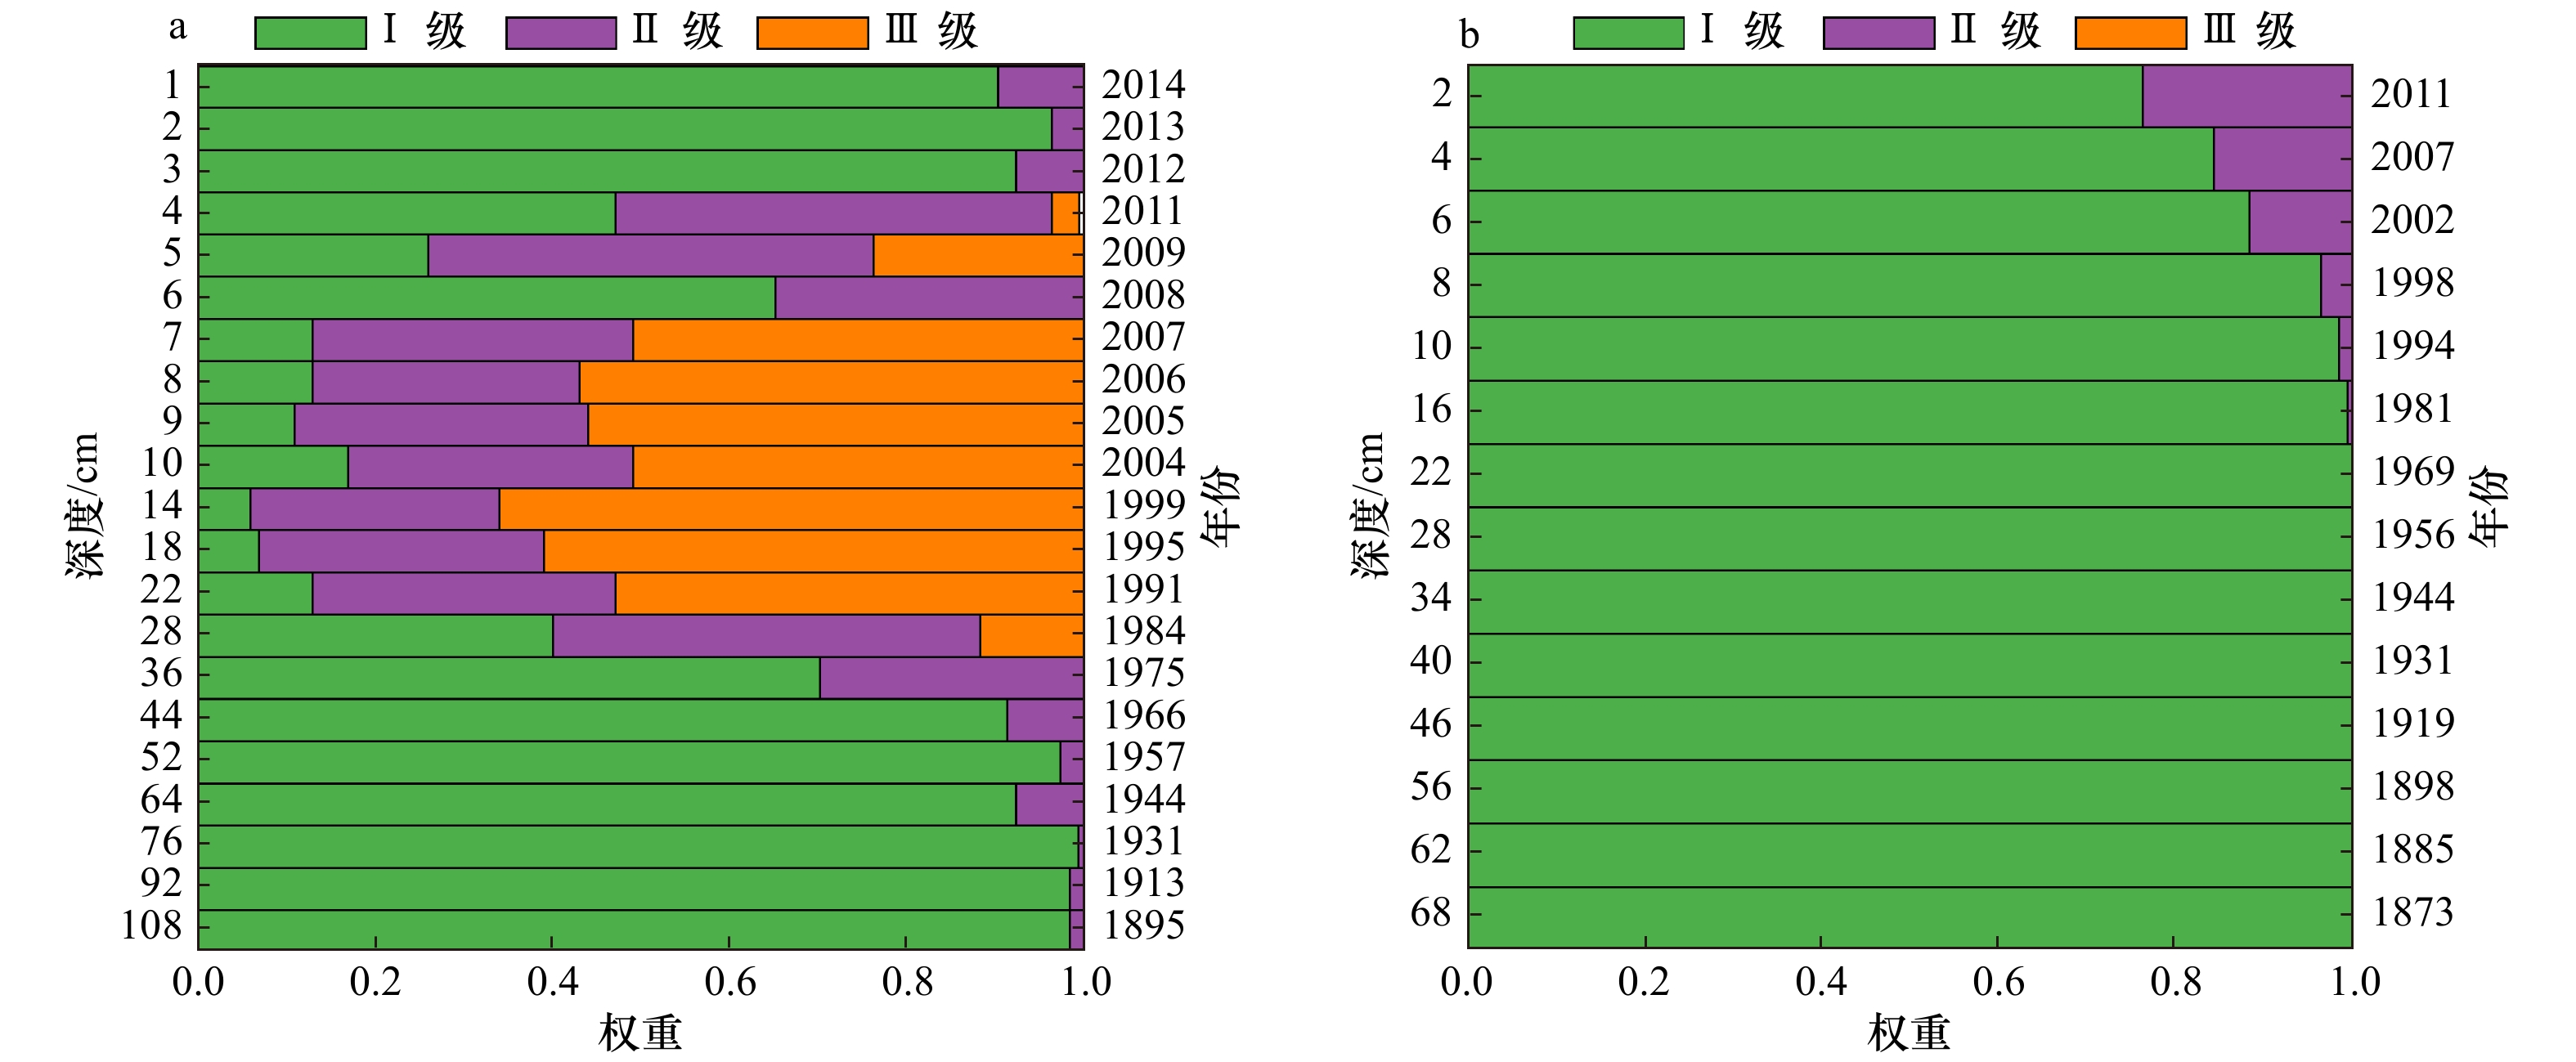
图 12 大亚湾D1、D2沉积柱环境质量等级的历史变化
Fig. 12 Profiles of sediment quality for sediments from the Core D1 (a) and the Core D2 (b) of the Daya Bay

图 6 大亚湾D2沉积柱中重金属的模糊矩阵
R1代表首层沉积物样品,以下以此类推
Fig. 6 The fuzzy matrix R of each sediment sample in the Core D2
The R1 stands for sediment sample from the first depth (k1), and the rest can be deduced in the same manner
表 1 富集因子法评价标准
Tab. 1 Category of enrichment factor (EF)
EF 类别 < 1 微富集 < 3 低等富集 3~5 中等富集 5~10 中等严重富集 10~25 严重富集 25~50 非常严重富集 >50 特别严重富集  下载: 导出CSV
表 2 潜在生态风险指数法评价标准
Tab. 2 Category of potential ecological risk index (RI)
RI 类别 < 150 低等生态风险 150~300 中等生态风险 300~600 高等生态风险 > 600 极高生态风险
下载: 导出CSV
表 3 沉积物重金属背景值(
$ {C}_{{\rm{B}}} $ )及毒性生物敏感性指数($ {T}_{r}^{i} $ )[15]Tab. 3 Background values (
$ {C}_{{\rm{B}}} $ ), toxicity and biological sensitivity of metals ($ {T}_{r}^{i} $ )[15]Al Cd Cr Cu Pb Zn $ {C}_{{\rm{B}}} $/μg·g−1 D1 57 572 0.05 86.20 20.25 56.81 99.79 D2 59 036 0.06 77.44 9.82 40.10 104.53 $ {T}_{r}^{i} $ 30 2 5 5 1
下载: 导出CSV
表 4 《中华人民共和国海洋沉积物质量标准(GB 18668−2002)》
Tab. 4 China National Standard for Marine Sediment Quality (GB 18668−2002)
重金属含量 等级Ⅰ 等级Ⅱ 等级Ⅲ Cd/μg·g−1 0.5 1.5 5.0 Cr/μg·g−1 80 150 270 Cu/μg·g−1 35 100 200 Pb/μg·g−1 60 130 250 Zn/μg·g−1 150 350 600
下载: 导出CSV
-
[1] 周春山, 罗利佳, 史晨怡, 等. 粤港澳大湾区经济发展时空演变特征及其影响因素[J]. 热带地理, 2017, 37(6): 802−813.Zhou Chunshan, Luo Lijia, Shi Chenyi, et al. Spatio-temporal evolutionary characteristics of the economic development in the Guangdong-Hong Kong-Macao Greater Bay Area and its influencing factors[J]. Tropical Geography, 2017, 37(6): 802−813. [2] 李立勋. 关于“粤港澳大湾区”的若干思考[J]. 热带地理, 2017, 37(6): 757−761.Li Lixun. Thinking on the Guangdong-Hong Kong-Macao Greater Bay Area[J]. Tropical Geography, 2017, 37(6): 757−761. [3] 杜俊民, 朱赖民, 张远辉. 南黄海中部沉积物微量元素的环境记录研究[J]. 海洋学报, 2004, 26(6): 49−57.Du Junmin, Zhu Laimin, Zhang Yuanhui. The environment significance of trace elements for the sediments from the southern Huanghai Sea[J]. Haiyang Xuebao, 2004, 26(6): 49−57. [4] Duan Liqin, Song Jinming, Xu Yayan, et al. The concentrations, fluxes, enrichments and chronologies of potential harmful elements in sediment cores from Bohai Bay, North China[J]. Environmental Earth Sciences, 2011, 64(8): 2259−2269. doi: 10.1007/s12665-011-1054-4 [5] Liang Xianmeng, Song Jinming, Duan Liqin, et al. Source identification and risk assessment based on fractionation of heavy metals in surface sediments of Jiaozhou Bay, China[J]. Marine Pollution Bulletin, 2018, 128: 548−556. doi: 10.1016/j.marpolbul.2018.02.008 [6] Liang Xianmeng, Song Jinming, Duan Liqin, et al. Metals in size-fractionated core sediments of Jiaozhou Bay, China: records of recent anthropogenic activities and risk assessments[J]. Marine Pollution Bulletin, 2018, 127: 198−206. doi: 10.1016/j.marpolbul.2017.12.011 [7] Wu Meilin, Wang Youshao. Using chemometrics to evaluate anthropogenic effects in Daya Bay, China[J]. Estuarine, Coastal and Shelf Science, 2007, 72(4): 732−742. doi: 10.1016/j.ecss.2006.11.032 [8] Gu Yangguang, Wang Xunuo, Lin Qin, et al. Fuzzy comprehensive assessment of heavy metals and Pb isotopic signature in surface sediments from a bay under serious anthropogenic influences: Daya Bay, China[J]. Ecotoxicology and Environmental Safety, 2016, 126: 38−44. doi: 10.1016/j.ecoenv.2015.12.011 [9] 黄小平, 张景平, 江志坚. 人类活动引起的营养物质输入对海湾生态环境的影响机理与调控原理[J]. 地球科学进展, 2015, 30(9): 961−969.Huang Xiaoping, Zhang Jingping, Jiang Zhijian. Eco-environmental effects of nutrients input caused by human activities on the semi-enclosed bay and its management strategy[J]. Advances in Earth Science, 2015, 30(9): 961−969. [10] Qu Baoxiao, Song Jinming, Yuan Huanmao, et al. Intensive anthropogenic activities had affected Daya Bay in South China Sea since the 1980s: evidence from heavy metal contaminations[J]. Marine Pollution Bulletin, 2018, 135: 318−331. doi: 10.1016/j.marpolbul.2018.07.011 [11] 曲宝晓, 宋金明, 袁华茂. 近百年来大亚湾沉积物有机质的沉积记录及对人为活动的响应[J]. 海洋学报, 2018, 40(10): 119−130.Qu Baoxiao, Song Jinming, Yuan Huamao. Sediment records and responses for anthropogenic activities of organic matter in the Daya Bay during recent one hundred years[J]. Haiyang Xuebao, 2018, 40(10): 119−130. [12] 王友绍, 王肇鼎, 黄良民. 近20年来大亚湾生态环境的变化及其发展趋势[J]. 热带海洋学报, 2004, 23(5): 85−95. doi: 10.3969/j.issn.1009-5470.2004.05.012Wang Youshao, Wang Zhaoding, Huang Liangmin. Environment changes and trends in Daya Bay in recent 20 years[J]. Journal of Tropical Oceanography, 2004, 23(5): 85−95. doi: 10.3969/j.issn.1009-5470.2004.05.012 [13] 王友绍. 大亚湾生态环境与生物资源[M]. 北京: 科学出版社, 2014.Wang Youshao. Ecological Environments and Biological Resources of Daya Bay[M]. Beijing: Science Press, 2014. [14] Hu Chengye, Yang Xiaolong, Dong Jianyu, et al. Heavy metal concentrations and chemical fractions in sediment from Swan Lagoon, China: their relation to the physiochemical properties of sediment[J]. Chemosphere, 2018, 209: 848−856. doi: 10.1016/j.chemosphere.2018.06.113 [15] Hakanson L. An ecological risk index for aquatic pollution control a sedimentological approach[J]. Water Research, 1980, 14(8): 975−1001. doi: 10.1016/0043-1354(80)90143-8 [16] Adebowale K O, Agunbiade F O, Olu-Owolabi B I. Fuzzy comprehensive assessment of metal contamination of water and sediments in Ondo Estuary, Nigeria[J]. Chemistry and Ecology, 2008, 24(4): 269−283. doi: 10.1080/02757540802255600 [17] Liu Li, Zhou Jianzhong, An Xueli, et al. Using fuzzy theory and information entropy for water quality assessment in Three Gorges region, China[J]. Expert Systems with Applications, 2010, 37(3): 2517−2521. doi: 10.1016/j.eswa.2009.08.004 [18] Shen Guoqing, Lu Yitong, Wang Meinong, et al. Status and fuzzy comprehensive assessment of combined heavy metal and organo-chlorine pesticide pollution in the Taihu Lake region of China[J]. Journal of Environmental Management, 2005, 76(4): 355−362. doi: 10.1016/j.jenvman.2005.02.011 [19] Wang Haiyan. Assessment and prediction of overall environmental quality of Zhuzhou City, Hunan Province, China[J]. Journal of Environmental Management, 2002, 66(3): 329−340. doi: 10.1016/S0301-4797(02)90590-6 -


计量
- 文章访问数: 293
- HTML全文浏览量: 58
- PDF下载量: 16
- 被引次数: 0
