

The interannual variability of barrier layer in the Bay of Bengal and its relationship with IOD events
-
摘要: 利用1980−2015年SODA温盐资料,结合Argo数据分析了印度洋偶极子(IOD)事件年份孟加拉湾障碍层的变化特征及其形成机制。结果表明,IOD事件年份孟加拉湾障碍层变化显著。纯的正IOD(纯pIOD)年份及伴随型pIOD年份盛期(9−11月),除孟加拉湾内西南海域障碍层厚度略变厚约5 m外,赤道海域、安达曼海至孟加拉湾北部障碍层厚度均变薄5~15 m,此障碍层距平盛期形态在纯pIOD年份随pIOD消亡迅速消退,但在伴随型pIOD年份维持至翌年3−5月才开始弱化。纯的负IOD (纯nIOD)年份障碍层厚度变化特征与pIOD年份大体相反。进一步分析表明,IOD事件年份赤道风场距平的远地强迫造成等温层深度的变化是湾内障碍层变化的主因。在伴随型IOD年份,受ENSO事件的影响,赤道风场距平在IOD消亡后仍得以维持3个月以上,使得湾内障碍层距平形态持续更久。除赤道远地强迫外,湾内局地风场的Ekman抽吸作用以及混合盐度变化对障碍层厚度年际变化也有一定影响。Abstract: Based on the temperature and salinity grid data of SODA from1980 to 2015 and combined with Argo data, the formation mechanism and seasonal variability of the barrier layer thickness in the Bay of Bengal in Indian Ocean Dipole (IOD) events are revealed. The results show that the barrier layer changed significantly in the IOD event year. In the peak of pure IOD events (pIOD) and the pIOD+El Niño events (September−November), except for the 5 m thickening of the barrier layer in the southwest of the Bay of Bengal, the barrier layer become thinner range from 5 m to 15 m in the equatorial region and the region from Andaman Sea to the northern Bay of Bengal. This form disappears as the pIOD weakens. However, the form is maintained until March to May of the following year in the pIOD+El Niño events. The variation of barrier layer in the nIOD year is roughly opposite to that of the pIOD year. Further analysis shows that the change of isothermal layer caused by the remote forcing of the equatorial wind anomaly in the IOD event is the main cause of the variability of barrier layer. In the IOD+ENSO events, the equatorial wind anomaly is maintained for more than three months after the IOD disappear, making the anomaly of barrier layer last longer in the Bay of Bengal. In addition to the equatorial forcing, the Ekman pumping in the Bay of Bengal and the variability of the salt of mixed layer also have an effect on the interannual variation of the barrier layer thickness.
-
Key words:
- Bay of Bengal /
- barrier layer /
- Indian Ocean Dipole /
- ENSO
-

图 1 孟加拉湾及其周边海域海底地形(数据来自ETOP01)
Fig. 1 The topography of the Bay of Bengal and its surrounding areas(the data come from ETOP01)
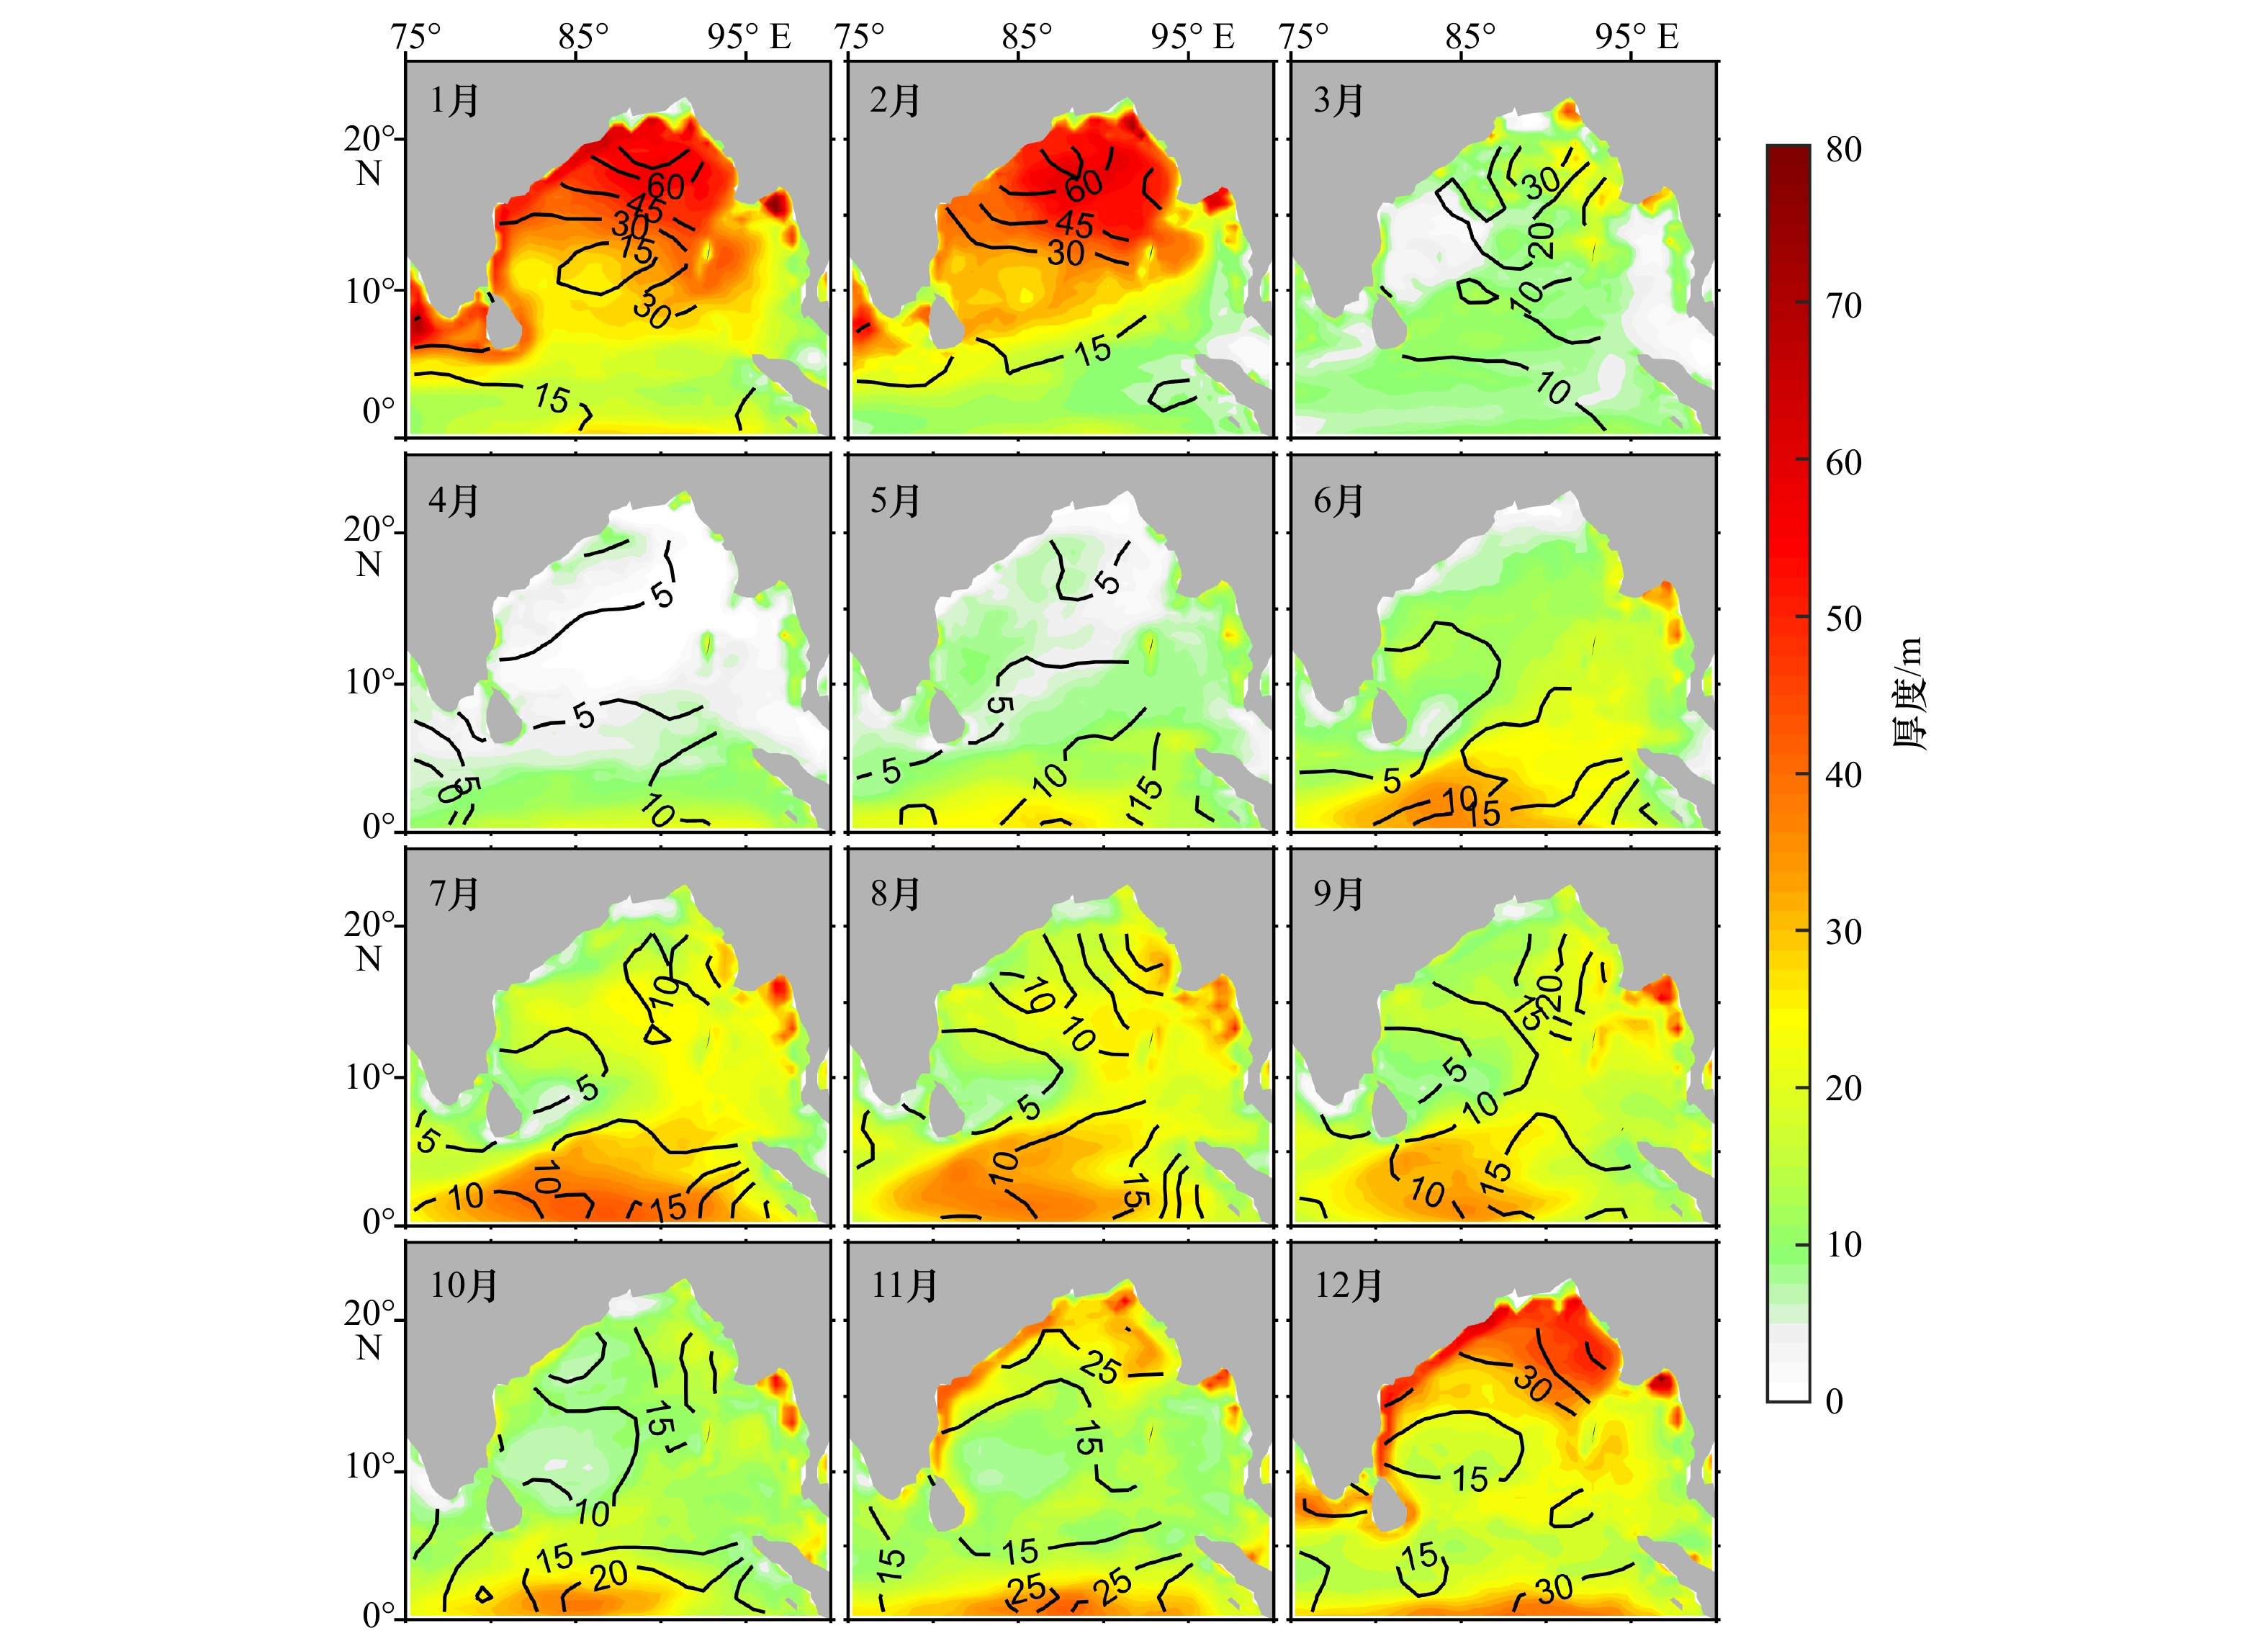
图 2 孟加拉湾气候态月平均障碍层厚度(填色:SODA资料;等值线:Argo资料)
Fig. 2 Annual distribution of barrier layer thickness in the Bay of Bengal based on SODA data (shaded) and Argo grided data (contour)
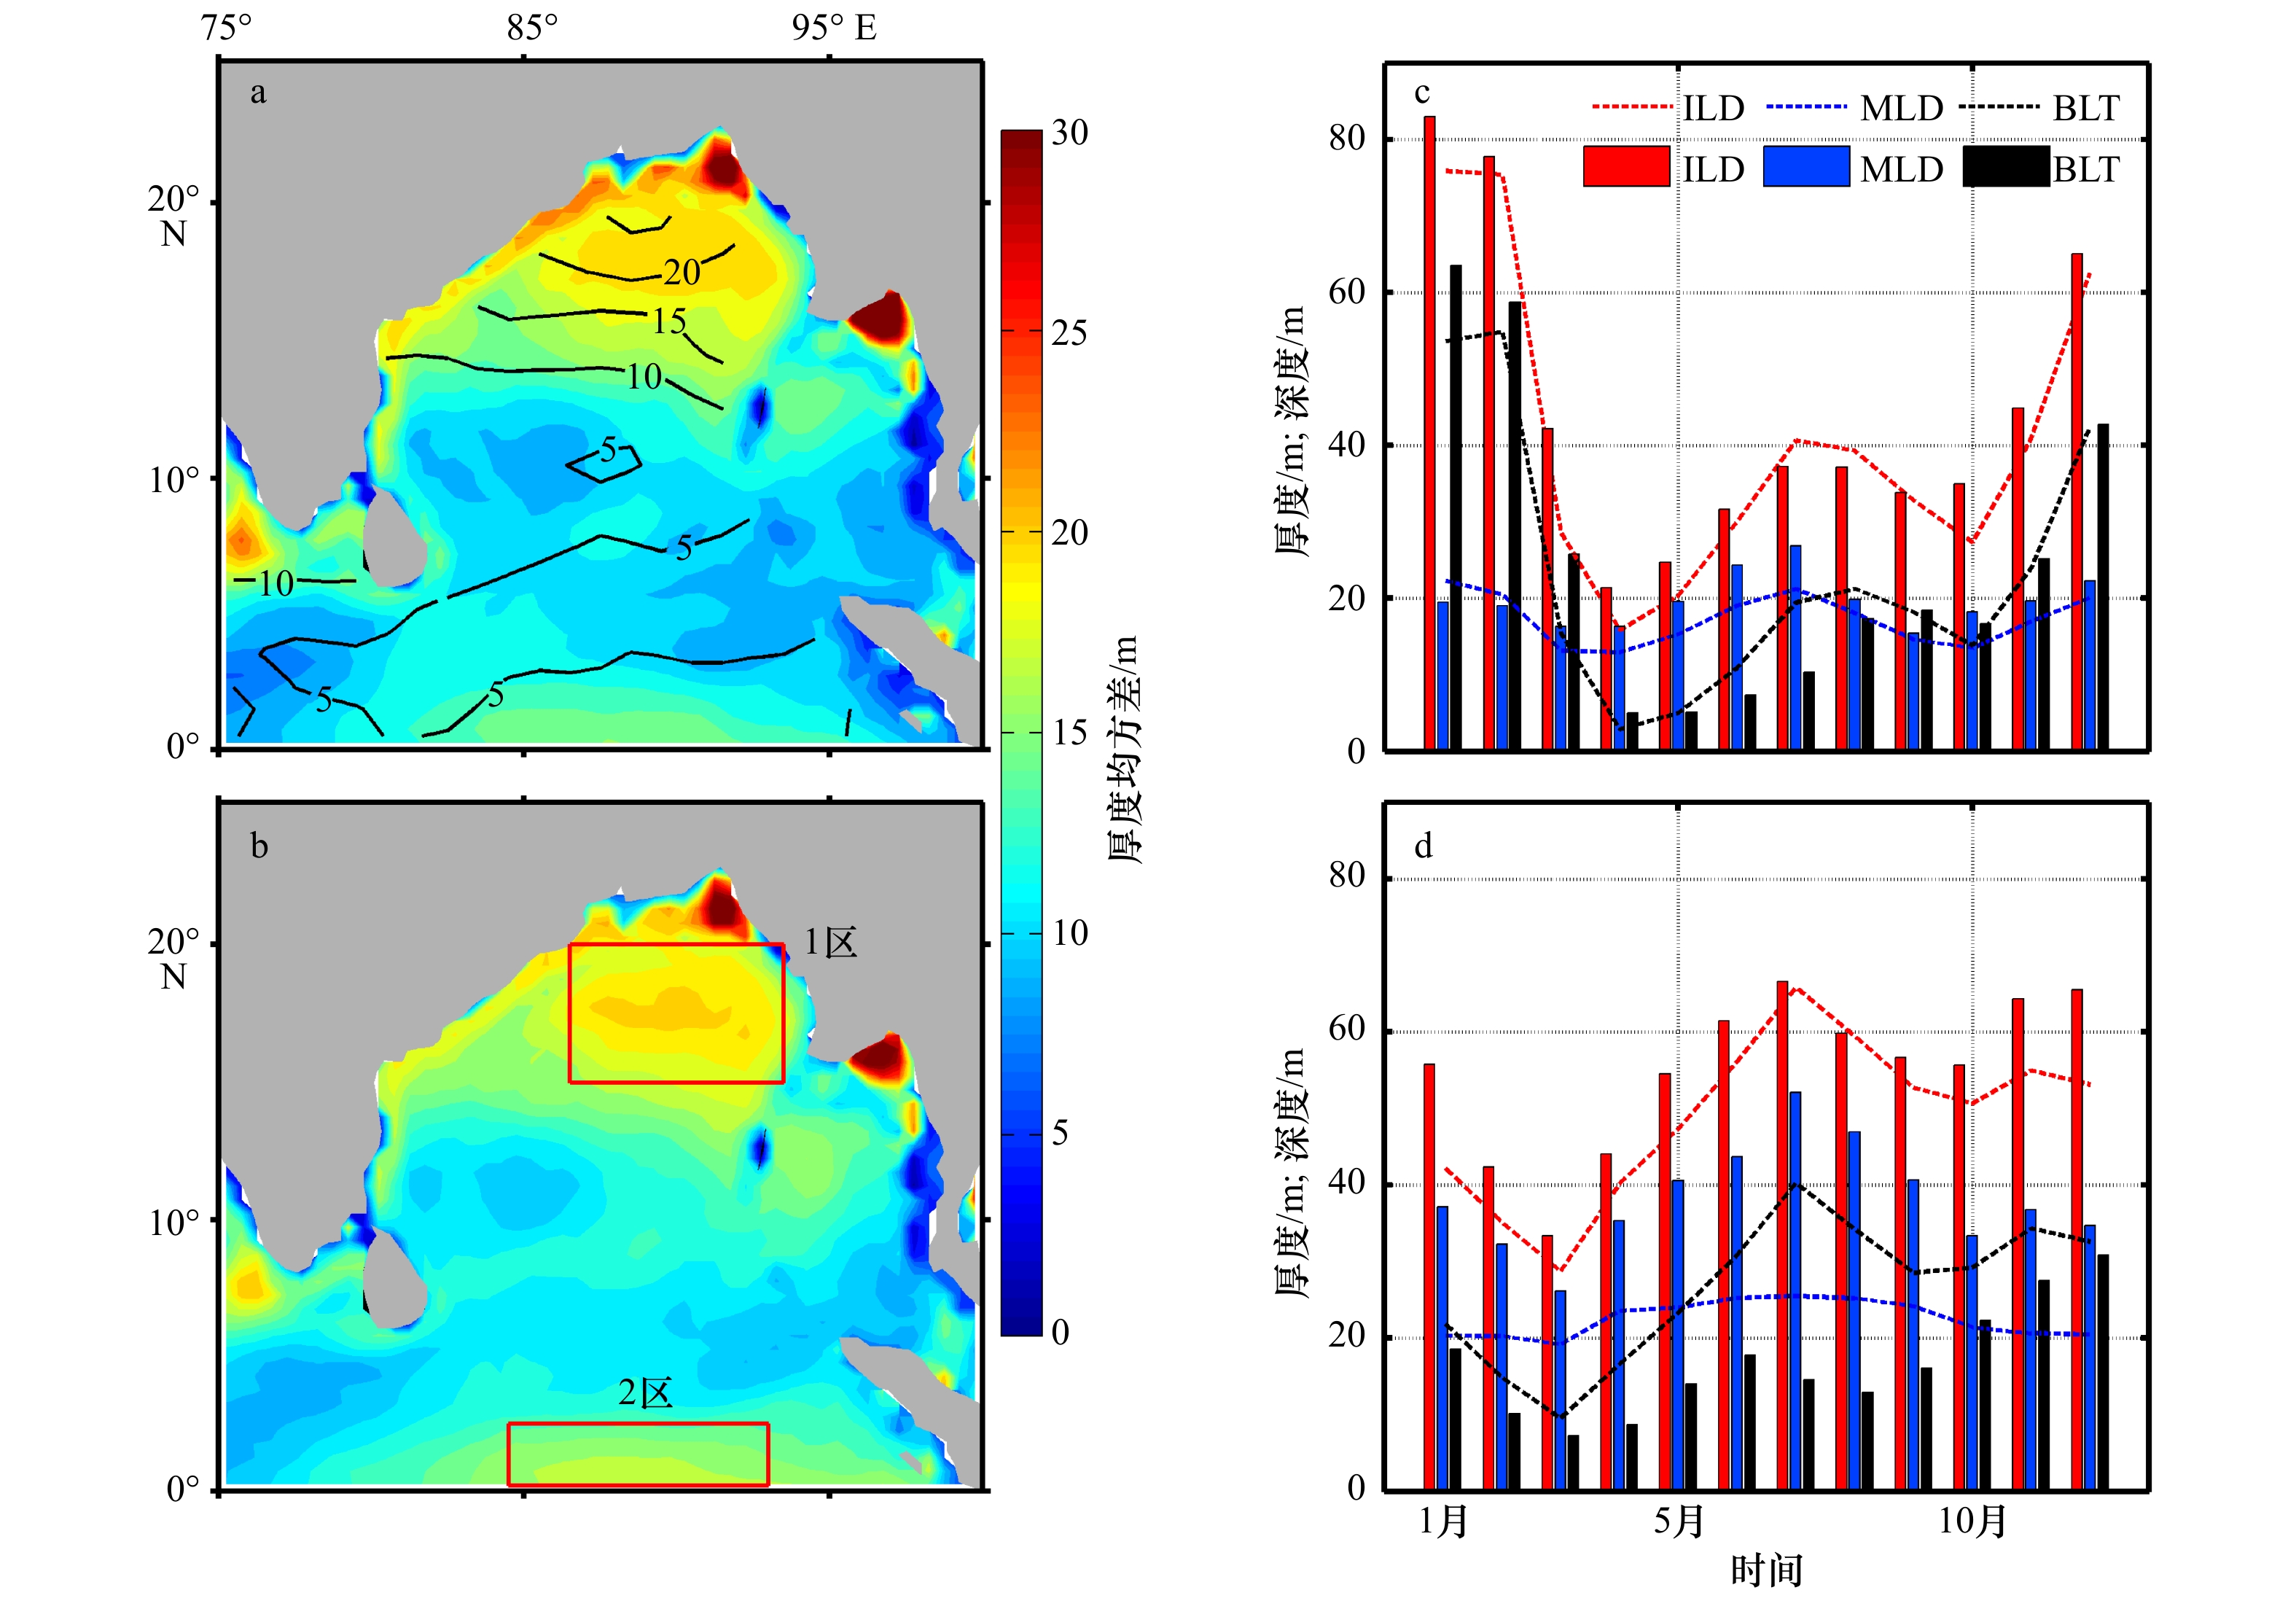
图 3 2005−2015年(a)和1980−2015年(b)孟加拉湾障碍层厚度均方差,1区(c)和2区(d)障碍层厚度(BLT)、等温层深度(ILD)、混合层深度(MLD)月变化
a、b中填色为SODA资料,等值线为Argo资料;c、d中折线为SODA资料,柱状图为Argo资料,为2005−2015年气候态月平均;1区与2区的位置分别为15°~20°N,86.5°~93.5°E和0°~2.5°N,84.5°~92.5°E
Fig. 3 Standard deviation of barrier layer thickness from 2005 to 2015 (a) and 1980 to 2015 (b) in the Bay of Bengal, and the monthly variation of barrier layer thickness (BLT), isothermal layer depth (ILD), mixed layer depth (MLD) in Zone 1 (c) and Zone 2 (d)
The shaded and contour represent SODA data and Argo data in a and b, respectively. The dotted lines and bars represent the monthly SODA data and the monthly Argo data from 2005 to 2015 in c and d, respectively. The locations of Zone 1 and Zone 2 are 15°~20°N, 86.5°~93.5°E and 0°~2.5°N, 84.5°~92.5°E, respectively
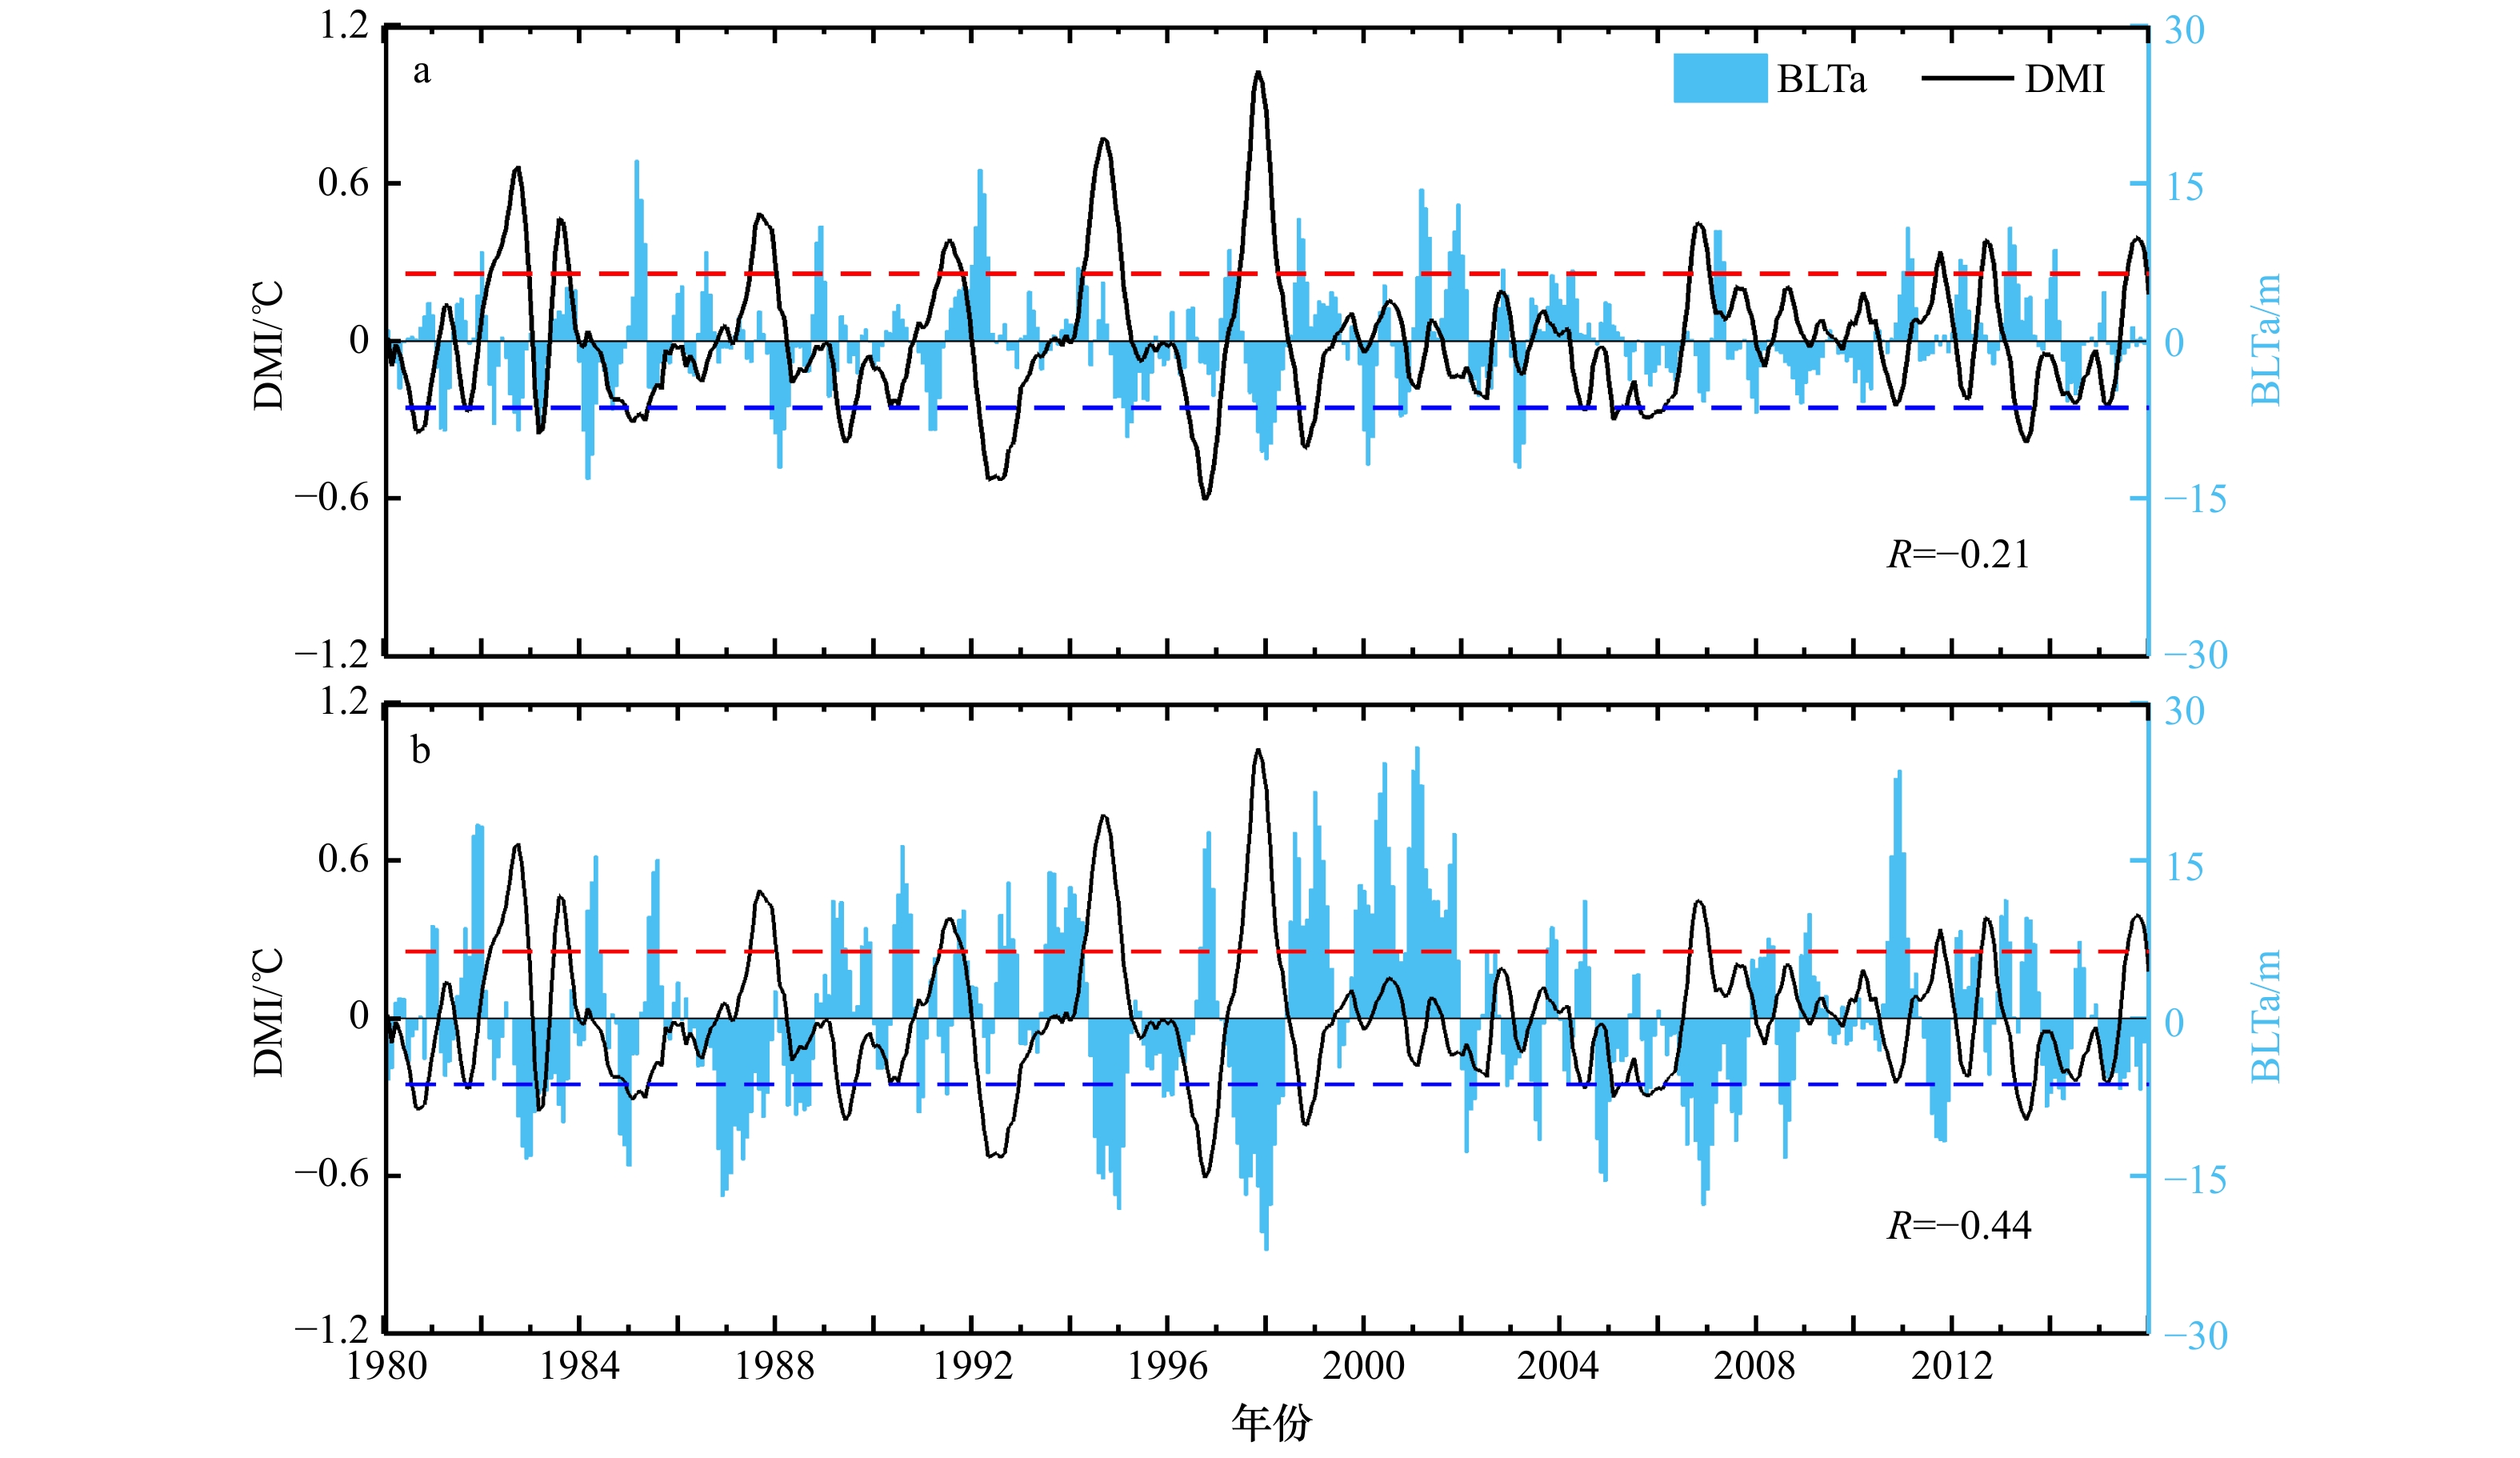
图 4 1区(a)和2区(b)障碍层厚度异常(BLTa)及偶极子模态指数(DMI)时间序列
R为BLTa与DMI相关系数(超过95%置信水平),红、蓝虚线分别为DMI序列正、负1倍标准差
Fig. 4 Barrier layer thickness anomaly (BLTa) and Dipole Mode Index (DMI) in Zone 1 (a) and Zone 2 (b)
R is the correlation coefficients between BLTa and DMI. The red and blue dashed lines represent the positive and negative standard deviation values of the DMI
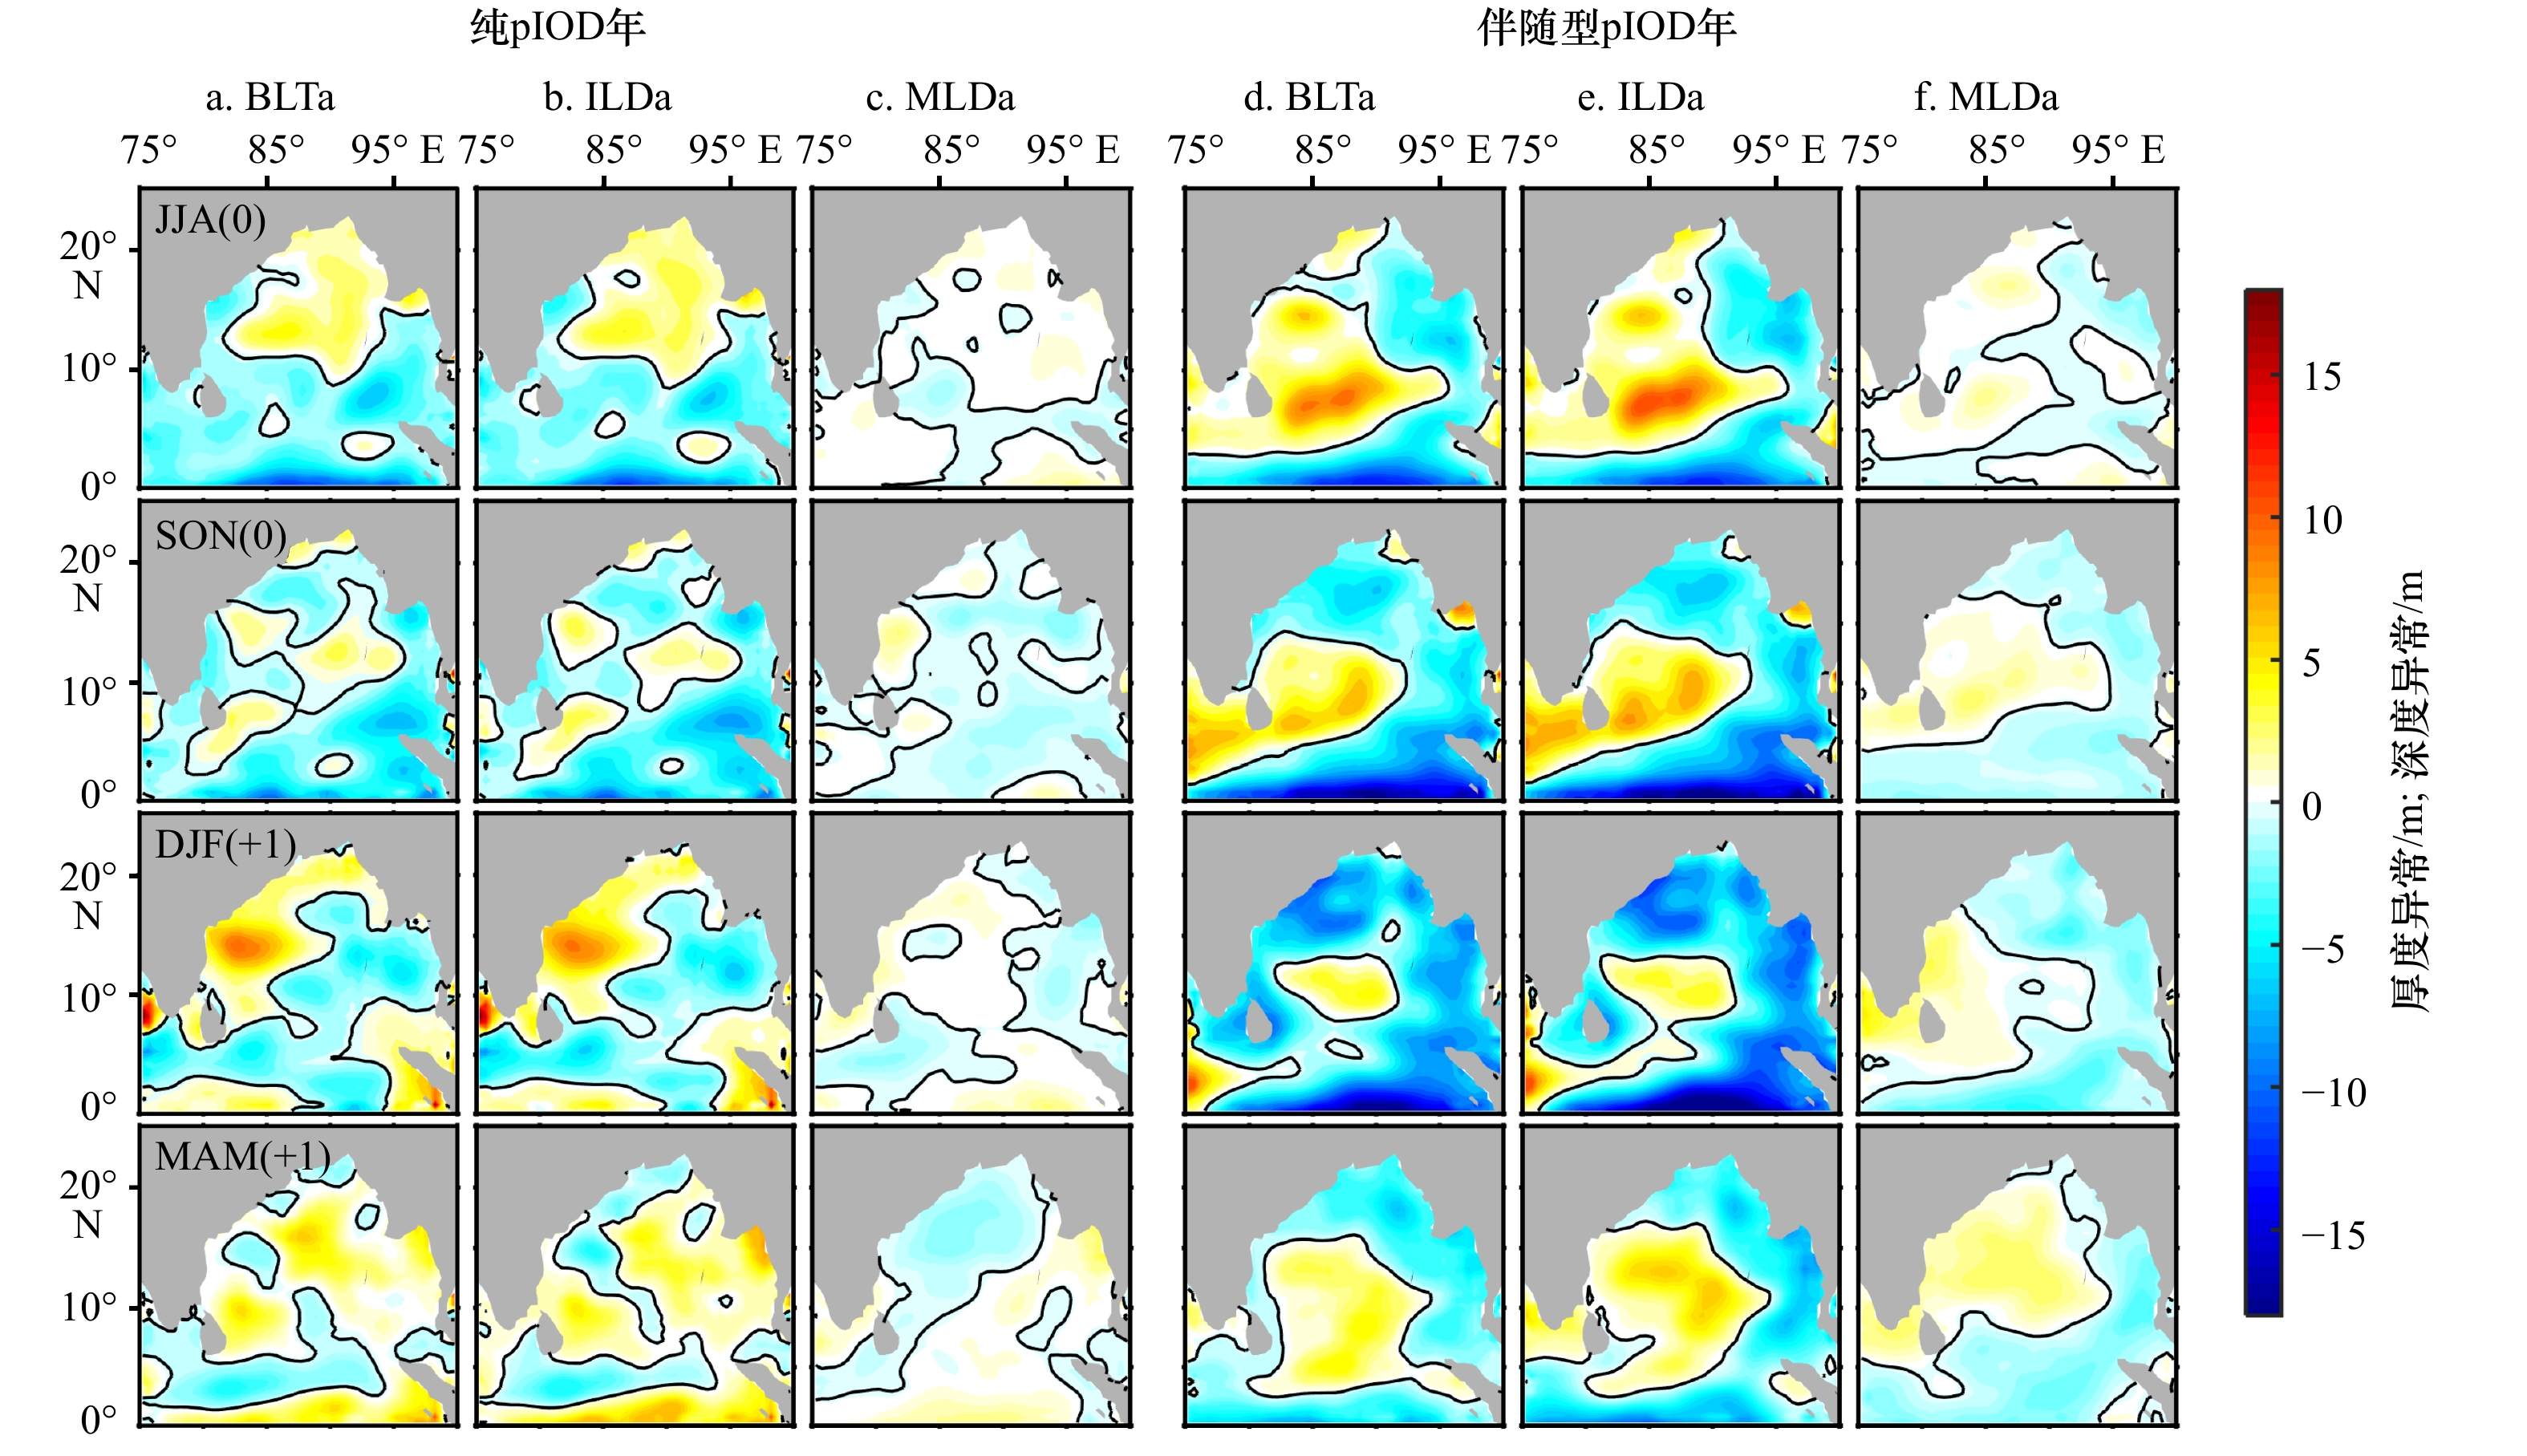
图 5 纯pIOD年和伴随型pIOD年(pIOD+El Niño)情况下,障碍层厚度异常、等温层深度异常和混合层深度异常的分布
纯pIOD年障碍层厚度异常(BLTa)、等温层深度异常(ILDa)、混合层深度异常(MLDa)时空分布如a−c列所示,从上至下分别为发展期[6−8月,JJA(0)]、鼎盛期[9−11月,SON(0)]、消亡期[12月至翌年2月,DJF(+1)及翌年3−5月,MAM(+1)],黑色等值线为异常值0线;伴随型pIOD年内容同纯pIOD年,BLTa、ILDa、MLDa分别由d−f列表示
Fig. 5 Barrier layer thickness anomaly, isothermal layer depth anomaly, mixed layer depth anomaly in pIOD events and pIOD+El Niño events
Barrier layer thickness anomaly (BLTa), isothermal layer depth anomaly (ILDa), mixed layer depth anomaly (MLDa) in pIOD events are shown in figures a−c. The development period [June to August, JJA(0)], peak period [September to November, SON(0)], and extinction period [December to February, DJF(+1) and March to May of the following year, MAM (+1)] are shown from top to bottom, the black contour is the anomaly of 0 value. BLTa, ILDa, and MLDa in pIOD+El Niño events are shown in figures d−f
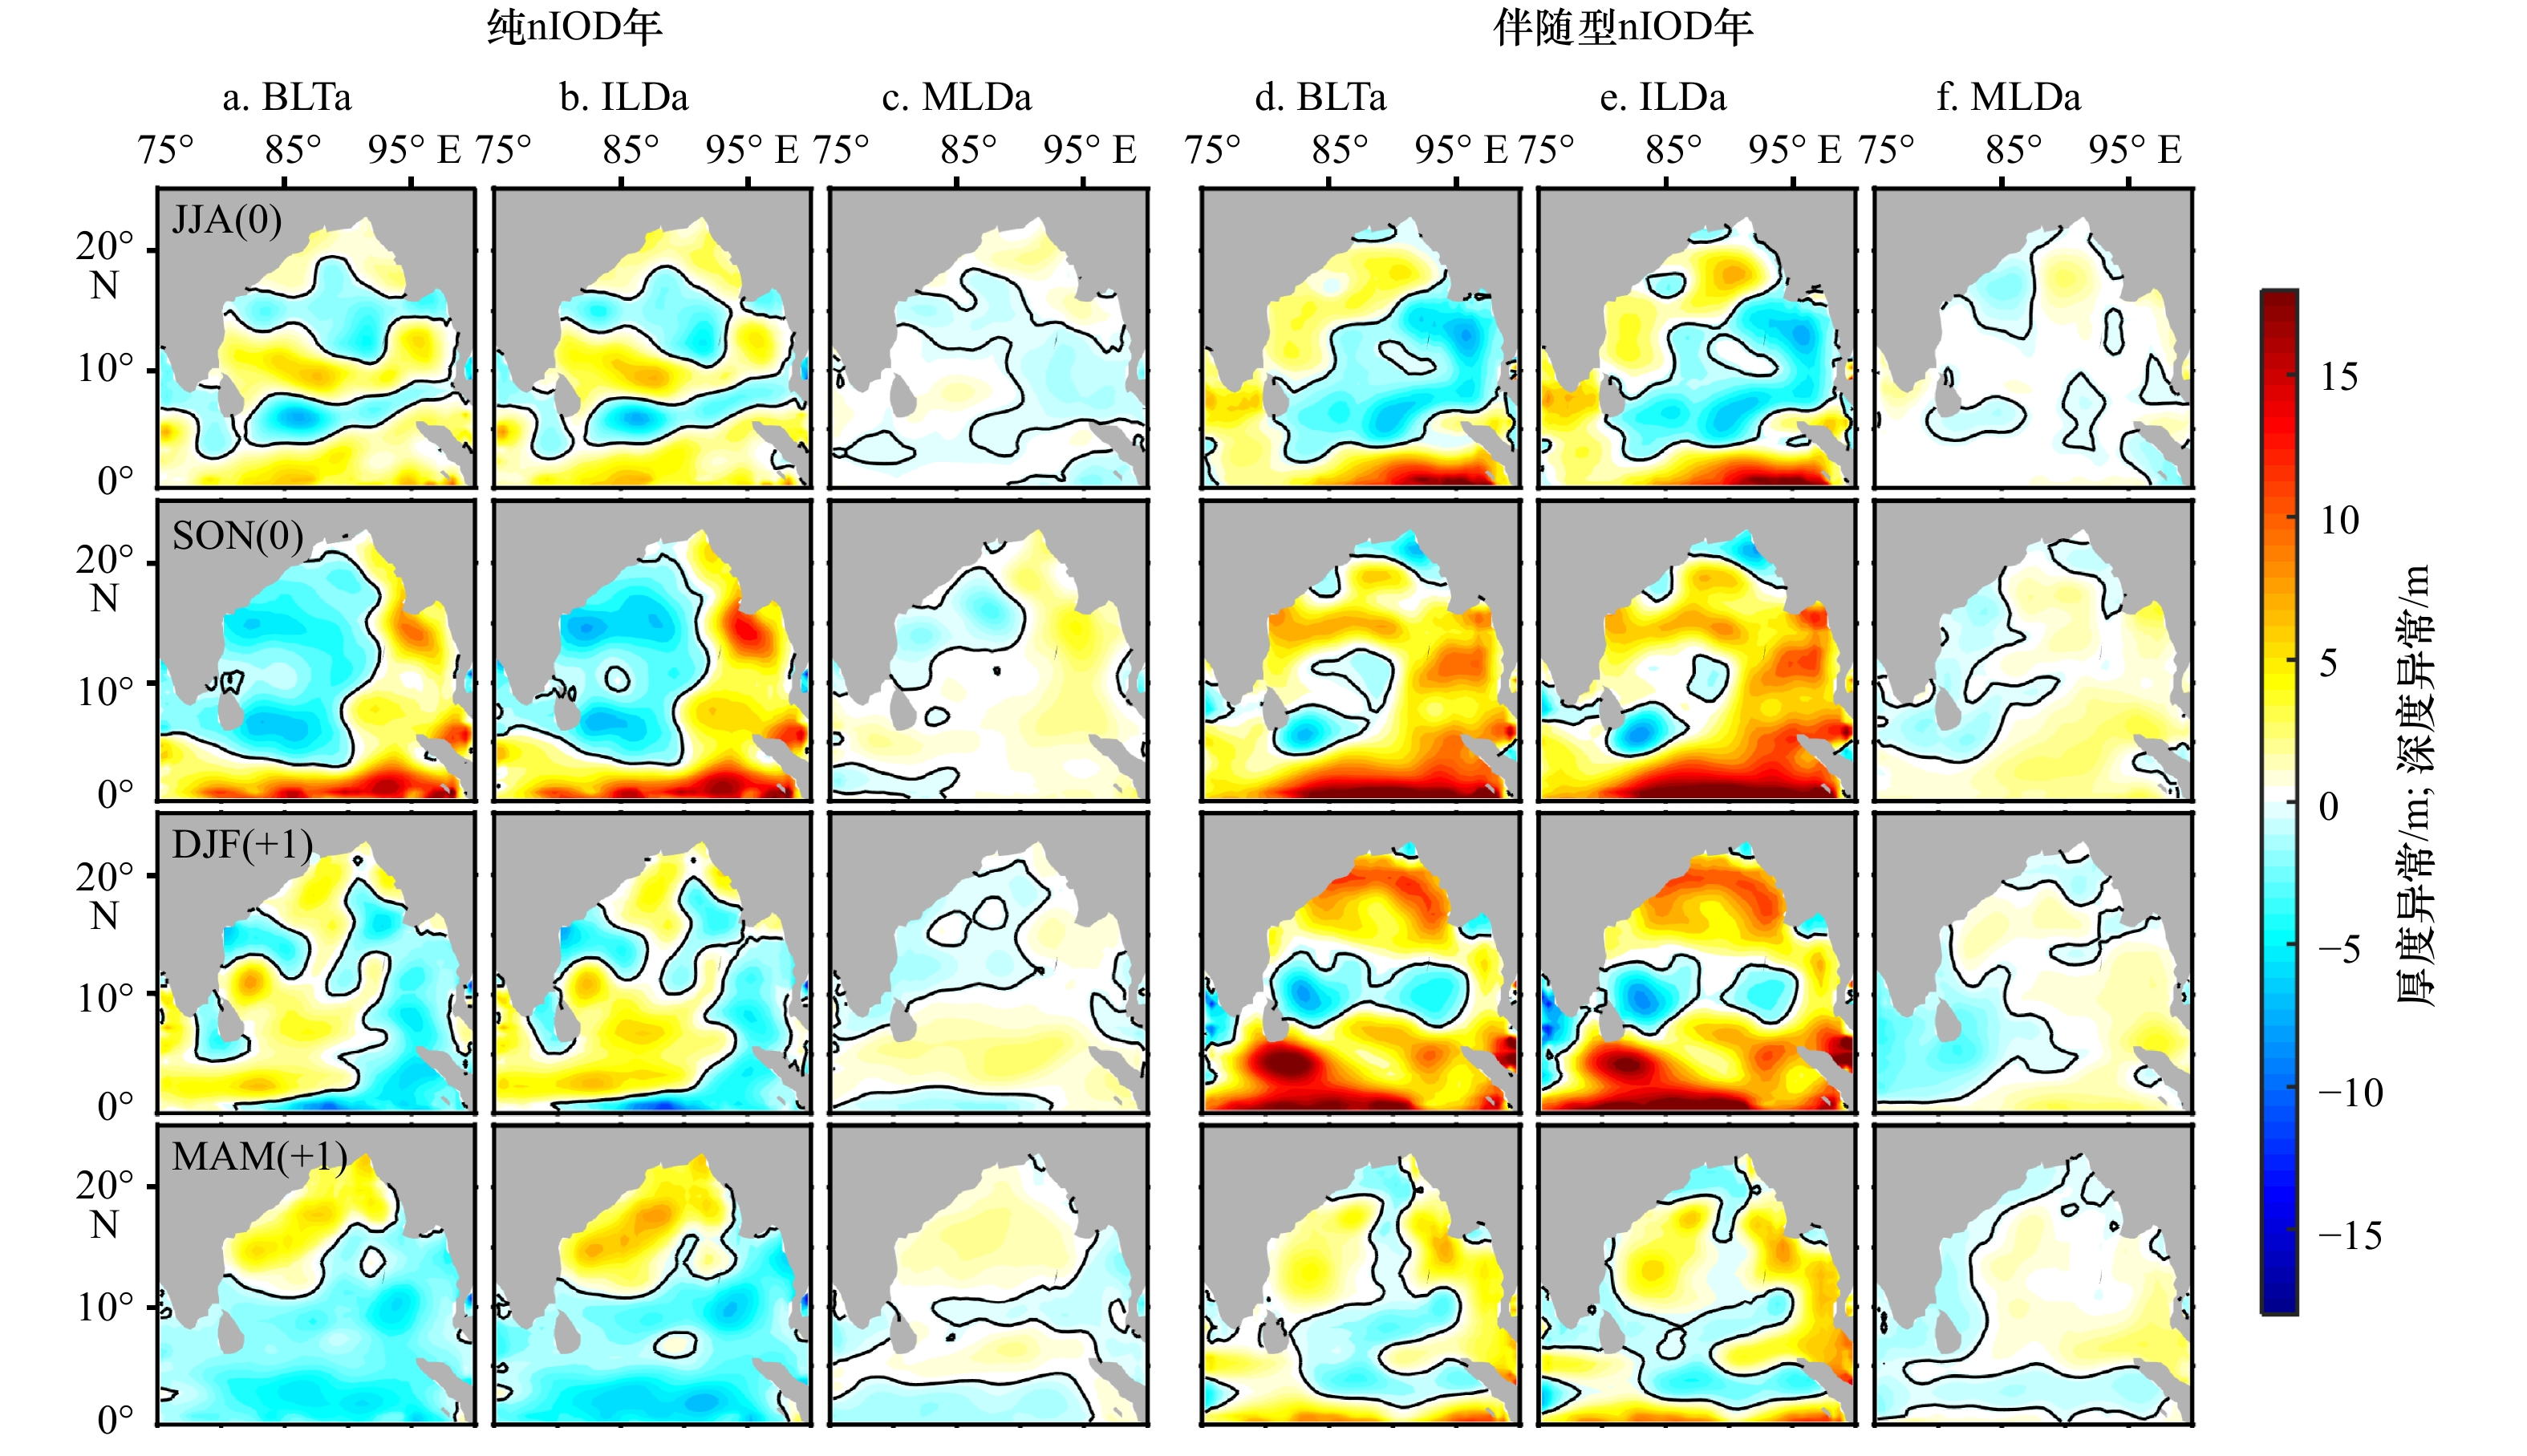
图 6 纯nIOD年和伴随型nIOD(nIOD+La Niña)年情况下,障碍层厚度异常、等温层深度异常和混合层深度异常的分布
纯nIOD年障碍层厚度异常(BLTa)、等温层深度异常(ILDa)、混合层深度异常(MLDa)时空分布如a−c列所示,从上至下分别为发展期[6−8月,JJA(0)]、鼎盛期[9−11月,SON(0)]、消亡期[12月至翌年2月,DJF(+1)及翌年3−5月,MAM(+1)],黑色等值线为异常值0线;伴随型nIOD年内容同纯nIOD年,BLTa、ILDa、MLDa分别由d-f列表示
Fig. 6 Barrier layer thickness anomaly, isothermal layer depth anomaly, mixed layer depth anomaly in nIOD events and nIOD+La Niña events
Barrier layer thickness anomaly (BLTa), isothermal layer depth anomaly (ILDa), mixed layer depth anomaly (MLDa) in nIOD events are shown in figures a−c. The development period [June to August, JJA(0)], peak period [September to November, SON(0)], and extinction period [December to February, DJF(+1) and March to May of the following year, MAM (+1)] are shown from top to bottom, the black contour is the anomaly of 0 value. BLTa, ILDa, and MLDa in nIOD+El Niño events are shown in figures d−f

图 7 pIOD事件(a)、pIOD+El Niño事件(b)、nIOD事件(c)和nIOD+La Niña事件(d)情况下,风场异常(矢量)及风应力旋度异常(填色)时空分布
从上至下分别为发展期[6−8月,JJA(0)]、鼎盛期[9−11月,SON(0)]、消亡期[12月至翌年2月,DJF(+1)及翌年3−5月,MAM(+1)]
Fig. 7 Wind anomaly (vector) and wind stress curl anomaly (shaded) in pIOD events (a), pIOD+El Niño events (b), nIOD events (c) and nIOD+La Niña events (d)
The development period [June to August, JJA(0)], peak period [September to November, SON(0)], and extinction period [December to February, DJF(+1) and March to May of the following year, MAM (+1)] are shown from top to bottom
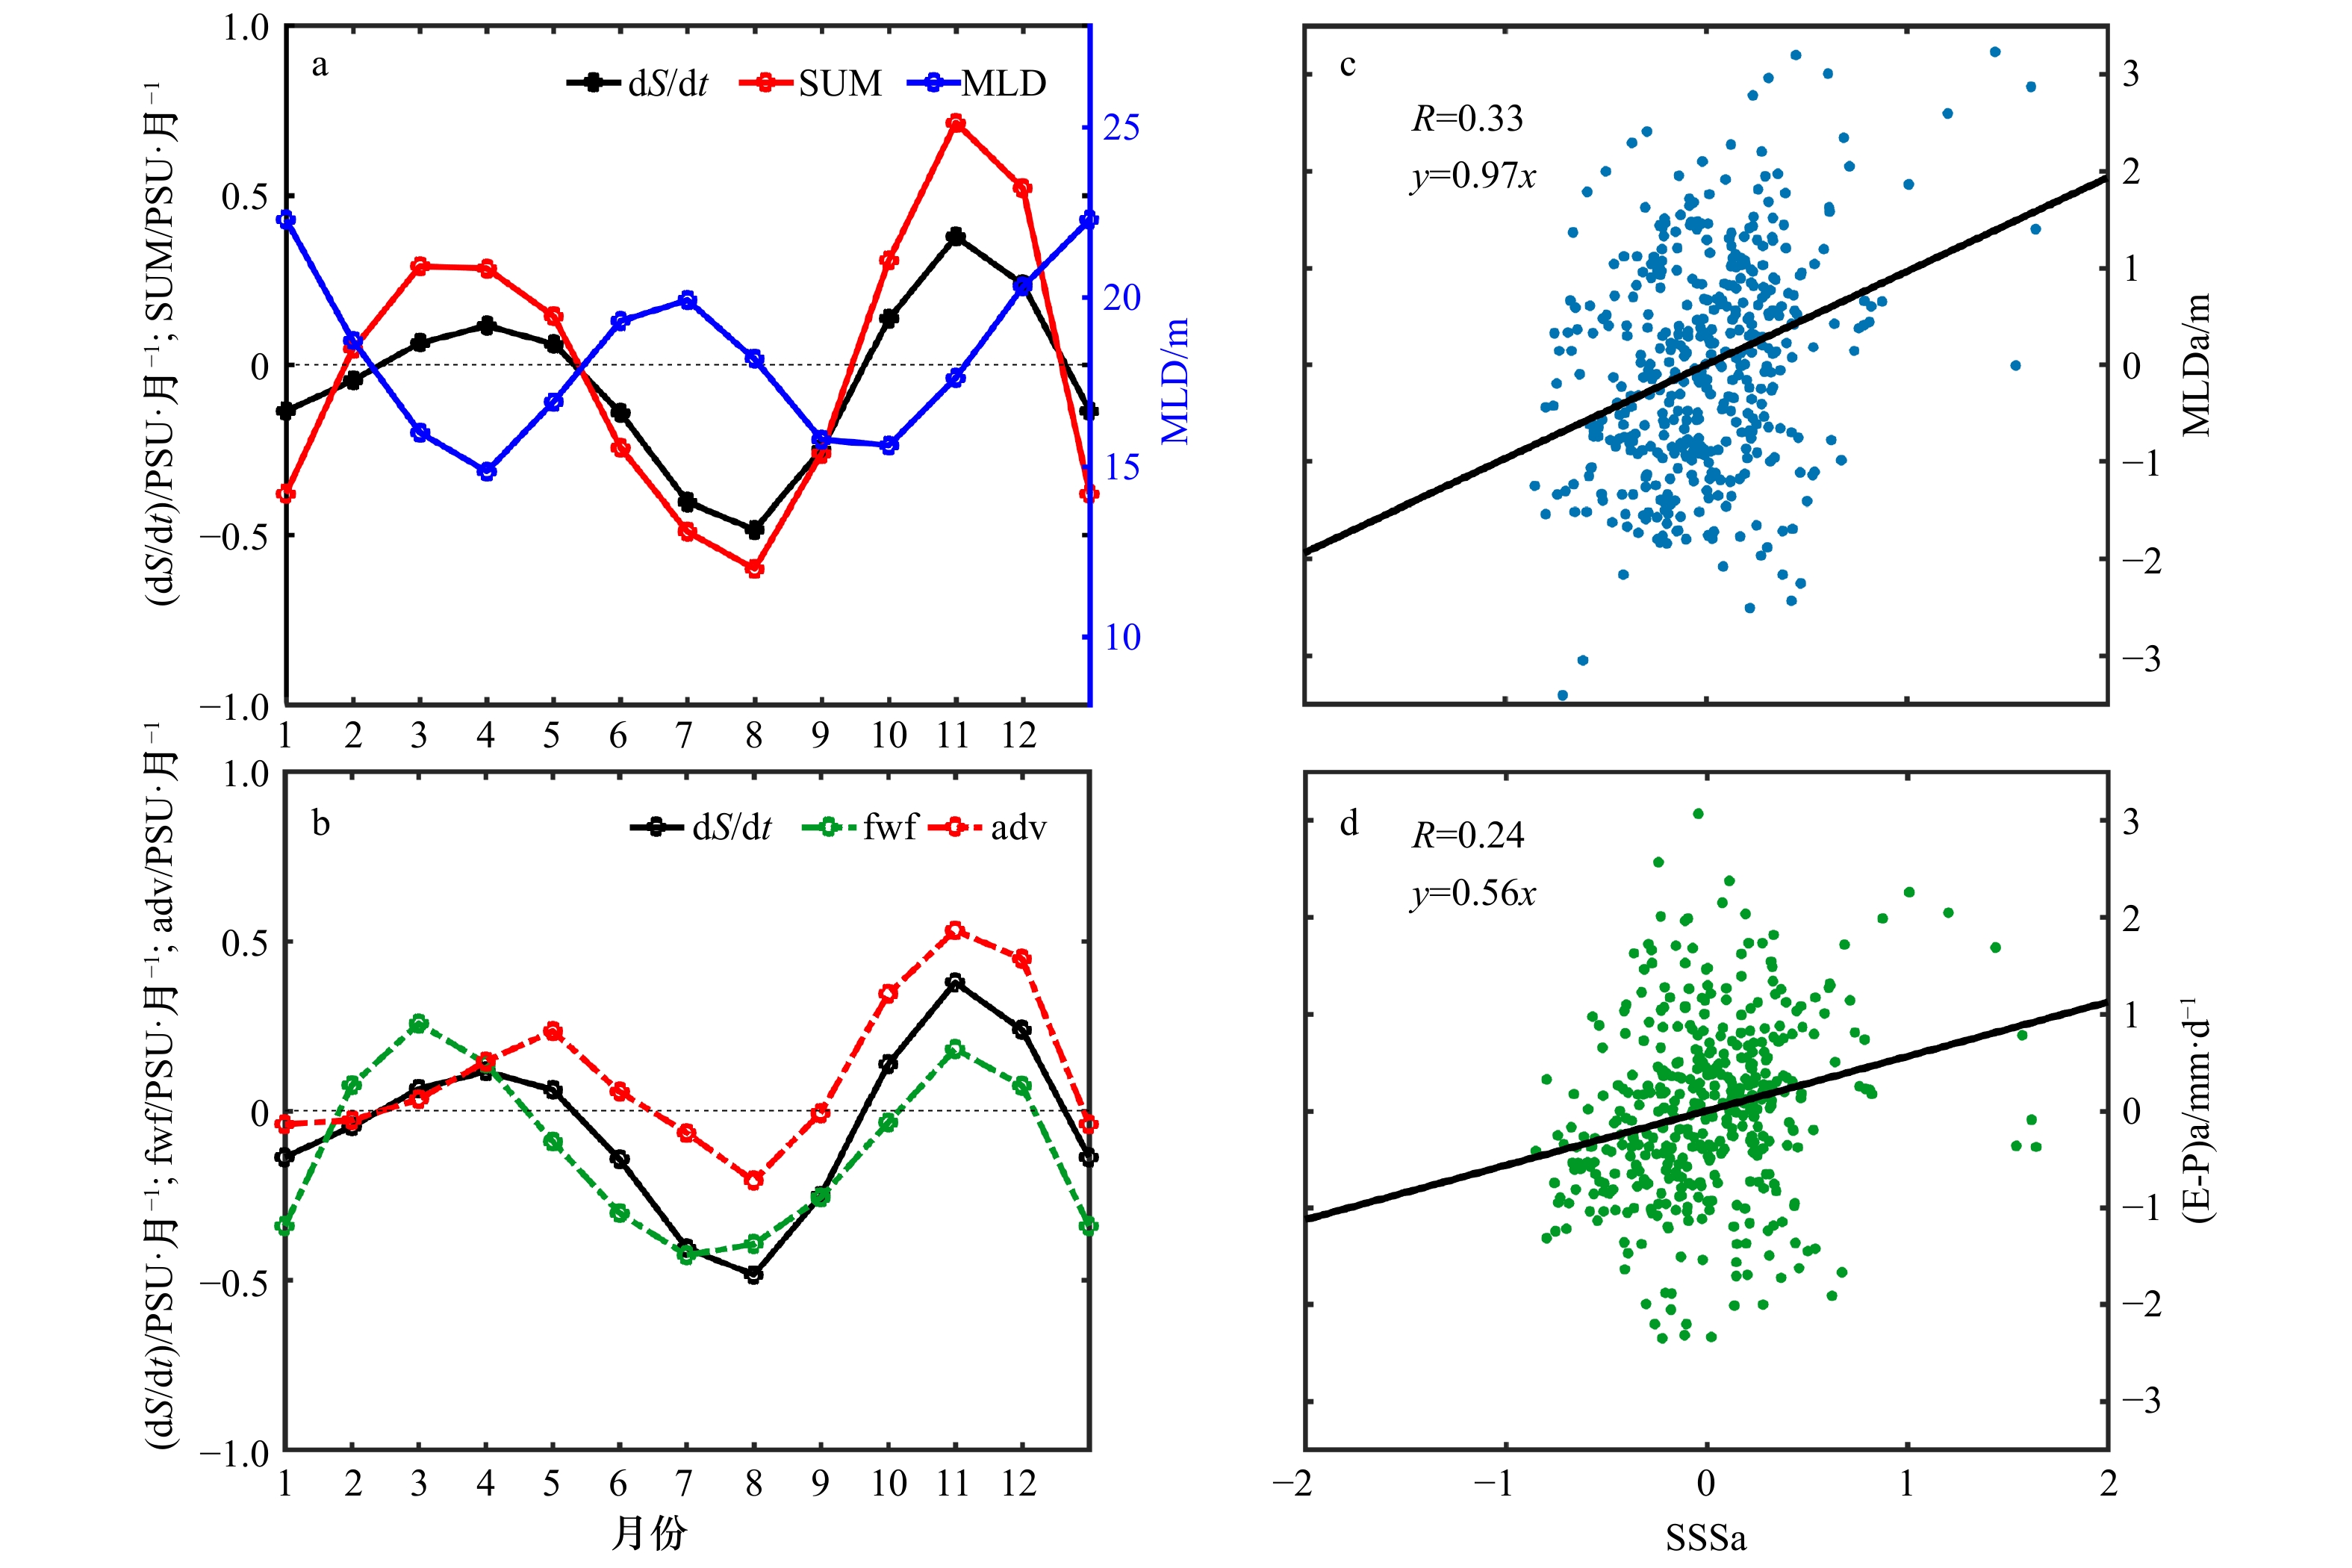
图 8 孟加拉湾北部月平均混合层深度(MLD)、盐度时间变化项(dS/dt)、盐度收支方程右侧之和(SUM)(a);盐度时间变化项(dS/dt)、淡水通量项(蒸发减去降水,fwf)、水平平流和垂向夹卷之和(adv)(b);海表盐度异常(SSSa)与混合层深度异常(MLDa)(c)及淡水通量异常[(E-P)a](d)的散点图(相关系数达到99%置信水平)
Fig. 8 Monthly average mixed layer depth (MLD), salinity monthly tendency (dS/dt) and the sum of salinity balance equation (SUM) in the north of the Bay of Bengal (a); salinity monthly tendency (dS/dt), freshwater flux (fwf), sum of horizontal (zonal & meridional) advection and entrainment (adv)(b); scatterplots of SSSa versus MLDa (c); scatterplots of SSSa versus (E-P)a (d), with those significance at 99% confidence level
表 1 印度洋偶极子(IOD)事件年份的分类
Tab. 1 Classification of Indian Ocean Dipole (IOD) events
pIOD nIOD 纯的IOD 1983年,2006年,2012年 1981年,1989年,1992年,1996年,2014年 伴随型IOD 1982年,1994年,1997年,2015年 1998年,2010年  下载: 导出CSV
-
[1] Godfrey J S, Lindstrom E J. The heat budget of the equatorial western Pacific surface mixed layer[J]. Journal of Geophysical Research: Oceans, 1989, 94(C6): 8007−8017. doi: 10.1029/JC094iC06p08007 [2] Maes C, Picaut J, Belamari S, et al. Salinity barrier layer and onset of El Niño in a Pacific coupled model[J]. Geophysical Research Letters, 2002, 29(24): 2206. [3] Masson S, Luo J J, Madec G, et al. Impact of barrier layer on winter-spring variability of the southeastern Arabian Sea[J]. Geophysical Research Letters, 2005, 32(7): L07703. [4] Shetye S R, Gouveia A D, Shankar D, et al. Hydrography and circulation in the western Bay of Bengal during the northeast monsoon[J]. Journal of Geophysical Research: Oceans, 1996, 101(C6): 14011−14025. doi: 10.1029/95JC03307 [5] Sprintall J, Tomczak M. Evidence of the barrier layer in the surface layer of the tropics[J]. Journal of Geophysical Research: Oceans, 1992, 97(C5): 7305−7316. doi: 10.1029/92JC00407 [6] Murty V S, Sarma Y V, Rao D P, et al. Variability of the oceanic boundary layer characteristics in the northern Bay of Bengal during MONTBLEX-90[J]. Journal of Earth System Science, 1996, 105(1): 41−61. doi: 10.1007/BF02880758 [7] Vinayachandran P N, Murty V S, Babu V R, et al. Observations of barrier layer formation in the Bay of Bengal during summer monsoon[J]. Journal of Geophysical Research, 2002, 107(C12): 8018. [8] De Boyer Montégut C, Mignot J, Lazar A, et al. Control of salinity on the mixed layer depth in the world ocean. 1. General description[J]. Journal of Geophysical Research, 2007, 112(C6): C06011. [9] Thadathil P, Muraleedharan P M, Rao R R, et al. Observed seasonal variability of barrier layer in the Bay of Bengal[J]. Journal of Geophysical Research: Oceans, 2007, 112(C2): C02009. [10] Girishkumar M S, Ravichandran M, McPhaden M J, et al. Intraseasonal variability in barrier layer thickness in the south central Bay of Bengal[J]. Journal of Geophysical Research: Oceans, 2011, 116(C3): C03009. [11] Qiu Y, Cai W, Li L, et al. Argo profiles variability of barrier layer in the tropical Indian Ocean and its relationship with the Indian Ocean Dipole[J]. Geophysical Research Letters, 2012, 39(8): L08605. [12] Kumari A, Kumar S P, Chakraborty A. Seasonal and interannual variability in the barrier layer of the Bay of Bengal[J]. Journal of Geophysical Research: Oceans, 2018, 123(2): 1001−1015. doi: 10.1002/2017JC013213 [13] 郭飞燕. 热带印度洋海温年际变化主模态的分类及其与ENSO的联系[D]. 青岛: 中国海洋大学, 2015.Guo Feiyan. Classfication of the SST interannual variability major modes of tropical Indian Ocean and their relations with ENSO[D]. Qingdao: Ocean University of China, 2015. [14] Carton J A, Chepurin G A, Chen L, et al. SODA3: a new ocean climate reanalysis[J]. Journal of Climate, 2018, 31(17): 6967−6983. doi: 10.1175/JCLI-D-18-0149.1 [15] Atlas R, Hoffman R N, Ardizzone J, et al. A cross-calibrated, multiplatform ocean surface wind velocity product for meteorological and oceanographic applications[J]. Bulletin of the American Meteorological Society, 2011, 92(2): 157−174. doi: 10.1175/2010BAMS2946.1 [16] Yu L, Weller R A. Objectively analyzed air-sea heat fluxes for the global ice-free oceans (1981–2005)[J]. Bulletin of the American Meteorological Society, 2007, 88(4): 527−540. doi: 10.1175/BAMS-88-4-527 [17] Xie P, Arkin P A. Global precipitation: A 17-year monthly analysis based on gauge observations, satellite estimates, and numerical model outputs[J]. Bulletin of the American Meteorological Society, 1997, 78(11): 2539−2558. doi: 10.1175/1520-0477(1997)078<2539:GPAYMA>2.0.CO;2 [18] Price J F, Weller R A, Pinkel R, et al. Diurnal cycling: Observations and models of the upper ocean response to diurnal heating, cooling, and wind mixing[J]. Journal of Geophysical Research: Oceans, 1986, 91(C7): 8411−8427. doi: 10.1029/JC091iC07p08411 [19] Kara A B, Rochford P A, Hurlburt H E, et al. An optimal definition for ocean mixed layer depth[J]. Journal of Geophysical Research: Oceans, 2000, 105(C7): 16803−16821. doi: 10.1029/2000JC900072 [20] Oey L Y, Ezer T, Wang D P, et al. Loop current warming by Hurricane Wilma[J]. Geophysical Research Letters, 2006, 33(8): L08613. [21] Feng M, Hacker P, Lukas R, et al. Upper ocean heat and salt balances in response to a westerly wind burst in the western equatorial Pacific during TOGA COARE[J]. Journal of Geophysical Research: Oceans, 1998, 103(C5): 10289−10311. doi: 10.1029/97JC03286 [22] Zhang Y H, Du Y, Zheng S J, et al. Impact of Indian Ocean Dipole on the salinity budget in the equatorial Indian Ocean[J]. Journal of Geophysical Research: Oceans, 2013, 118(10): 4911−4923. doi: 10.1002/jgrc.20392 [23] Saji N H, Goswami B N, Vinayachandran P N, et al. A dipole mode in the tropical Indian Ocean[J]. Nature, 1999, 401(6751): 360−363. [24] Xie S P, Annamalai H, Schott F A, et al. Structure and mechanisms of South Indian Ocean climate variability[J]. Journal of Climate, 2002, 15(8): 864−878. doi: 10.1175/1520-0442(2002)015<0864:SAMOSI>2.0.CO;2 [25] Neelin J D, Jin F F, Syu H H, et al. Variations in ENSO phase locking[J]. Journal of Climate, 2000, 13(14): 2570−2590. doi: 10.1175/1520-0442(2000)013<2570:VIEPL>2.0.CO;2 [26] 刘秦玉, 谢尚平, 郑小童. 热带海洋−大气相互作用[M]. 北京: 高等教育出版社, 2013.Liu Qinyu, Xie Shangping, Zheng Xiaotong. Tropical Ocean−Atmosphere Interaction[M]. Beijing: Higher Education Press, 2013. [27] Zhi H, Zhang R H, Zheng F, et al. Assessment of interannual sea surface salinity variability and its effects on the barrier layer in the equatorial Pacific using BNU-ESM[J]. Advances in Atmospheric Sciences, 2016, 33(3): 339−351. doi: 10.1007/s00376-015-5163-y [28] Rao R R, Sivakumar R. Seasonal variability of sea surface salinity and salt budget of the mixed layer of the north Indian Ocean[J]. Journal of Geophysical Research: Oceans, 2003, 108(C1): 3009. doi: 10.1029/2001JC000907 [29] Zheng F, Zhang R H, Zhu J, et al. Effects of interannual salinity variability on the barrier layer in the western-central equatorial Pacific: A diagnostic analysis from Argo[J]. Advances in Atmospheric Sciences, 2014, 31(3): 532−542. doi: 10.1007/s00376-013-3061-8 [30] Zheng F, Zhang R H. Effects of interannual salinity variability and freshwater flux forcing on the development of the 2007/08 La Niña event diagnosed from Argo and satellite data[J]. Dynamics of Atmospheres and Oceans, 2012, 57: 45−57. doi: 10.1016/j.dynatmoce.2012.06.002 [31] Zhang R H, Zheng F, Zhu J, et al. Modulation of El Niño-Southern Oscillation by freshwater flux and salinity variability in the tropical Pacific[J]. Advances in Atmospheric Sciences, 2012, 29(4): 647−660. doi: 10.1007/s00376-012-1235-4 -

计量
- 文章访问数: 560
- HTML全文浏览量: 126
- PDF下载量: 49
- 被引次数: 0
