

Spatial structure characteristics of phytoplankton communities in the tropical eastern Indian Ocean in spring
-
摘要: 基于2013年3月至5月采集的热带东印度洋海域(10.0°S~4.0°N, 83.0°~97.5°E)浮游植物水样样品,分析了其种类组成、优势类群、细胞丰度等群落特征参数,综合比较了水平和垂向上浮游植物种类及丰度的差异性,初步探讨了其成因。结果表明:2013年春季热带东印度洋微型浮游植物共鉴定出306种,主要由硅藻、甲藻、金藻、蓝藻、裸藻和隐藻六大门类组成,其优势类群主要以粒径较小的隐藻、微型甲藻、菱形藻、环沟藻等为主。水平分布上,各水层浮游植物细胞丰度分布趋势相似,但斑块特征明显,其高值区位于88°E断面赤道以南次表层水域(30 m、75 m),局部区域细胞丰度值可达104 cells/L以上;与其毗邻的东南部、东部水域为低值区,并向赤道延伸。垂直剖面上,硅藻和甲藻广泛分布在各取样深度,但分布特征有明显的空间差异和规律,0 m、30 m大部分站位硅藻种类比例在0.2~0.3甚至更低,甲藻在0.7~0.8,随着水层加深(75 m、100 m、150 m、300 m),硅藻种类占比上升到0.5~0.6,甲藻降低到0.4~0.5,无论硅藻还是甲藻种类数75 m层最丰富。30 m和75 m水层细胞丰度明显高于其他水层。甲藻是热带东印度洋微型浮游植物种类和细胞丰度的重要贡献者,低生物量海域表现的更为明显,贡献率大于80%。该研究将极大丰富东印度洋浮游植物群落空间特征基础信息较匮乏的现状,为量化、评估该海域的生物资源提供数据支撑。Abstract: The phytoplankton water samples were collected in the multidisciplinary investigations in the tropical eastern Indian Ocean (10.0°S−4.0°N, 83.0°−97.5°E) during March to May, 2013. Phytoplankton community structure features were analyzed, including species composition, cell abundance, dominant species. In addition, the species composition and abundance of phytoplankton were compared comprehensively by horizontal and vertical investigation, and the probable causes were also discussed. A total of 306 species (including varieties and forms) were identified, which belonged to 6 phyla (Bacillariophyta, Pyrrophyta, Chrysophyta, Cyanophyta, Euglenophyta and Cryptophyta). The dominant groups were mainly Cryptomonadaceae, Nano-dinoflagellate, Nitzschina spp. (diatoms), Gyrodinium spp. (dinoflagellates), etc., which were smaller cells in size. Horizontally, the cell abundance was similar at different layers with patchy distribution characteristics. The high cell abundance (104 cells/L) was in subsurface water (30 m and 75 m) at south of the equator on 88°E section. However, adjacent to the high abundance area, a larger area of low abundance appeared in the eastern and southeastern parts of the survey area, which extended to the equator. Vertically, diatoms and dinoflagellates were widely distributed at different depths with obvious spatial pattern. At most stations of 0 m and 30 m layers, the proportion of diatoms was 0.2−0.3 or even lower, while that of dinoflagellates was 0.7−0.8; in deeper water layers (75 m, 100 m, 150 m, 300 m), the proportion of diatoms increased to 0.5−0.6, and that of dinoflagellates decreased to 0.4−0.5 inversely. The species richness of diatoms and dinoflagellates were relatively higher at 30 m and 75 m layers. Dinoflagellates were important contributors to the species composition and cell abundance of phytoplankton in the tropical eastern Indian Ocean, especially in low abundance area (80%). This study will greatly enrich the database of phytoplankton community characteristics in the tropical eastern Indian Ocean, and provide data support for quantifying and evaluating the biological resources in this area.
-
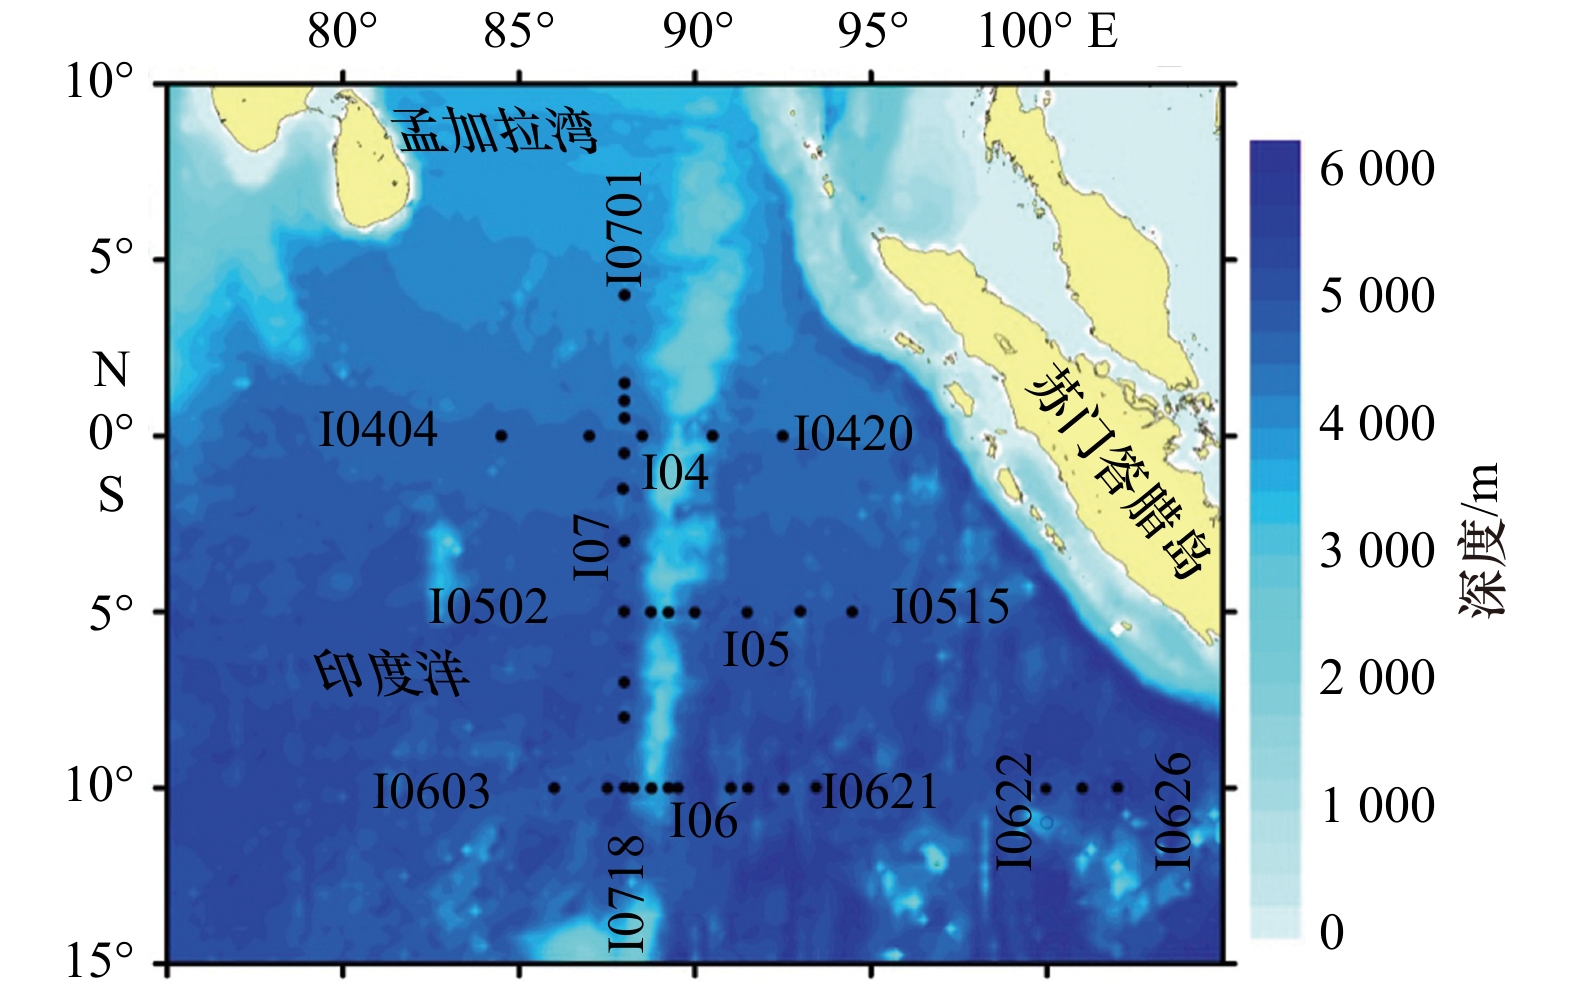
图 1 2013年春季热带东印度洋微型浮游植物观测站位
Fig. 1 Locations of investigated stations of water phytoplankton in the tropical eastern Indian Ocean in spring 2013
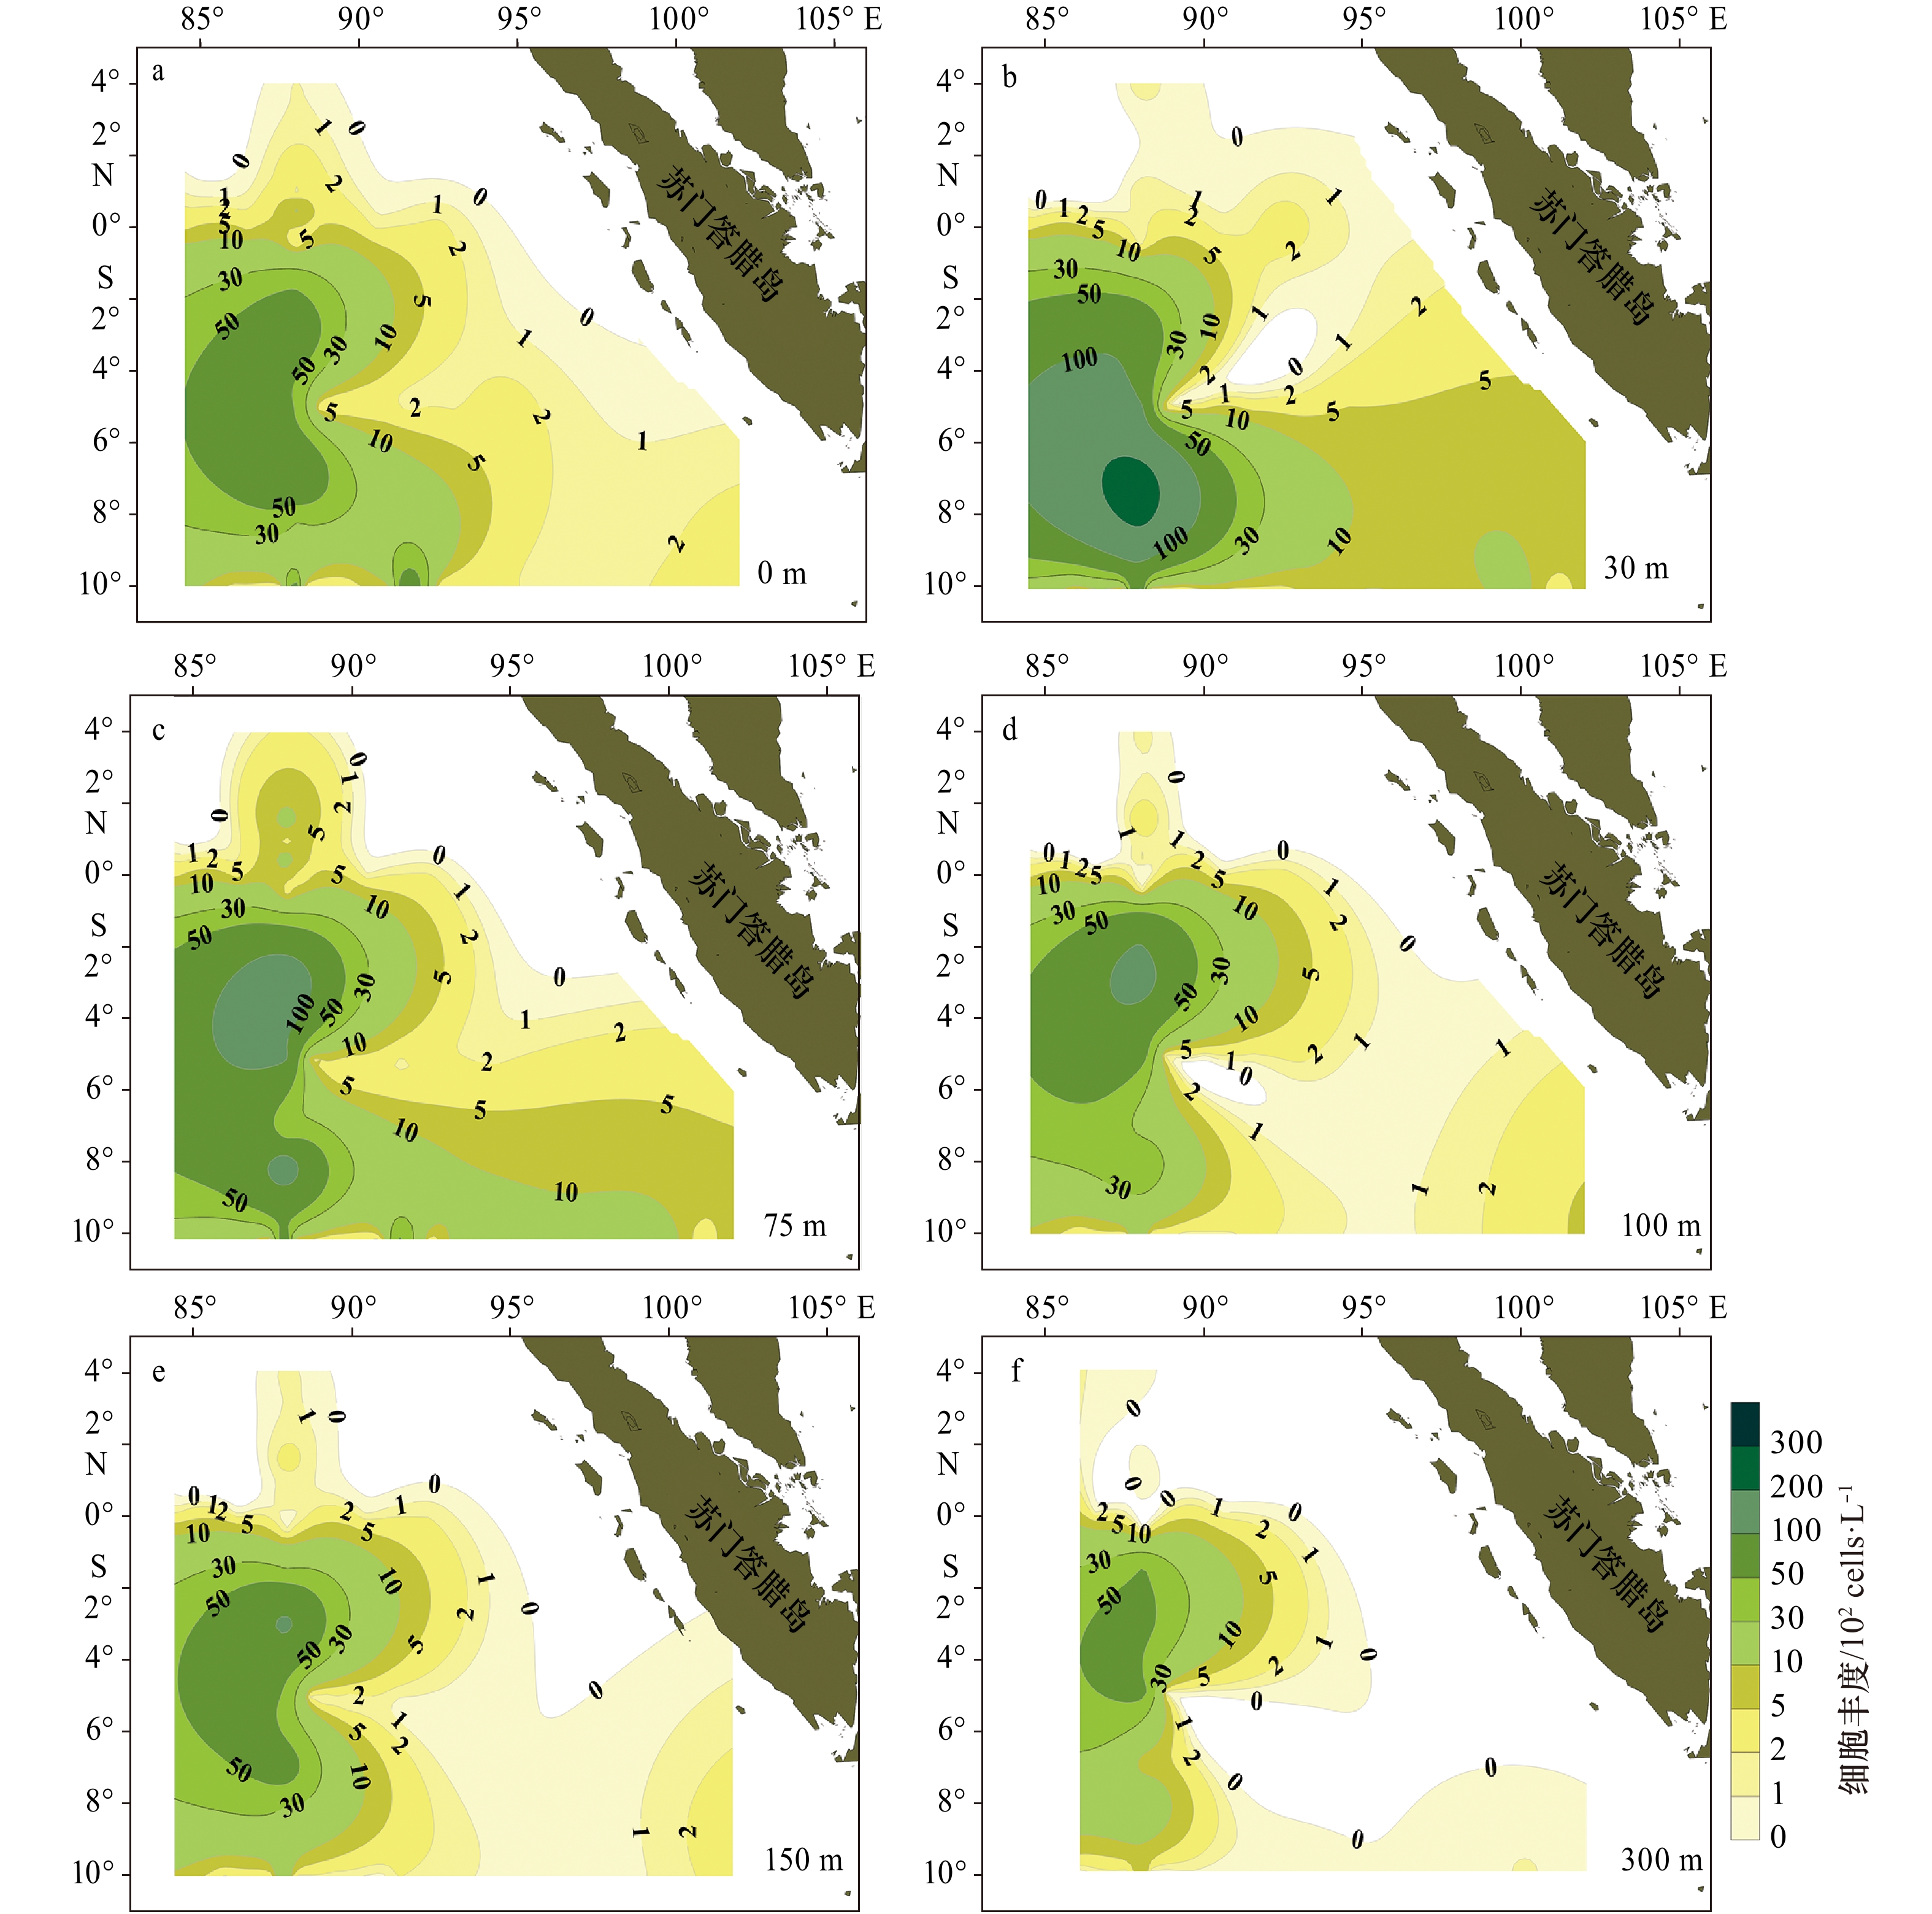
图 2 2013年春季热带东印度洋微型浮游植物细胞丰度水平分布
Fig. 2 Horizontal distribution of biomass of water phytoplankton in the tropical eastern Indian Ocean in spring 2013

图 3 2013年春季热带东印度洋各断面微型浮游植物细胞丰度
Fig. 3 Distribution of cell abundance of water phytoplankton in the tropical eastern Indian Ocean in spring in 2013

图 4 2013年春季热带东印度洋不同水层硅藻种类数相对比例
硅、甲藻种类数相对比例指硅藻物种数或甲藻物种数占硅、甲藻物种数之和的比例
Fig. 4 Relative proportion of species numbers of diatom in different layers in the tropical eastern Indian Ocean in spring 2013
The relative proportion of the species number of diatoms or dinoflagellates refers to the proportion of the species number of diatoms or dinoflagellates to the sum of them

图 5 2013年春季热带东印度洋不同水层甲藻种类数相对比例
硅、甲藻种类数相对比例指硅藻物种数或甲藻物种数占硅、甲藻物种数之和的比例
Fig. 5 Relative proportion of species numbers of dinoflagellate in different layers in the tropical eastern Indian Ocean in spring 2013
The relative proportion of the species number of diatoms or dinoflagellates refers to the proportion of the species number of diatoms or dinoflagellates to the sum of them
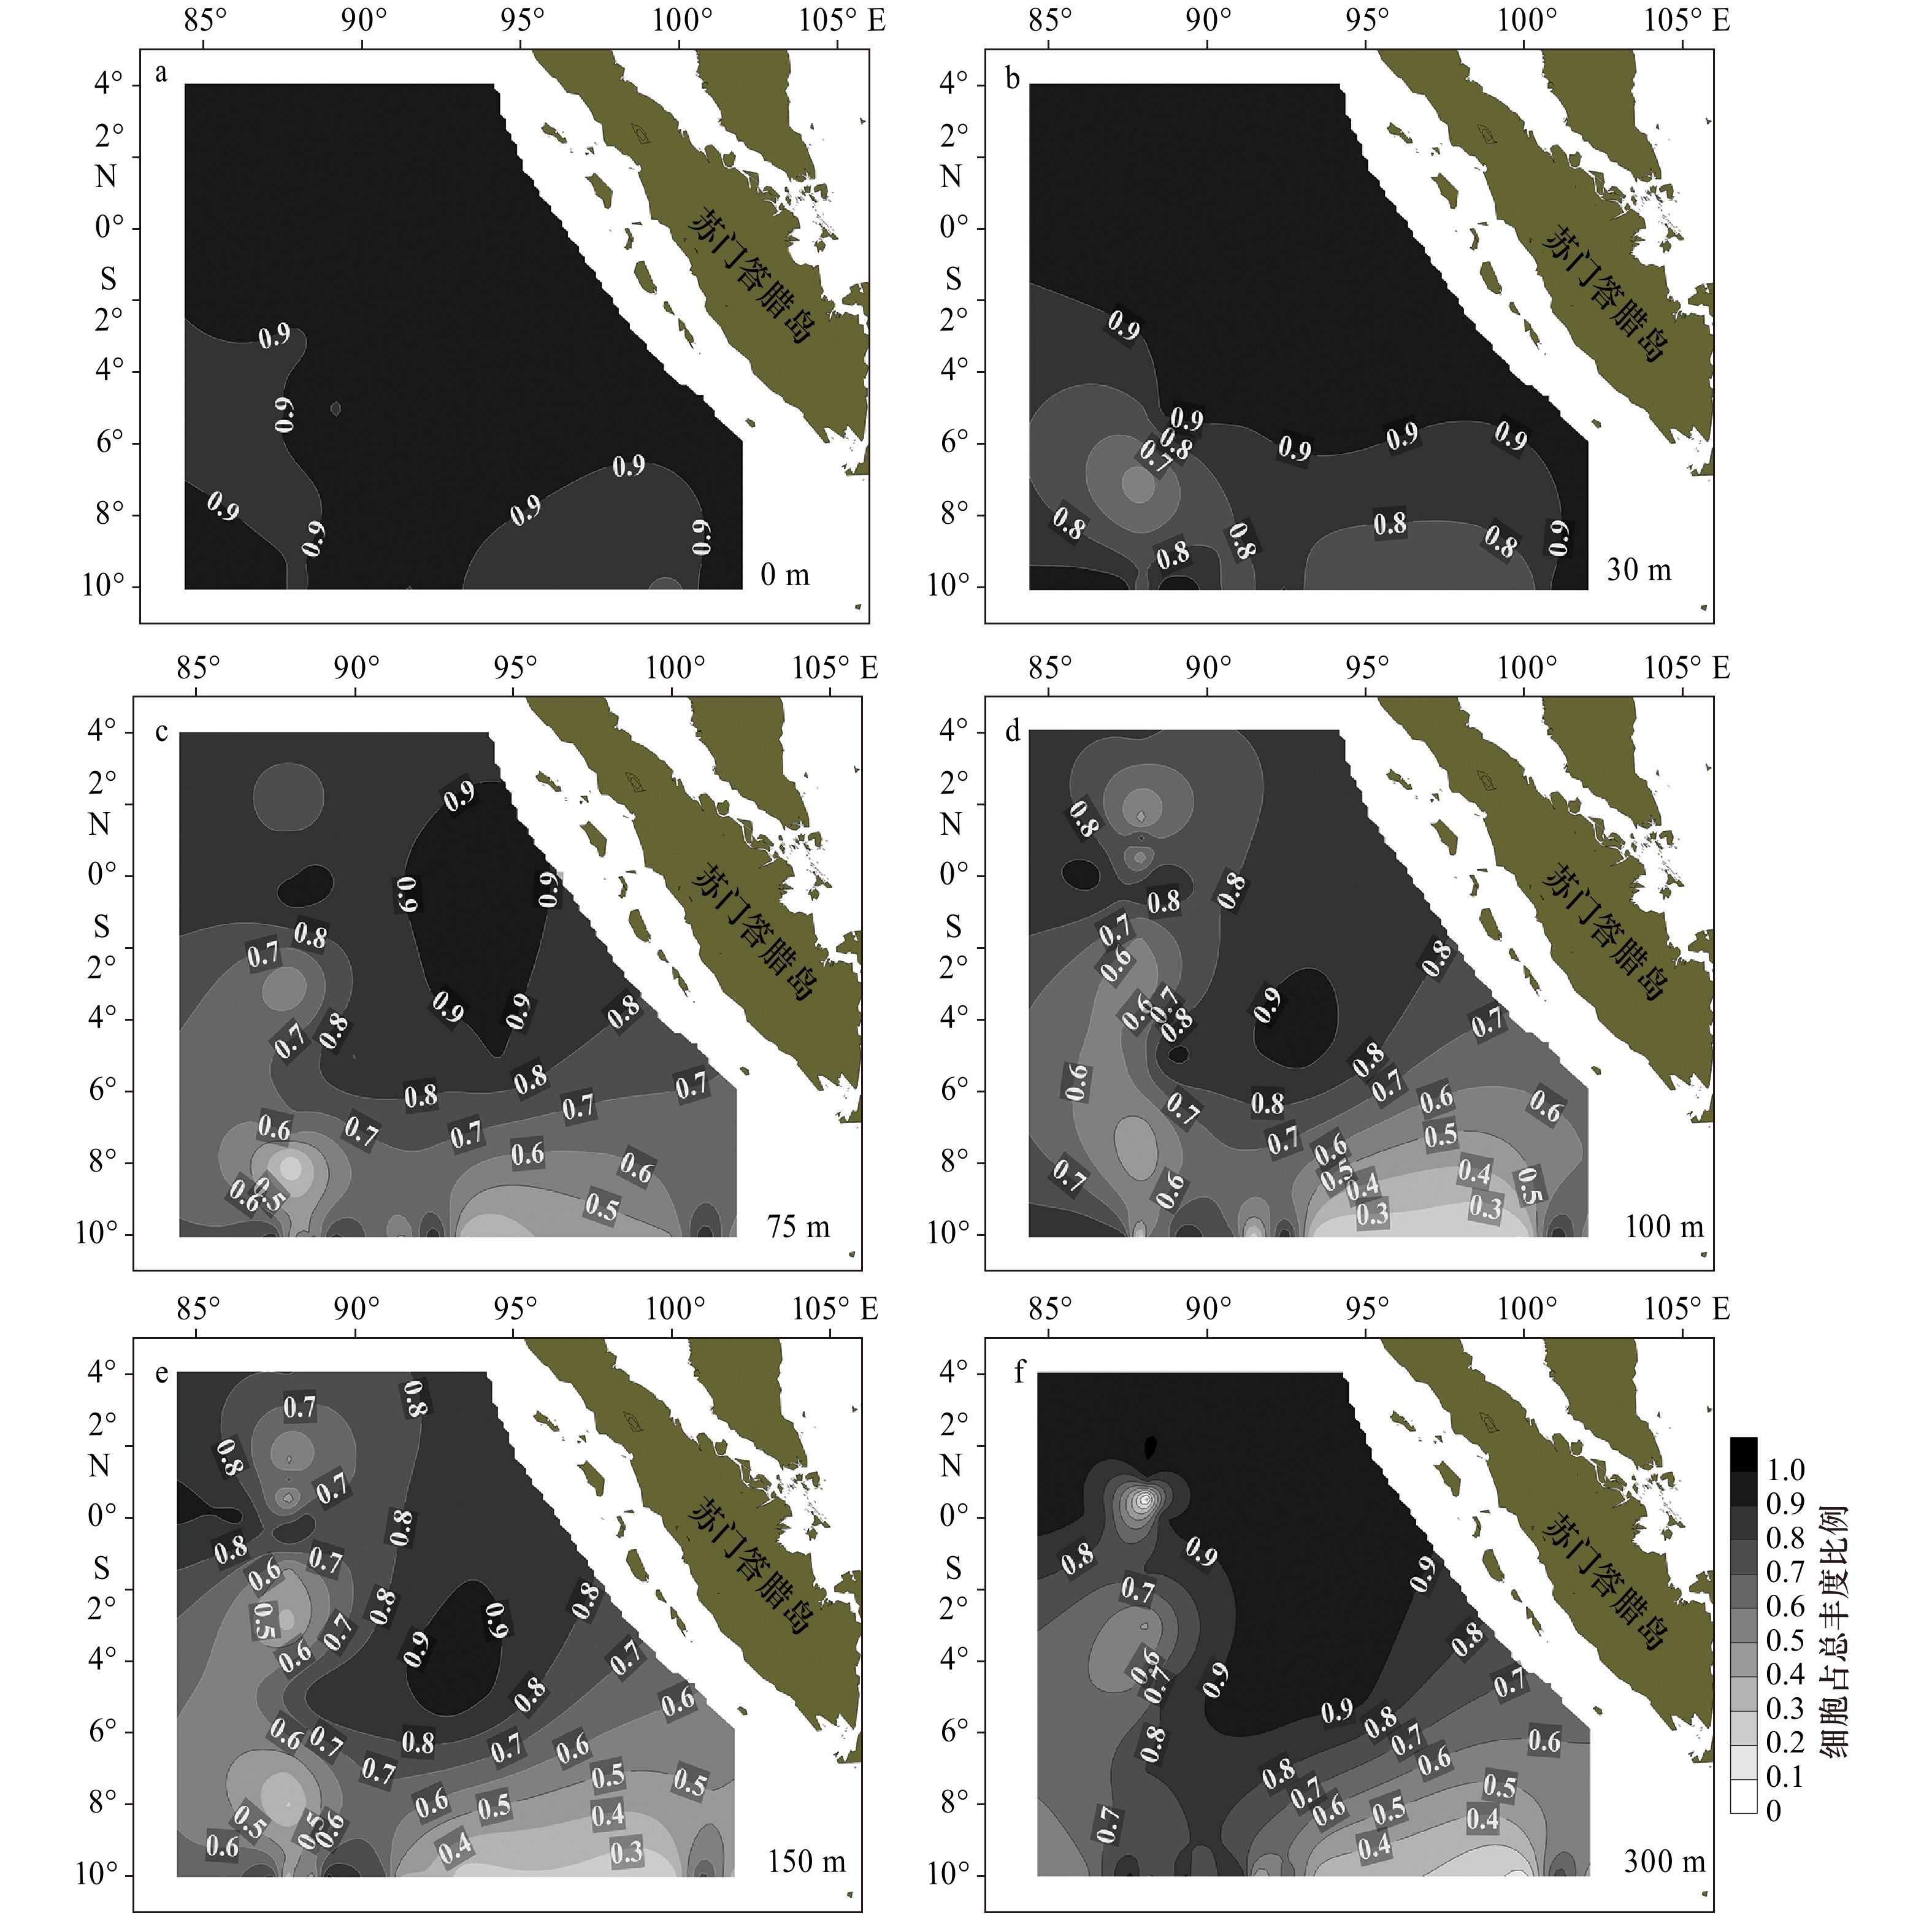
图 6 2013年春季热带东印度洋不同水层甲藻细胞占总丰度比例
Fig. 6 Proportion of abundance of dinoflagellate vs. total abundance in different layers in the tropical eastern Indian Ocean in spring 2013
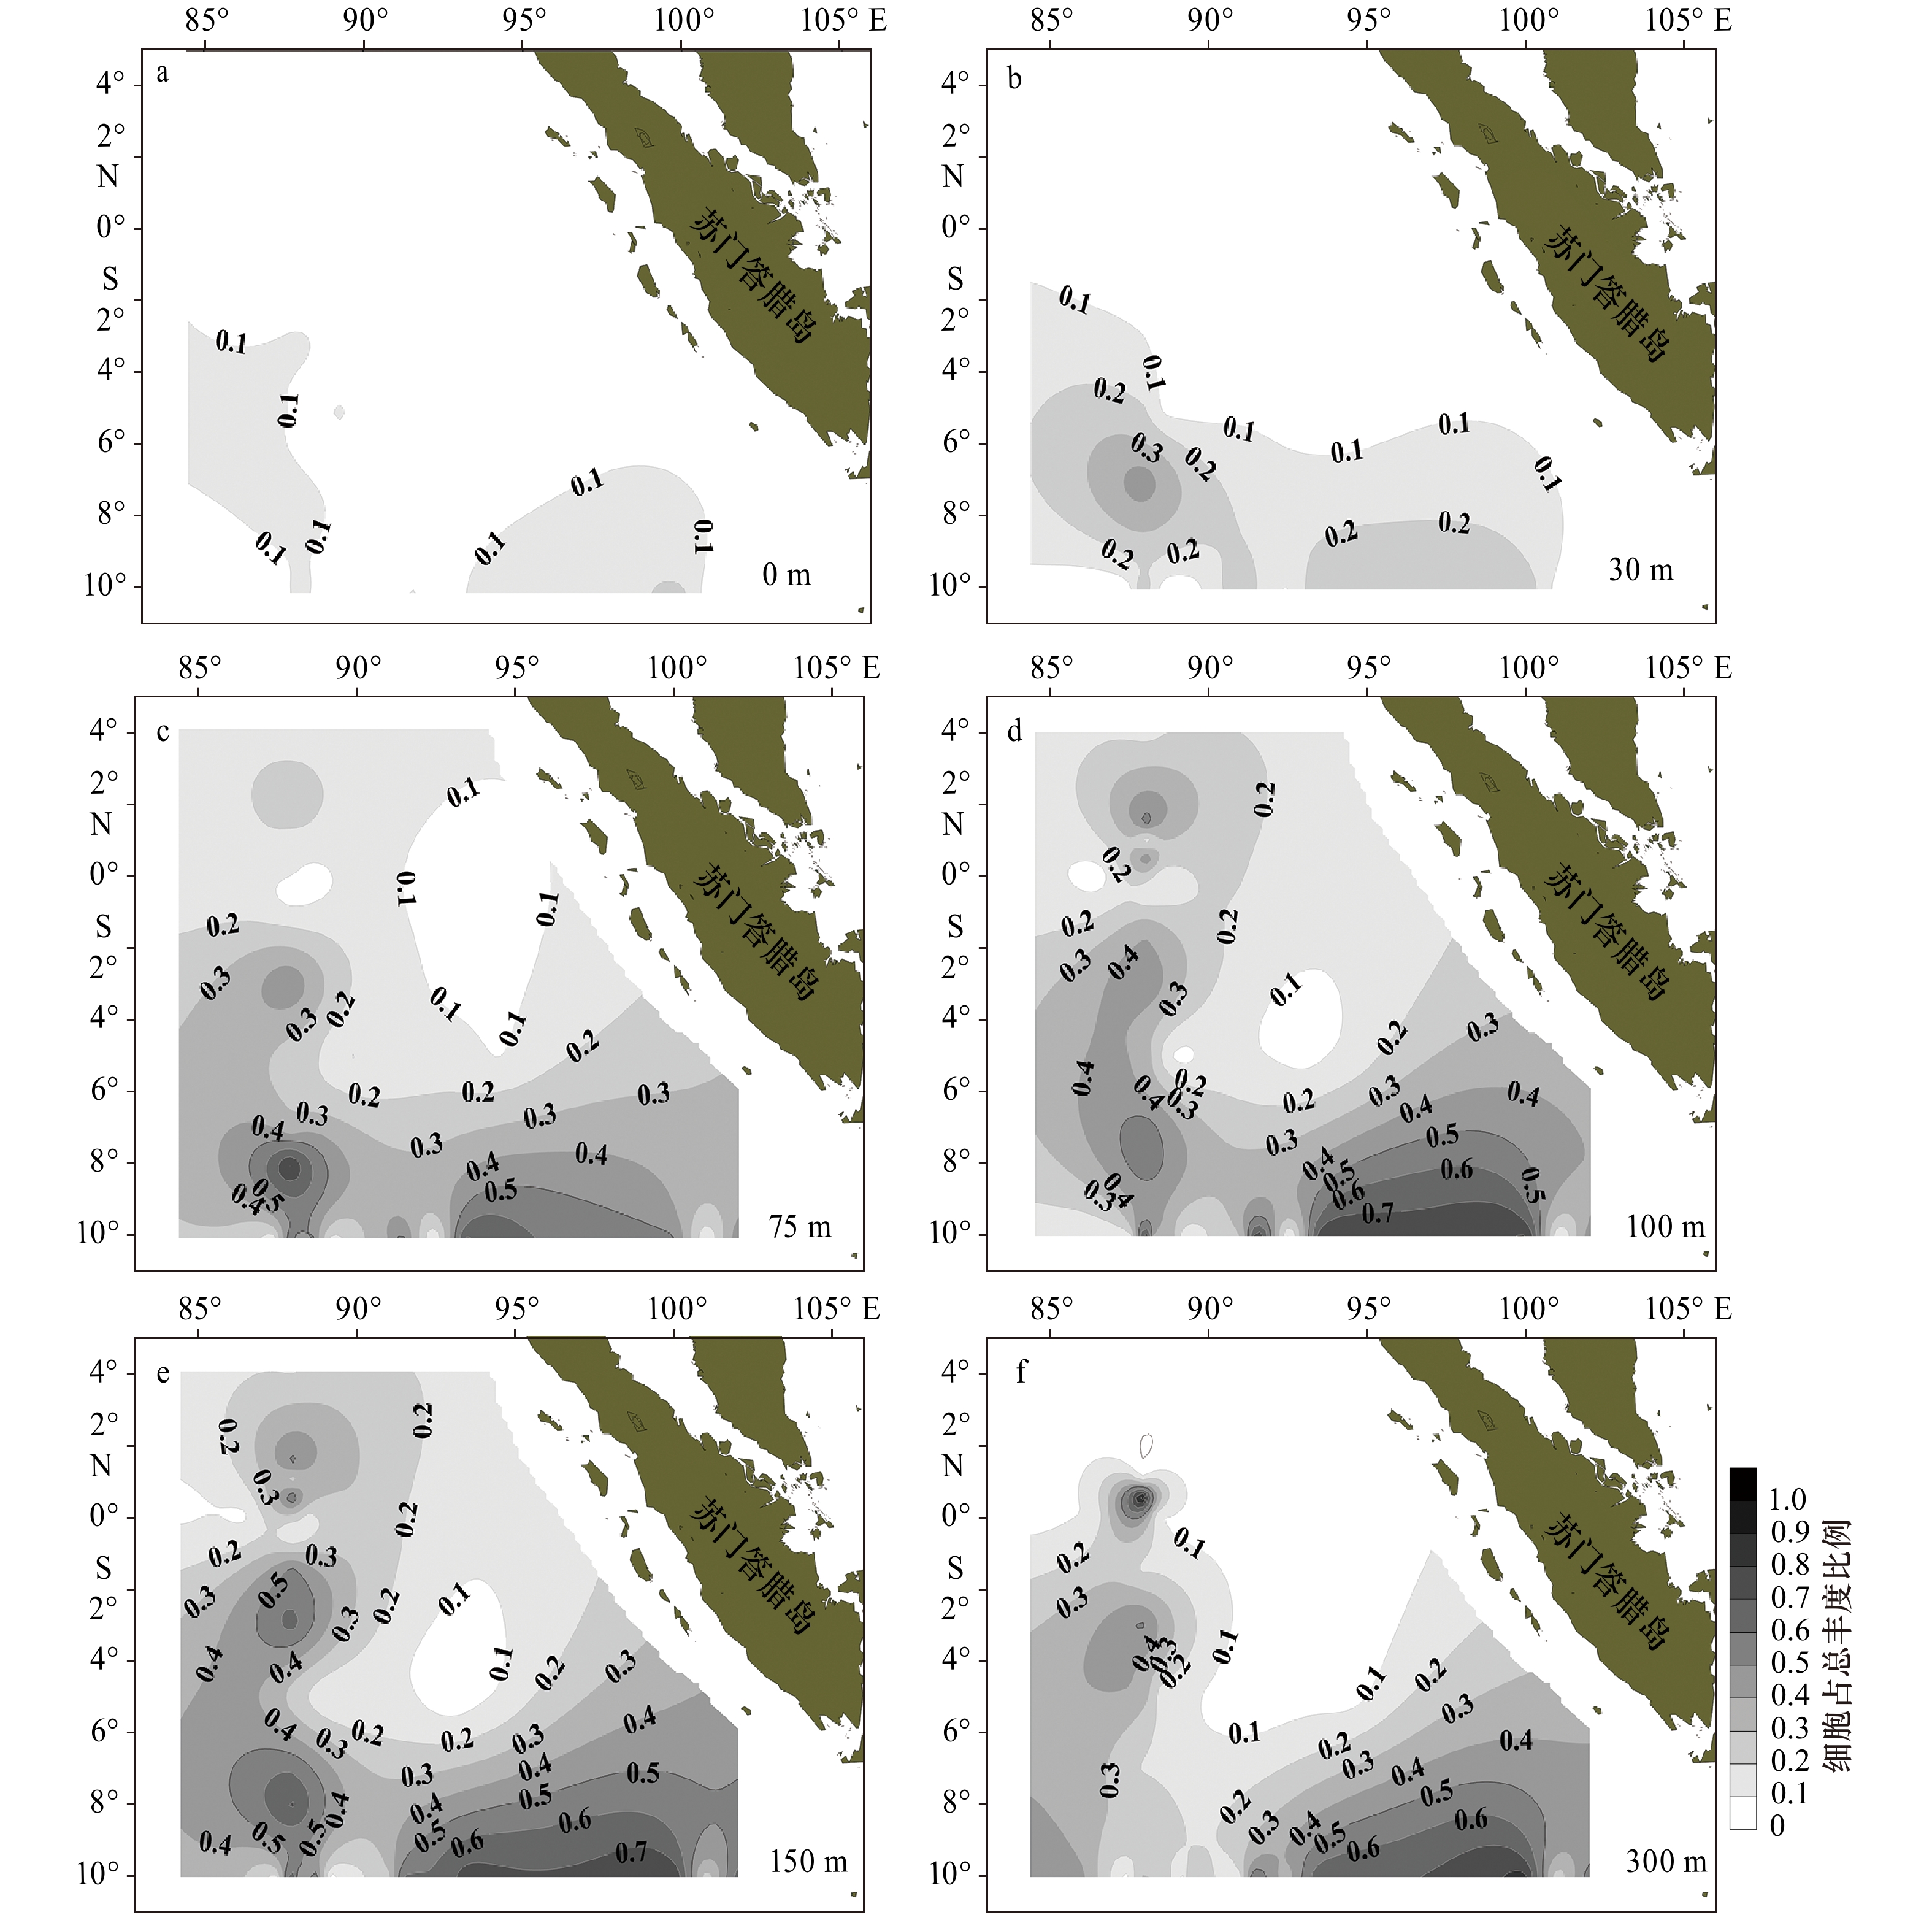
图 7 2013年春季热带东印度洋不同水层硅藻细胞占总丰度比例
Fig. 7 Proportion of abundance of diatom vs. total abundance in different layers in eastern tropical Indian Ocean in spring in 2013

图 8 I0416站位硅、甲藻种类和细胞丰度占比及主要营养盐的垂直结构
硅、甲藻种类数相对比例指硅藻物种数或甲藻物种数占硅、甲藻物种数之和的比例
Fig. 8 The vertical structure of nutrient, species ratio and cell abundance ratio of diatom and dinoflagellate in Station I0416
The relative proportion of the species number of diatoms or dinoflagellates refers to the proportion of the species number of diatoms or dinoflagellates to the sum of them

图 9 I0715站位硅、甲藻种类和细胞丰度占比及主要营养盐的垂直结构
硅、甲藻种类数相对比例指硅藻物种数或甲藻物种数占硅、甲藻物种数之和的比例
Fig. 9 The vertical structure of nutrient, species ratio and cell abundance ratio of diatom and dinoflagellate in Station I0715
The relative proportion of the species number of diatoms or dinoflagellates refers to the proportion of the species number of diatoms or dinoflagellates to the sum of them
表 1 2013年春季东印度洋微型浮游植物优势类群或优势种
Tab. 1 Dominant group or species of water phytoplankton in the tropical eastern Indian Ocean in spring 2013
优势种类 平均细胞丰度/102 cells·L−1 占细胞总丰度比例/% 出现频率/% 优势度
(Y)0 m 30 m 75 m 100 m 150 m 300 m 0 m 30 m 75 m 100 m 150 m 300 m 0 m 30 m 75 m 100 m 150 m 300 m 隐藻 18.98 57.31 29.22 23.37 20.88 17.82 30.81 38.09 37.21 41.10 58.64 71.48 25.70 17.14 25.71 77.14 28.57 25.71 0.125 微型甲藻 33.77 14.04 4.39 5.21 1.97 31.43 21.33 14.00 8.86 10.30 1.18 10.60 45.71 82.86 45.71 25.71 42.86 31.43 0.057 其他微型浮游植物 0.04 3.68 2.53 1.73 0.94 0.52 17.61 8.40 9.68 9.87 6.63 5.39 34.30 25.71 80.00 74.23 71.43 65.71 0.056 菱形藻 0.88 31.09 18.05 2.45 1.36 0.24 2.24 10.20 13.05 10.77 8.79 1.88 40.00 82.86 62.86 57.14 65.71 42.85 0.048 环沟藻 0.00 2.98 2.06 1.99 0.36 0.29 0.00 8.25 5.47 6.00 1.72 1.53 0.00 65.72 77.14 51.43 48.57 34.29 0.045 小等刺硅鞭藻 0.18 0.27 0.49 0.58 0.30 0.07 0.83 0.88 1.37 1.69 1.18 0.90 71.42 94.29 85.71 94.29 88.57 77.14 0.008  下载: 导出CSV
表 2 2013年春季热带东印度洋不同断面浮游植物物种数和细胞丰度
Tab. 2 Species and cell abundance of water phytoplankton in the tropical eastern Indian Ocean in spring 2013
断面号 地理位置 物种数/种 细胞丰度/102cells·L−1 范围 平均值 范围 平均值 I04(赤道) 83.0°~94.0°E 6~28 18±6.7 0.32~4.40 2.37±1.27 I05(5°S) 88.0°~97.5°E 4~34 16±8.3 0.29~6.12 1.95±1.47 I06(10°S) 85.0°~102.0°E 4~36 18±7.7 0.34~88.69 4.92±11.80 I07(88°E) 10.0°S~4.0°N 4~44 18±7.4 0.43~253.5 43.2±55.69
下载: 导出CSV
表 3 不同水层出现的浮游植物种类数及硅、甲藻相对比例
Tab. 3 Species and relative proportion of diatoms and dinoflagellates in different water layers
水层 硅藻种类数/种·站−1 甲藻种类数/种·站−1 总种类数/种·站−1 范围 平均值 相对比例 范围 平均值 相对比例 范围 平均值 0 m 1~12(n=35) 4.5±2.4 0.24 4~22(n=35) 14.2±3.9 0.76 7~52 20±5 30 m 3~17(n=35) 6.5±3.8 0.28 9~27(n=35) 16.5±4.7 0.72 16~35 24±6 75 m 6~26(n=35) 11.1±4.9 0.49 6~20(n=35) 11.4±4.0 0.51 13~44 24±6 100 m 4~14(n=35) 9.0±3.3 0.44 3~13(n=35) 6.7±2.3 0.56 8~25 17±5 150 m 2~12(n=35) 6.9±2.7 0.61 2~9(n=35) 4.5±1.8 0.39 7~21 13±4 300 m 0~10(n=35) 4.3±2.4 0.58 0~8(n=35) 3.1±1.8 0.42 3~16 9±4 注:硅、甲藻相对比例指硅藻物种数或甲藻物种数占硅、甲藻物种数之和的比例。
下载: 导出CSV
表 4 1960年东印度洋爪洼岛临近海域不同水层出现的浮游植物种类[11]
Tab. 4 Species of phytoplankton in different water layers of the sea area near Java Island in the tropical eastern Indian Ocean in 1960[11]
站位 水层 中心硅藻/种 羽纹硅藻/种 甲藻/种 硅藻相对比例 甲藻相对比例 13th 0~20 m 9 3 29 0.29 0.71 20~50 m 8 7 24 0.38 0.62 50~100 m 3 1 13 0.24 0.76 100~200 m 3 0 8 0.27 0.73 15th 0~20 m 10 2 32 0.29 0.71 20~50 m 13 3 31 0.31 0.69 50~100 m 5 1 17 0.26 0.74 100~200 m 4 0 8 0.33 0.67 16th 0~20 m 9 5 30 0.33 0.67 20~50 m 7 2 14 0.39 0.61 50~100 m 3 1 9 0.31 0.69 100~200 m 4 0 7 0.36 0.64 注:这3个站位经纬度分别为13th:12°46′S,97°19′E;15th:10°11′S,98°42′E;16th:8°15′S,100°05′E;采样方式为垂直分层采样,网目94 μm。
下载: 导出CSV
-
[1] 张韧, 葛珊珊, 洪梅, 等. 气候变化与国家海洋战略—影响与风险评估[M]. 北京: 气象出版社, 2014.Zhang Ren, Ge Shanshan, Hong Mei, et al. Climate Change and National Marine Strategy—Influence and Risk Assessment[M]. Beijing: China Meteorological Press, 2014. [2] Jeffrey S W, Vesk M. Effect of blue-green light on photosynthetic pigments and chloroplast structure in the marine diatom Stephanopyxis turns[J]. Journal of Phycology, 1977, 13(3): 271−279. [3] Bates N R, Pequignet A C, Sabine C L. Ocean carbon cycling in the Indian Ocean: 2. Estimates of net community production[J]. Global Biogeochemical Cycles, 2006, 20: GB3021. [4] Boustany A. Bluefin Tuna: The State of the Science[M]. Washington, DC: Ocean Science Series, 2011: 1−14. [5] 于卫东, 方越, 刘琳, 等. 第二次国际印度洋科学考察计划(IIOE-2)介绍[J]. 海洋科学进展, 2017, 35(1): 1−7. doi: 10.3969/j.issn.1671-6647.2017.01.001Yu Weidong, Fang Yue, Liu Lin, et al. Introduction of the second international Indian Ocean expedition (IIOE-2)[J]. Advances in Marine Science, 2017, 35(1): 1−7. doi: 10.3969/j.issn.1671-6647.2017.01.001 [6] Poulton A J, Moore C M, Seeyave S, et al. Phytoplankton community composition around the Crozet Plateau, with emphasis on diatoms and Phaeocystis[J]. Deep Sea Research Part II: Topical Studies in Oceanography, 2007, 54(18/20): 2085−2105. [7] Hood R R, Bange H W, Beal L, et al. The second international Indian Ocean expedition (IIOE-2): a basin-wide research program—Science Plan (2015−2020)[R]. Delaware: SCOR Newark, 2015: 43−55. [8] Suhanova I N. On the specific composition and distribution of the phytoplankton in the northern Indian Ocean. Trud. Inst. Okeanol[R/OL]. 1962, Vol. LVIII: 27−39 [2019-08-08]. http://scor-int.org/IIOE-1/reprints.htm [9] Wood E J F. Dinoflagellates in the Australian region. II. recent collections[R/OL]. 1963: 1−55 [2019-08-08]. http://scor-int.org/IIOE-1/reprints.htm [10] Ernova V V, Ivanovi J A. On the distribution of phytoplankton as depending from hydrological conditions in the northern part of the Indian Ocean. Trud. Inst. Okeanol[R/OL]. Vol. LXIV , 1964: 257−264 [2019-08-08]. http://scor-int.org/IIOE-1/reprints.htm [11] Durairatnam M. Vertical distribution of phytoplankton in an area near Cocos-Keeling Islands, Indian Ocean. Inform. Bull. Plankton[R/OL]. 1964(11): 1−6 [2019-08-08]. http://scor-int.org/IIOE-1/reprints.htm [12] Thorrington-Smith M. West Indian Ocean phytoplankton: a numerical investigation of phytohydrographic regions and their characteristic phytoplankton associations[J]. Marine Biology, 1971, 9(2): 115−137. doi: 10.1007/BF00348251 [13] 孙军, 薛冰. 全球气候变化下的海洋浮游植物多样性[J]. 生物多样性, 2016, 24(7): 739−747. doi: 10.17520/biods.2016168Sun Jun, Xue Bing. Marine phytoplankton diversity and the impact of global climate change[J]. Biodiversity Science, 2016, 24(7): 739−747. doi: 10.17520/biods.2016168 [14] Winder M, Sommer U. Phytoplankton response to a changing climate[J]. Hydrobiologia, 2012, 698(1): 5−16. doi: 10.1007/s10750-012-1149-2 [15] 王磊, 冷晓云, 孙庆杨, 等. 春季季风间期巽他陆架和马六甲海峡表层海水浮游植物群落结构研究[J]. 海洋学报, 2015, 37(2): 120−129.Wang Lei, Leng Xiaoyun, Sun Qingyang, et al. The distribution of phytoplankton community structure in the Sunda Shelf and the Strait of Malacca during spring intermonsoon[J]. Haiyang Xuebao, 2015, 37(2): 120−129. [16] 薛冰, 孙军, 丁昌玲, 等. 2014年春季季风间期东印度洋赤道及其邻近海域硅藻群落[J]. 海洋学报, 2016, 38(2): 112−120.Xue Bing, Sun Jun, Ding Changling, et al. Diatom communities in equatorial region and its adjacent areas of eastern Indian Ocean during spring intermonsoon 2014[J]. Haiyang Xuebao, 2016, 38(2): 112−120. [17] 李艳. 热带东印度洋春季浮游植物群落、多样性及环境调控机制[D]. 青岛: 中国海洋大学, 2019.Li Yan. Phytoplankton assemblage, diversity and environmental regulation in the eastern tropical Indian Ocean in spring[D]. Qingdao: Ocean University of China, 2019. [18] 李艳, 孙萍, 袁超, 等. 东印度洋南部春季网采浮游植物群落特征及长期变化[J]. 海洋环境科学, 2019, 38(6): 825−832. doi: 10.12111/j.mes20190602Li Yan, Sun Ping, Yuan Chao, et al. Phytoplankton assemblage and their inter-annual variation in the south sector of eastern Indian Ocean in spring[J]. Marine Environmental Science, 2019, 38(6): 825−832. doi: 10.12111/j.mes20190602 [19] 黄备, 魏娜, 唐静亮, 等. 南黄海2007−2017年浮游植物群落结构及多样性变化[J]. 中国环境监测, 2018, 34(6): 137−148.Huang Bei, Wei Na, Tang Jingliang, et al. Changes of phytoplankton community structure and diversity in the South Yellow Sea during 2007−2017[J]. Environmental Monitoring in China, 2018, 34(6): 137−148. [20] 杨清良, 林更铭, 林茂, 等. 东北太平洋中国开辟区浮游植物的种类组成与分布[J]. 海洋通报, 2002, 21(4): 15−27. doi: 10.3969/j.issn.1001-6392.2002.04.003Yang Qingliang, Lin Gengming, Lin Mao, at al. Species composition and distribution of phytoplankton in the China pioneer area of the Northeast Pacific Ocean[J]. Marine Science Bulletin, 2002, 21(4): 15−27. doi: 10.3969/j.issn.1001-6392.2002.04.003 [21] Cullen J J. Subsurface chlorophyll maximum layers: enduring enigma or mystery solved?[J]. Annual Review of Marine Science, 2015, 7: 207−239. doi: 10.1146/annurev-marine-010213-135111 [22] Duan Yongliang, Liu Liu, Han Guoqing, et al. Anomalous behaviors of Wyrtki Jets in the equatorial Indian Ocean during 2013[J]. Scientific Reports, 2016, 6: 29688. doi: 10.1038/srep29688 [23] Lee R E. 藻类学[M]. 段德麟, 胡自民, 胡征宇, 译. 北京: 科学出版社, 2012: 296−308.Lee R E. Phycology[M]. Duan Delin, Hu Zimin, Hu Zhengyu, trans. Beijing: Science Press, 2012: 296−308. -

计量
- 文章访问数: 362
- HTML全文浏览量: 193
- PDF下载量: 25
- 被引次数: 0
