

Effects of the Arctic river runoff on the Arctic Ocean circulation
-
摘要: 北极河流径流是北冰洋淡水的最大来源,其变化会对北冰洋中的诸多过程有重要影响。本文基于全球高分辨率海洋−海冰耦合模式的模拟结果,研究北冰洋温盐、海冰以及环流对北极河流径流的敏感性。通过对比有气候态北极河流径流输入的控制实验结果和径流完全关闭的敏感性实验结果,研究发现北极径流对北冰洋温度、盐度、海冰以及海洋环流等有显著的影响。关闭北极河流径流后,在河口附近的陆架上温度降低、盐度升高,且导致500 m深度处温度下降以及盐度升高;河口附近的陆架处,海冰密集度与海冰厚度增加。关闭北极河流径流也对北冰洋内的环流有影响:由于缺少来自欧亚大陆的北极径流的输入,穿极漂流与东格陵兰流流速减小且盐度增加;关闭北极径流导致近岸海表面高度降低,沿欧亚陆架的北冰洋边界流减弱,白令海入流增强。通过对比关闭北极径流实验与控制实验的温度和盐度剖面,发现关闭北极径流后大西洋层温度降低,各陆架海盐跃层的梯度减小,盐跃层厚度减小。Abstract: River runoff plays a dominant role in the freshwater flux to the Arctic Ocean, and the corresponding changes in river runoff may have important effects on many processes in the Arctic Ocean. In this study, the sensitivity of ocean temperature, salinity, sea ice and circulation to river runoff was investigated by using a global high-resolution coupled ocean-sea ice model. By comparing the simulated results from a sensitivity experiment without river runoff with the results from a control simulation with climatology river runoff, we found that the river runoff can significantly modulate the temperature, salinity, sea ice, and ocean currents in the Arctic Ocean. In the sensitivity experiment without river runoff, the sea surface temperature on the shelf near the estuaries decreases, and the salinity increases. At 500 m depth, the temperature decreases, and the salinity increases in the sensitivity experiment. The sea ice concentration and thickness also increase near the estuaries in the sensitivity experiment. The shutdown of the river runoff also has an impact on the circulation, which leads to weaker and fresher East Greenland Current and the Transpolar Drift Stream. The shutdown of runoff forcing can also slow down the Arctic Circumpolar Boundary Current along the Eurasian Shelf and speed up the Bering Strait inflow by lowering the sea surface height in the shelf seas. In the sensitive experiment, a colder Atlantic layer, a smaller salinity gradient and a thinner upper halocline can be identified by comparing with the temperature and salinity profiles from the control experiment.
-
Key words:
- Arctic river runoff /
- oceanic circulation /
- water masses /
- sea ice
-
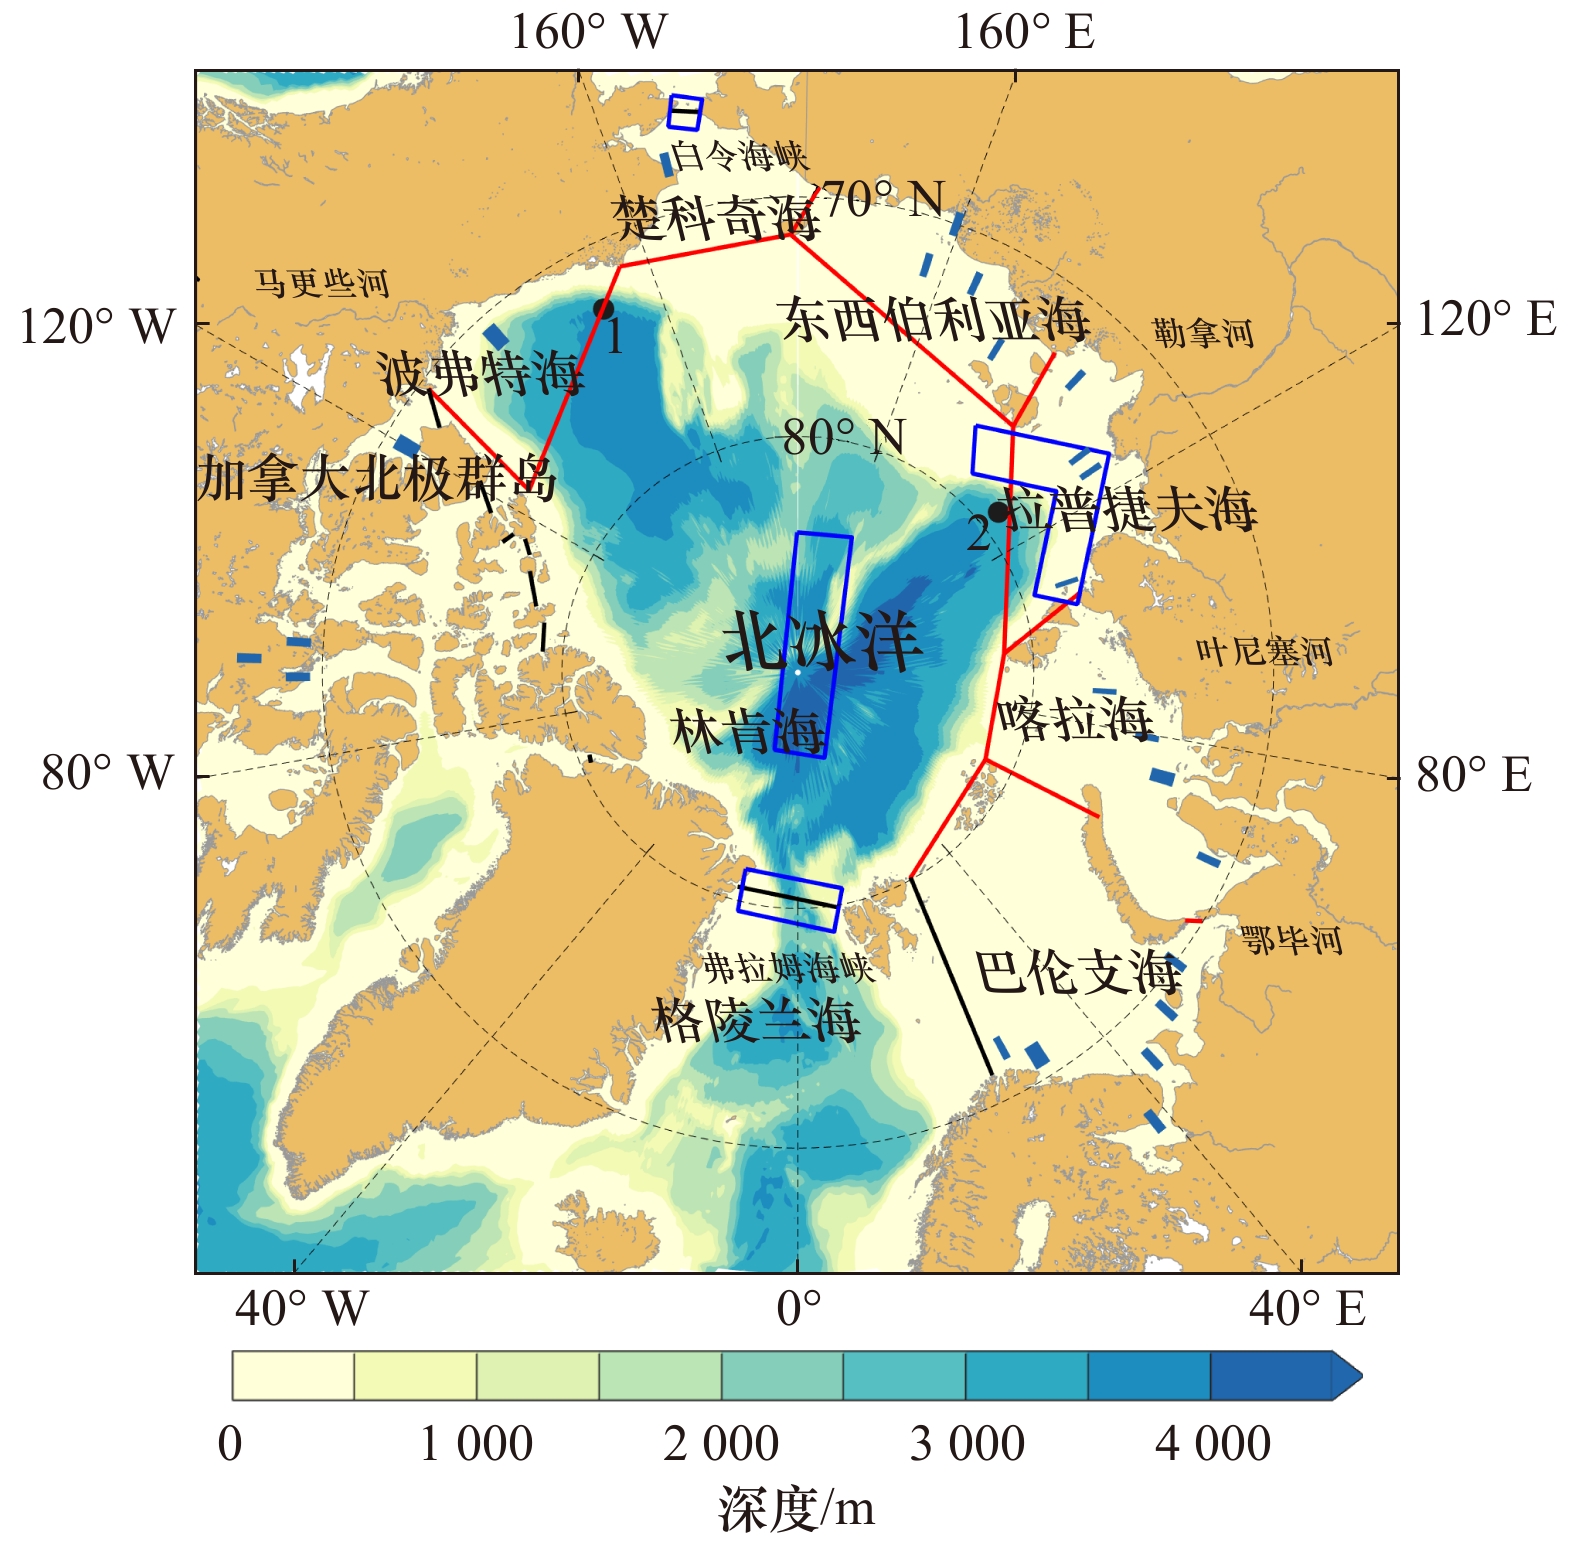
图 1 北冰洋地形图
蓝色填充方块表示模式中径流数据的输入点,红色直线划分了各个陆架海的区域,黑色和红色实线包围的区域为计算北冰洋温度与盐度垂直廓线的区域。黑色点1(72.51°N,151.75°W)与黑色点2(79.13°N,128.62°E)是在加拿大海盆和欧亚海盆边缘选取的两个代表性站点,通过这两个站点的温度与盐度剖面来分析关闭河流径流实验中表层海水的潜沉能力。蓝色镂空方框是计算白令海峡、弗拉姆海峡、北冰洋环极边界流与穿极漂流区域平均的区域
Fig. 1 The Arctic Ocean bathymetry
The blue solid rectangles represent the input points of the runoff data in the model. The red line divides the regions of each marginal sea. The regions bounded by black and red lines are the regions where the hydrographic profiles of the Arctic Ocean are calculated. Black point 1 (72.51°N,151.75°W) and black point 2 (79.13°N,128.62°E) are two points selected at the edge of the Canadian Basin and Eurasian Basin. We analyze the subsidence capacity of the surface water through the temperature and salinity profiles of these two points in the experiment without river runoff. The open blue boxes are the areas of computing the regional averages of the Bering Strait, Arctic Circumpolar Boundary Current and the Fram Strait and Transpolar Drift Stream

图 2 不同实验中北冰洋的海冰范围(a)、海冰厚度(b)、 动能(c)及热含量(d)
动能和热含量均做了深度积分。图中的黑色直线分割了实验运行的前10年与后10年,本文主要分析1989−1998年的变化
Fig. 2 Sea ice extent (a), sea ice thickness (b), kinetic energy (c) and thermal content (d) for the Arctic Ocean from the different experiments
The kinetic energy and thermal content are integrated deeply. The black vertical line in the figure divides the first and last decade of the experiments. We mainly analyze the changes from 1989 to 1998

图 3 控制实验A中10年平均表层温度(a)和盐度(c),控制实验A和PHC3.0气候态表层温度(b)和盐度(d)的差值
最大的温度和盐度的差值都出现在陆架上,分别为−2.5℃和7.7
Fig. 3 Time-mean (1989−1998) sea surface temperature (a) and salinity (c) in the control experiment A, and the anomalies between the control simulation and PHC3.0 of sea surface temperature (b) and salinity (d)
The largest temperature and salinity biases in the Arctic Shelf regions are −2.5℃ and 7.7, respectively
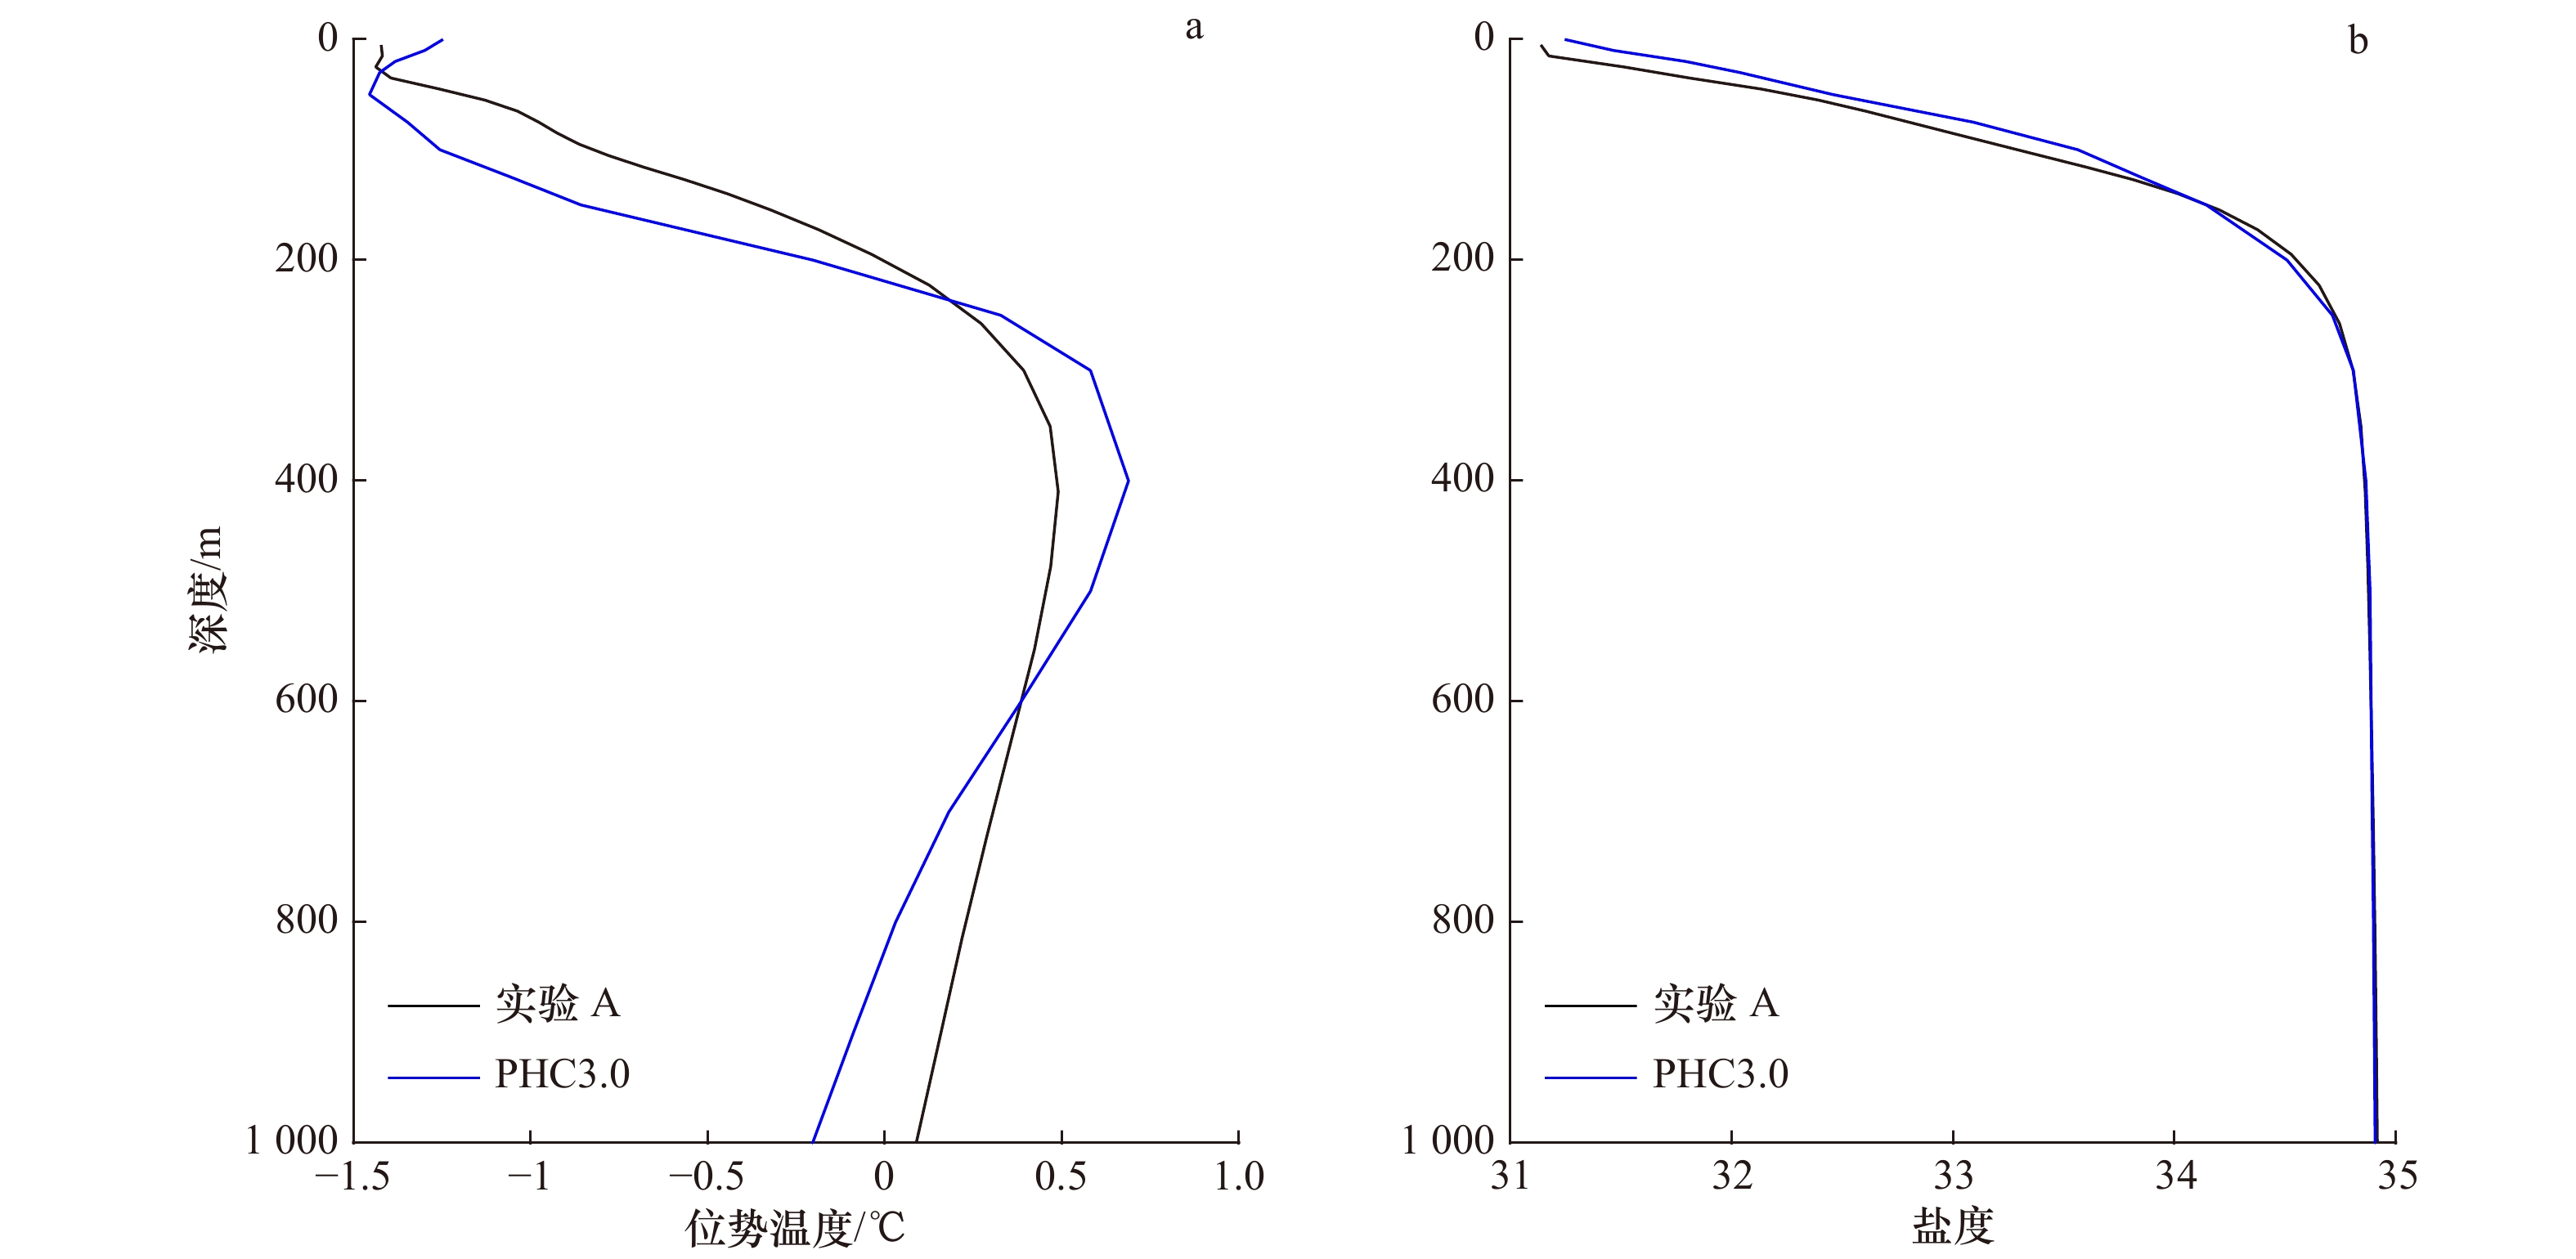
图 4 控制实验A 10年平均与PHC3.0气候态数据集在北冰洋整体区域平均的位势温度(a)与盐度(b)廓线对比
Fig. 4 Vertical profiles of annual mean potential temperature (a) and annual salinity (b) averaged over the Arctic Ocean during the period of 10 years from the control experiment A
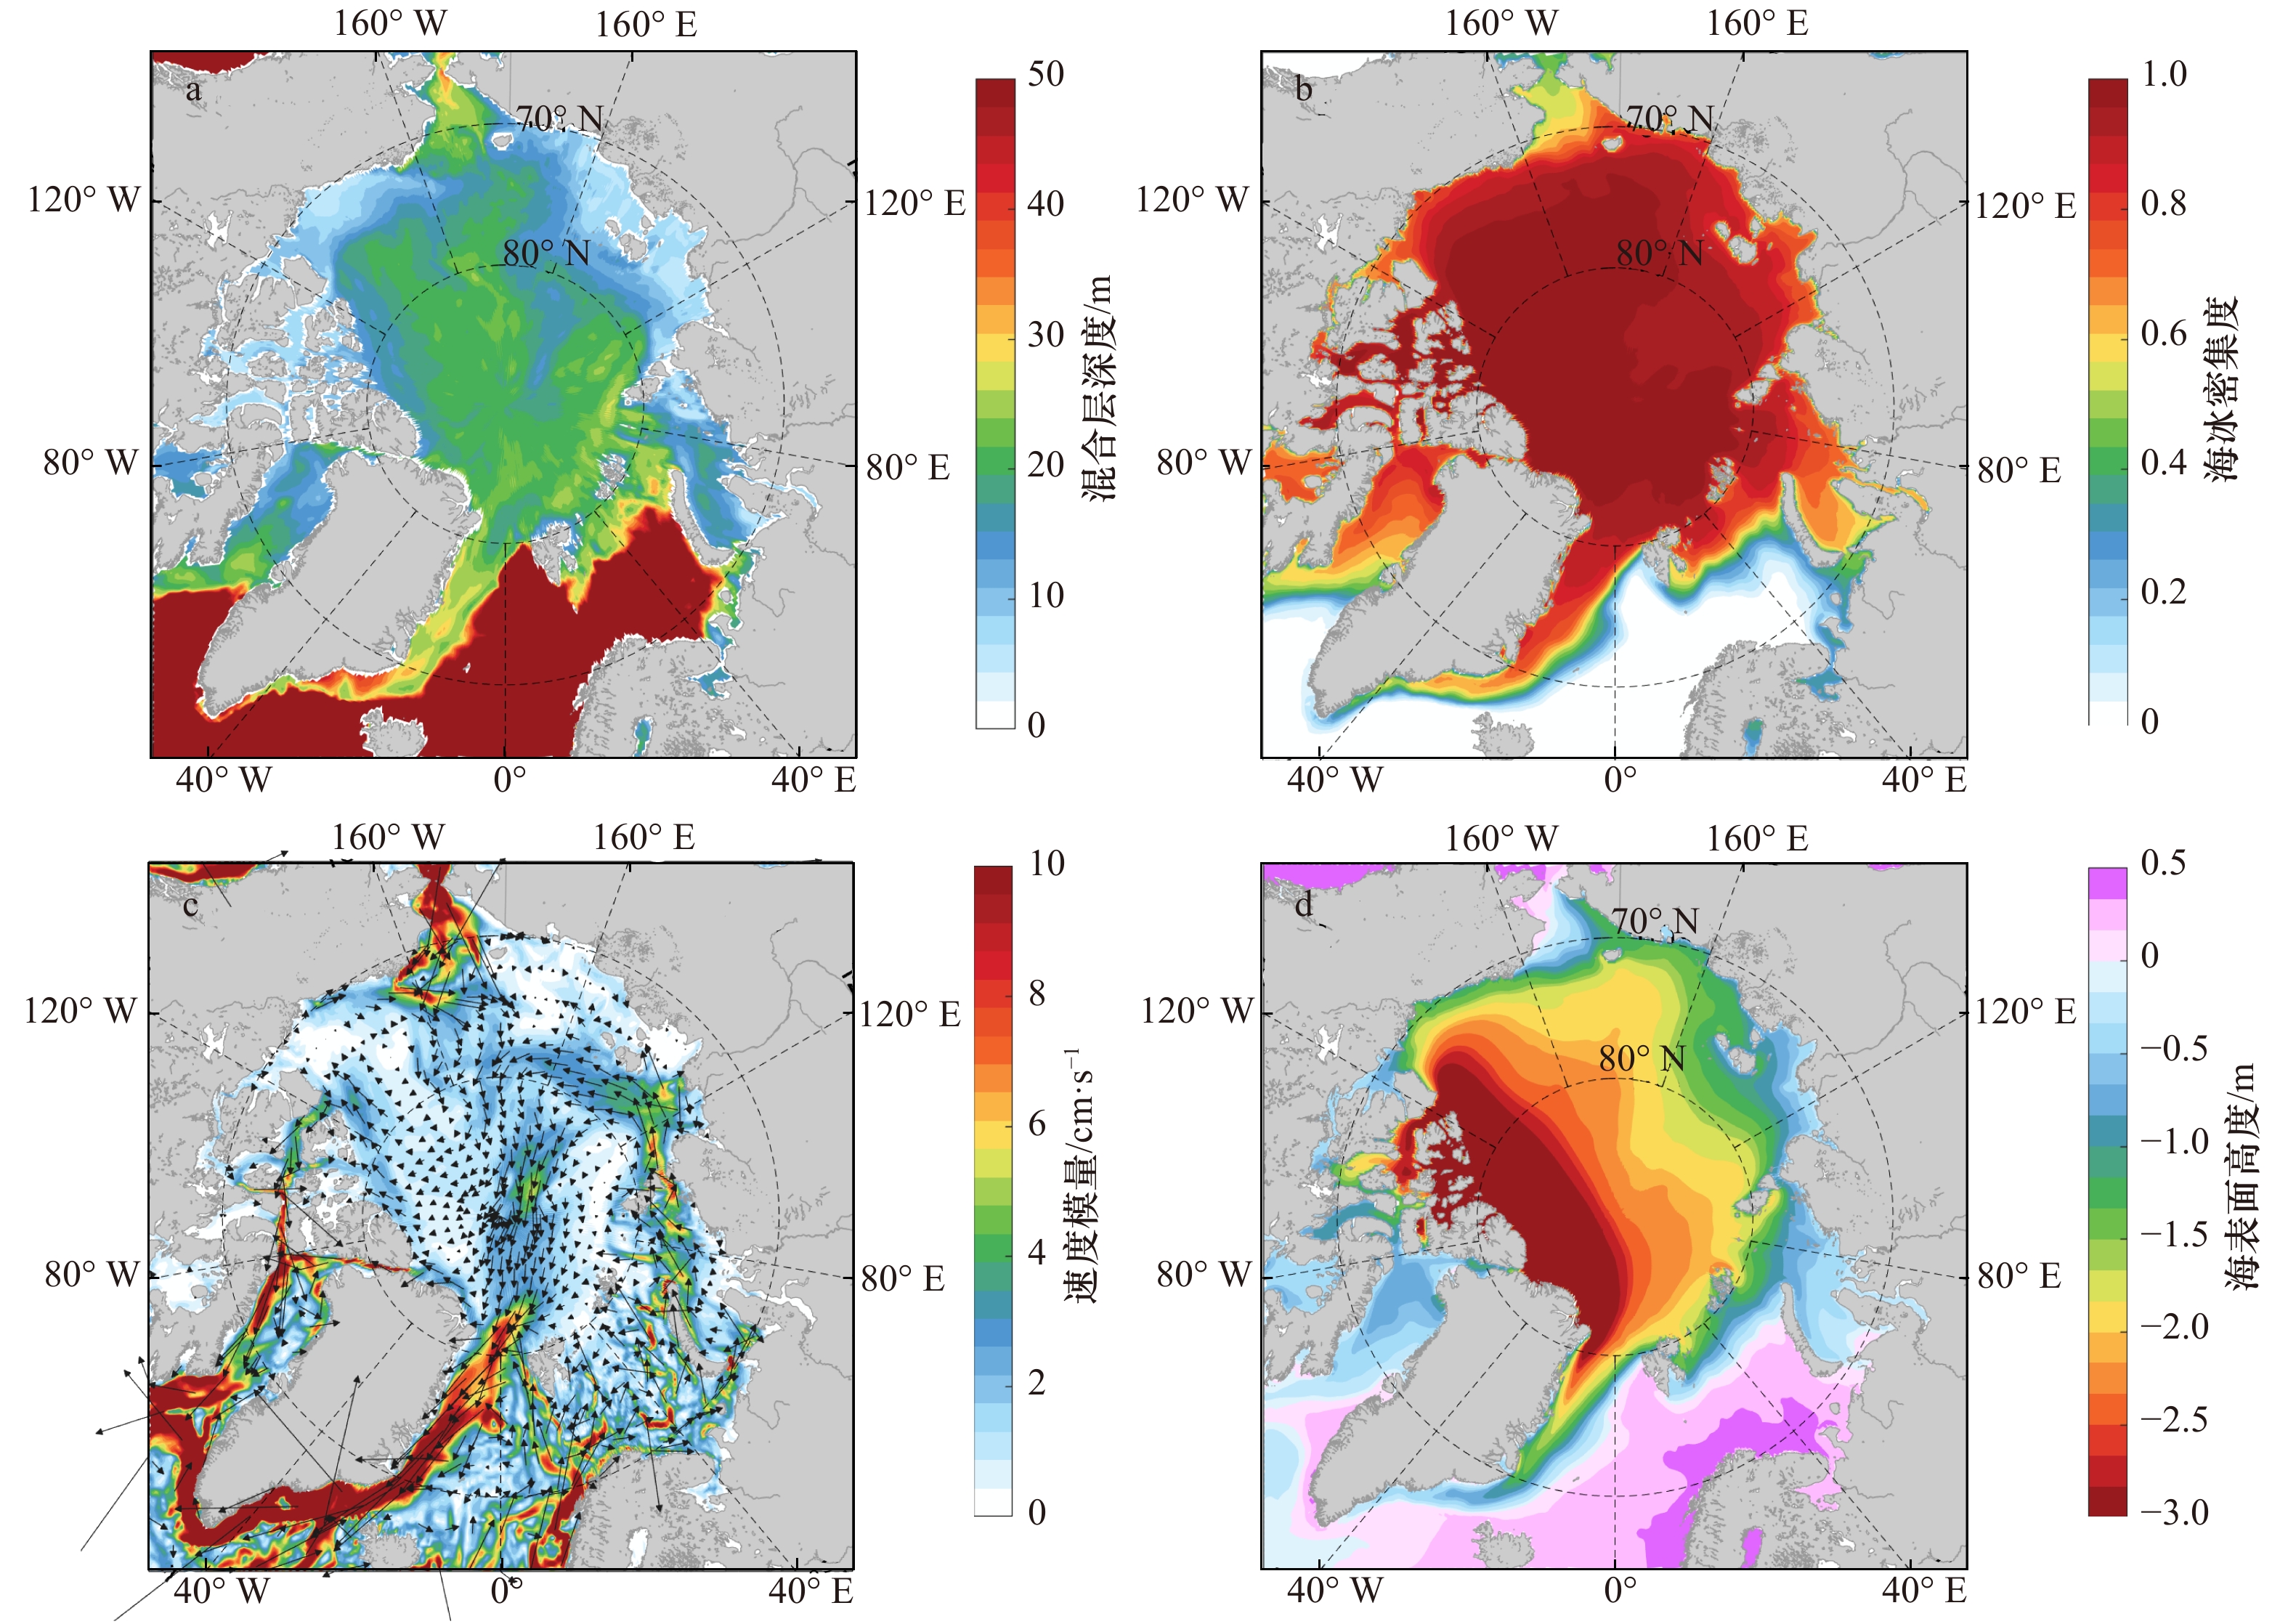
图 5 控制实验A的10年平均混合层深度(a)、海冰密集度(b)、海表洋流速度场(c)和海表面高度(d)
Fig. 5 10 years mean of the mixed later depth (a), the sea ice concentration (b), the sea surface velocity fields (c), and the sea surface height (d) from the control experiment A

图 6 控制实验A中500 m水深10年平均位势温度(a)、盐度(b)和速度场(c)
Fig. 6 10 years means of the potential temperature (a), the salinity (b), and the velocity (c) at 500 m depth in the control experiment A

图 7 表层(a)与500 m水深(b)10年平均位势温度差(关闭河流实验B减去控制实验A)
Fig. 7 10 years mean differences of the potential temperature at surface (a) and 500 m depth (b) (the results from the sensitivity experiment B minus the control experiment A)
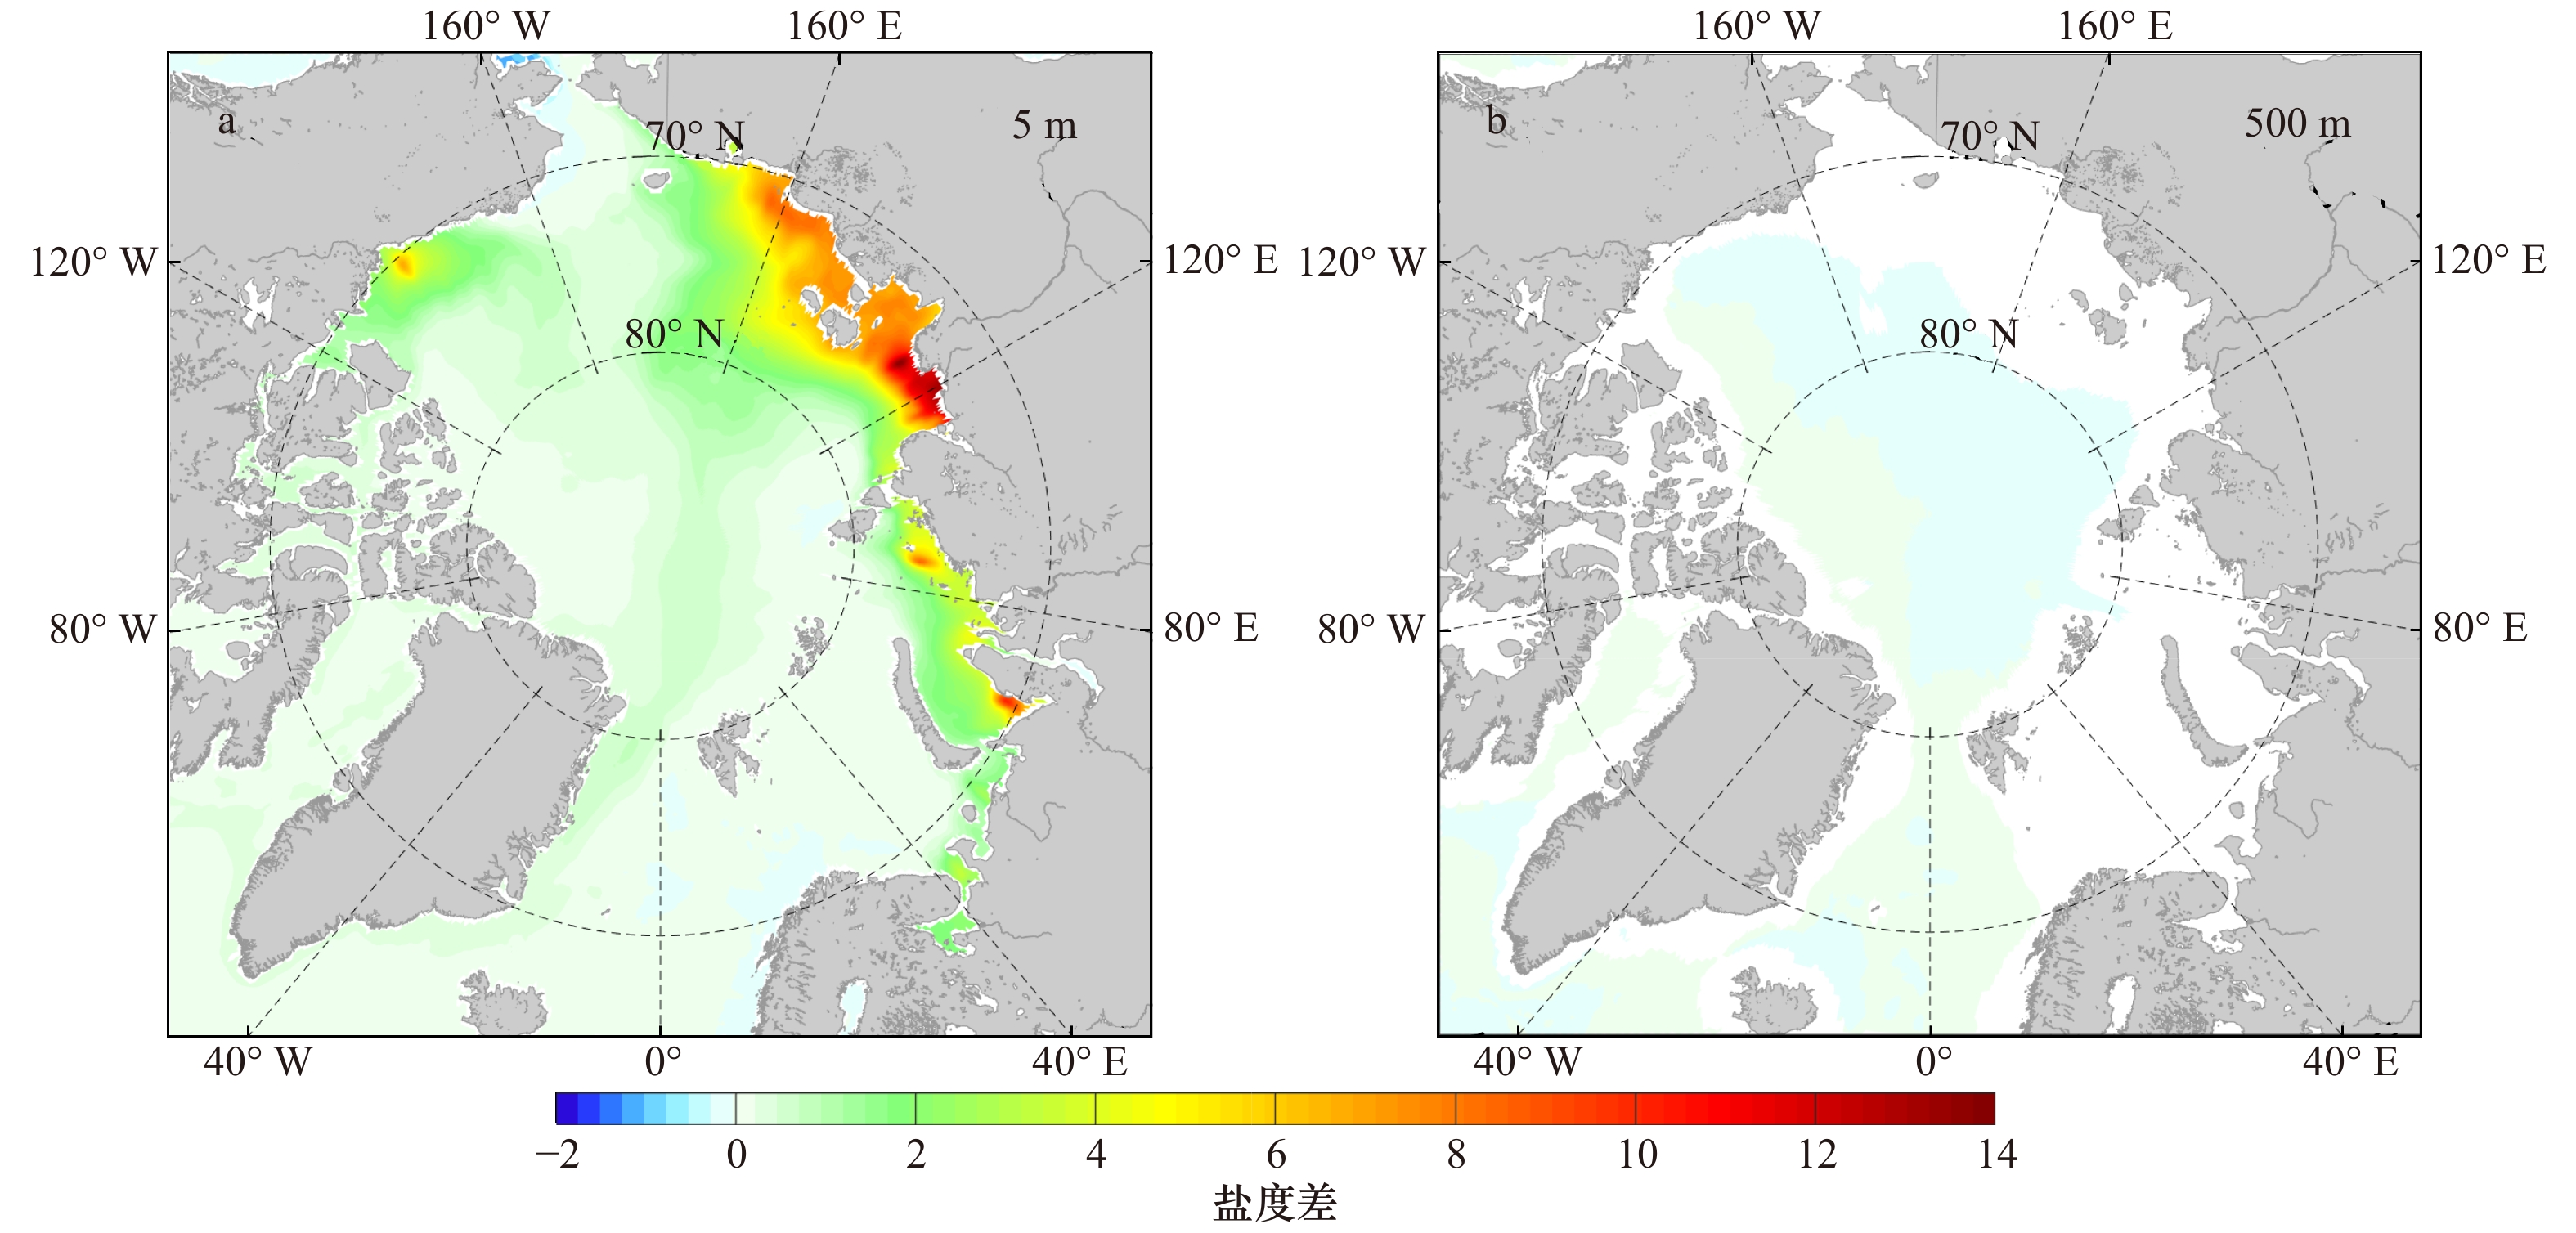
图 8 表层(a)与500 m水深(b)10年平均盐度差(关闭河流实验B减去控制实验A)
Fig. 8 10 years mean differences of the salinity at surface (a) and 500 m depth (b) (the results from the sensitivity experiment B minus the control experiment A)

图 9 冬季(1−3月)(a)、春季(4−6月)(b)、夏季(7−9月)(c)和秋季(10−12月)(d)混合层深度之差(关闭河流实验B减去控制实验A)
Fig. 9 Time mean difference of the mixed layer depth of winter (January−March) (a), spring (April−June) (b), summer (July−September) (c), and autumn (October−December) (d) (the results from the sensitivity experiment B minus the control experiment A)

图 10 加拿大海盆边缘点1(72.51°N,151.75°W)与欧亚海盆边缘点2(79.13°N,128.62°E)(位置见图1)处,两个实验的密度差、位势温度差与盐度差(关闭河流实验B减去控制实验A)
Fig. 10 The difference of density, potential temperature and salinity between experiments A and B, at Point 1 (72.51°N,151.75°W) and Point 2 (79.13°N,128.62°E) near the edges of Canadian Basin and Eurasian Basin (See Fig.1 for the locations) (the results from the sensitivity experiment B minus the control experiment A)
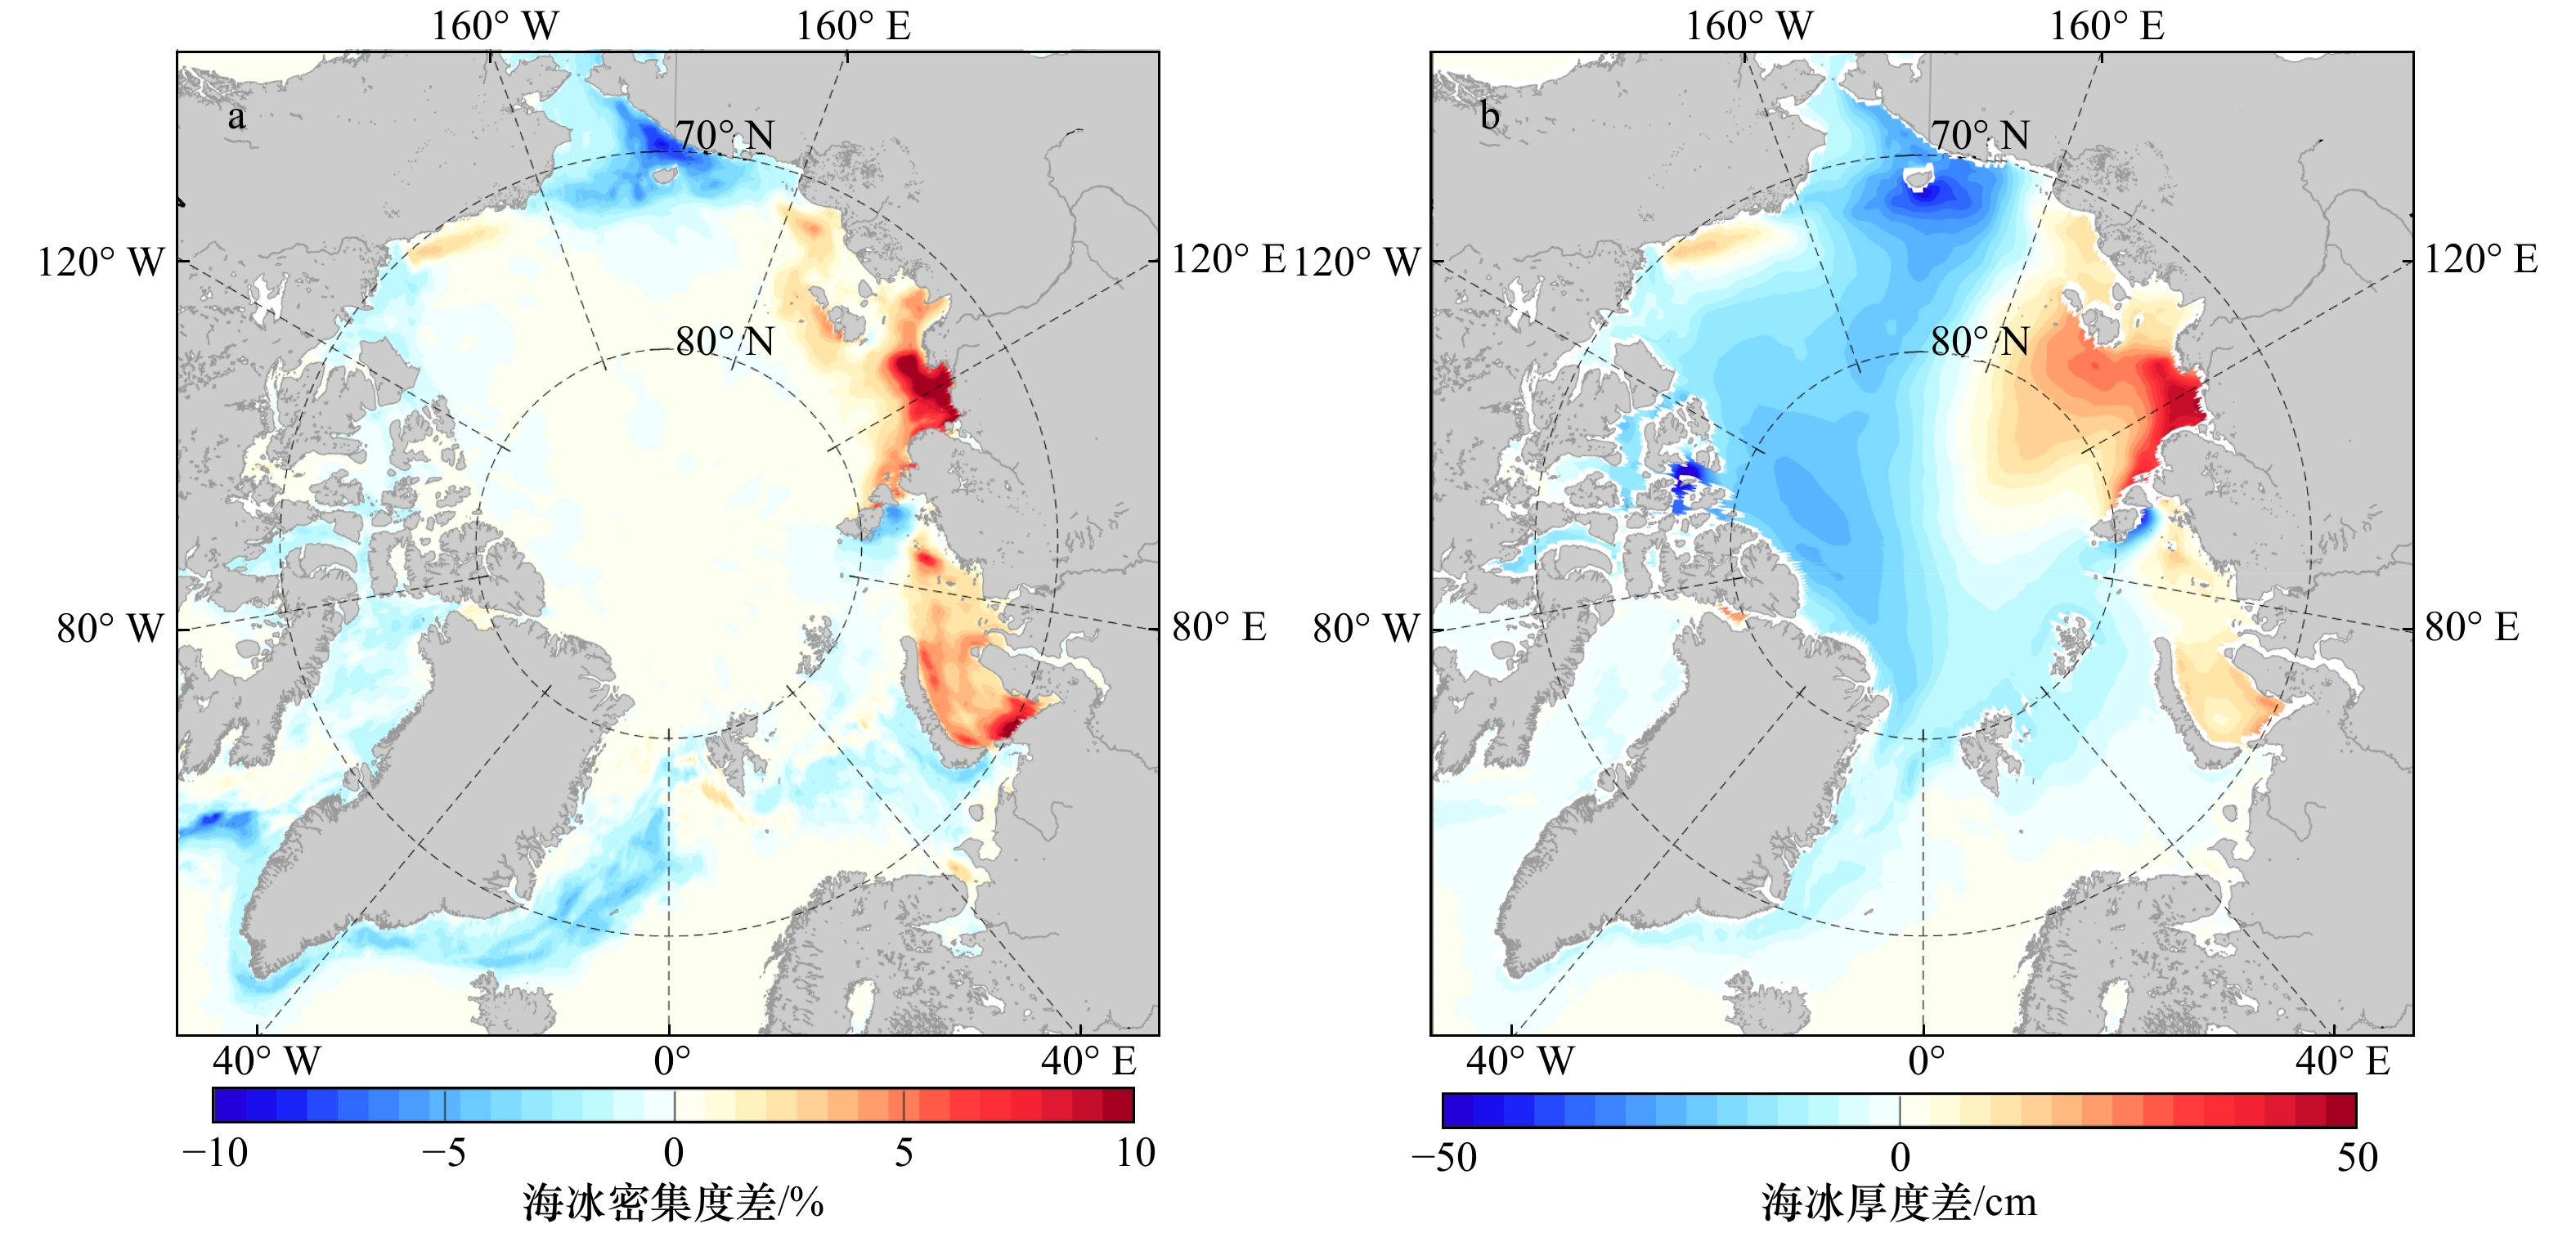
图 11 10年平均海冰密集度之差(a)和海冰厚度之差(b)(关闭河流实验B减去控制实验A)
Fig. 11 10 years mean difference in ice concentration (a), and ice thickness (b) (the results from the sensitivity experiment B minus the control experiment A)
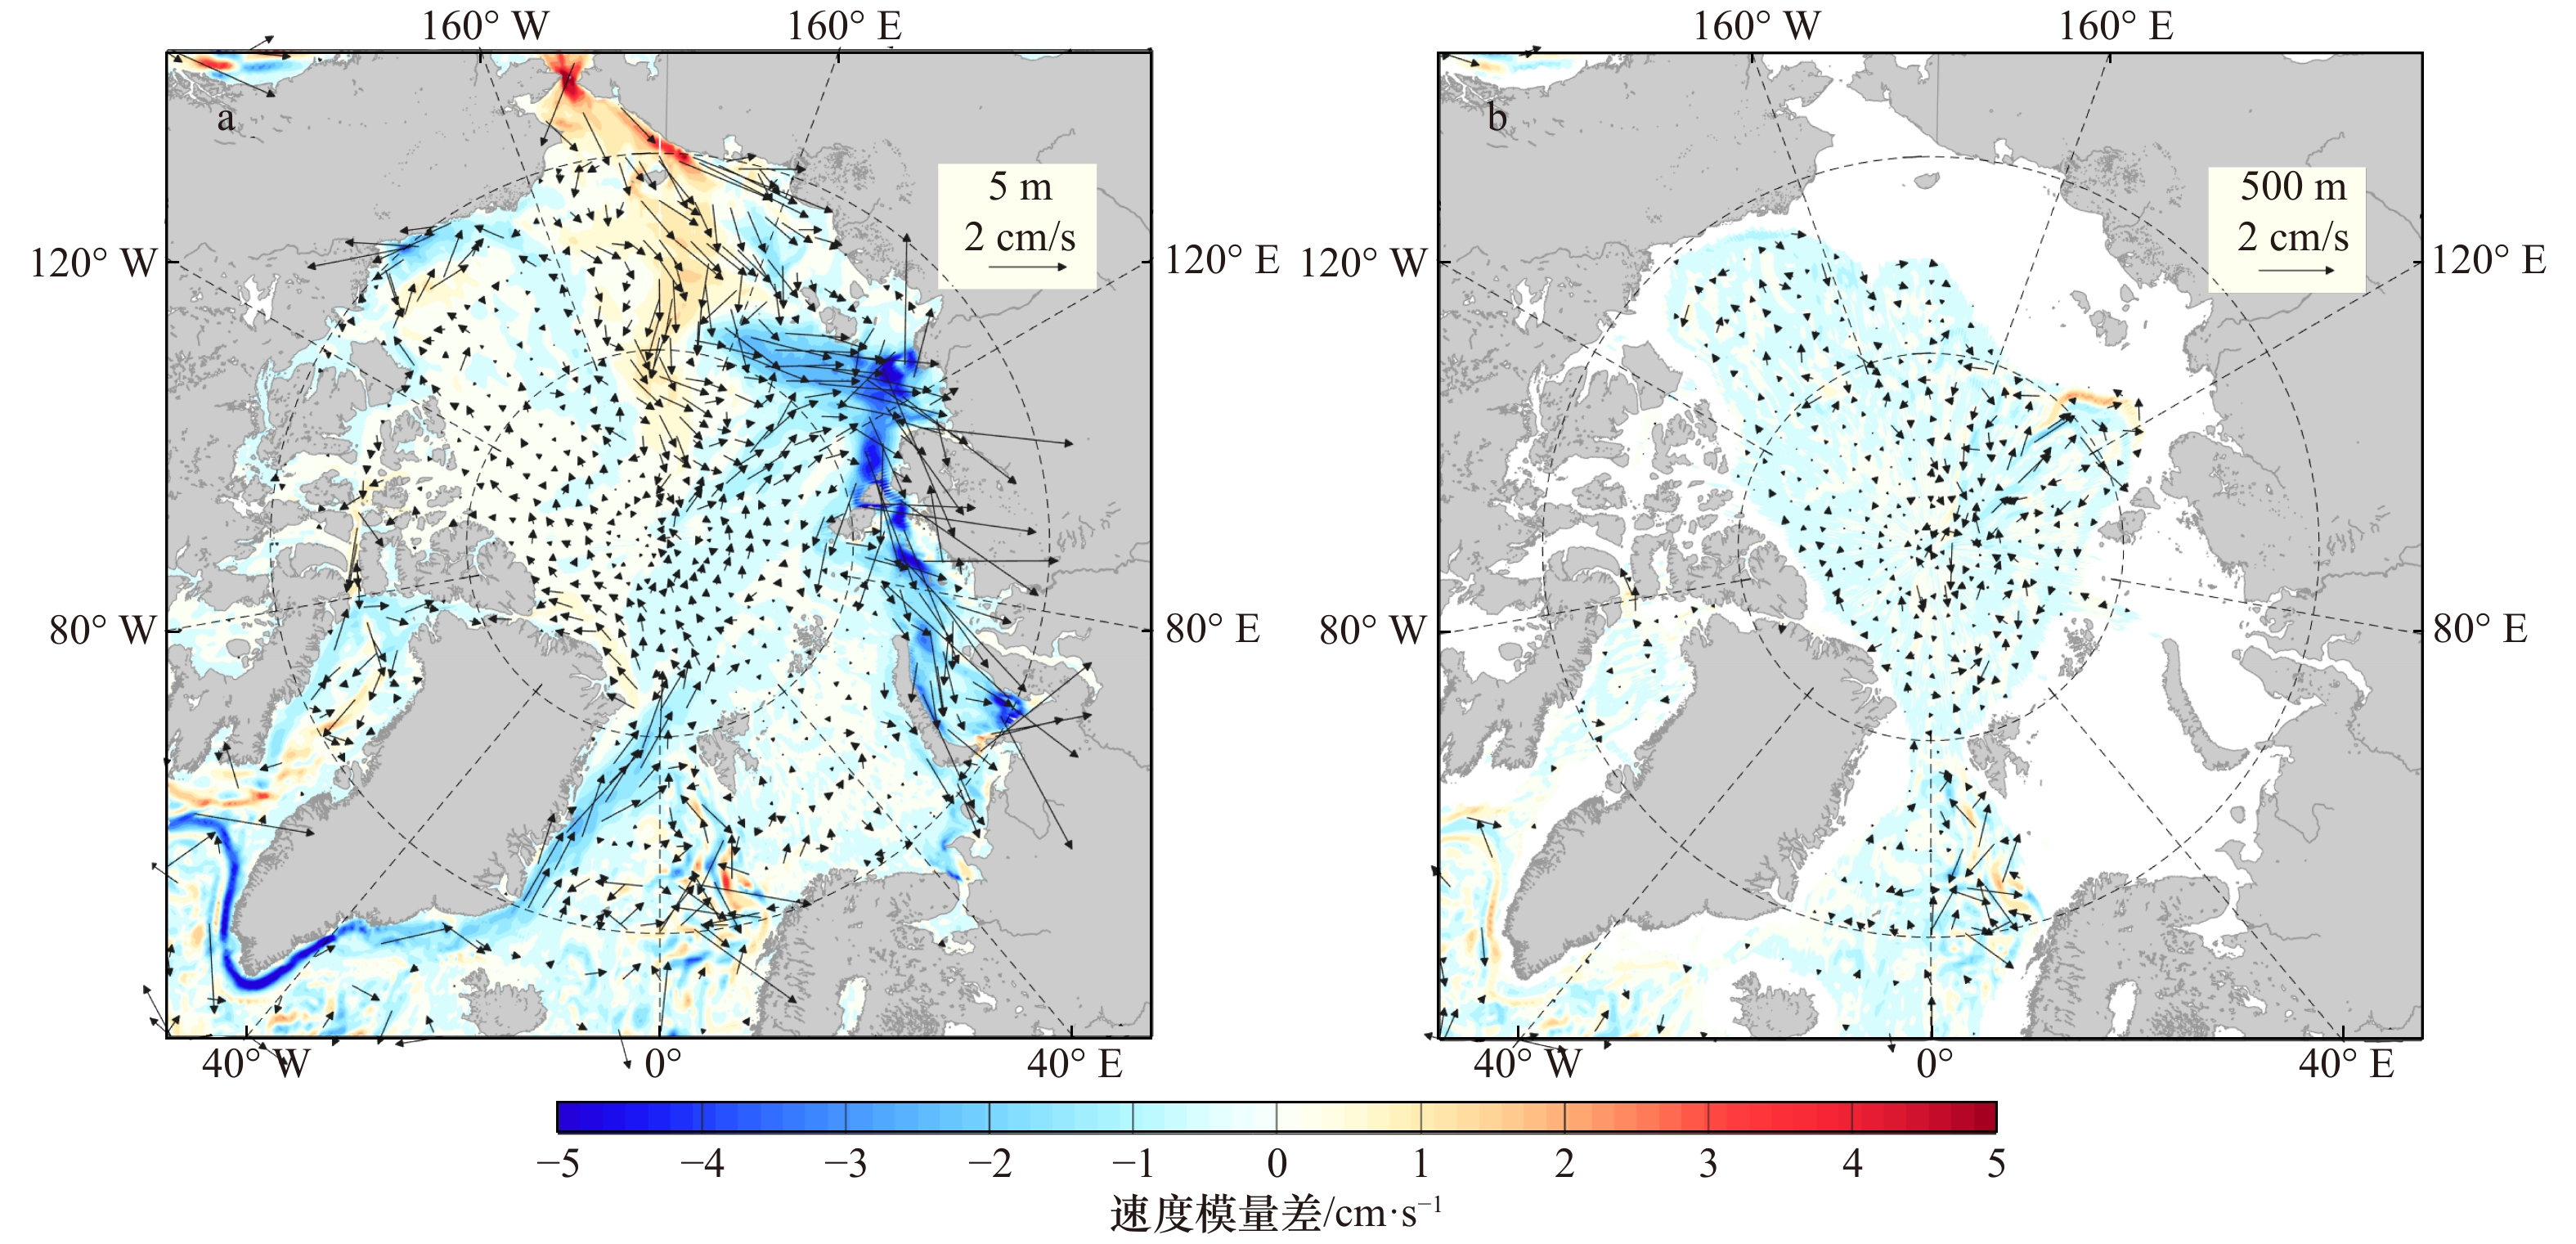
图 12 表层(a)与500 m水深(b)10年平均流速场之差(关闭河流实验B减去控制实验A)
Fig. 12 10 years mean difference of the velocity at surface (a) and 500 m depth (b) (the results from the sensitivity experiment B minus the control experiment A)
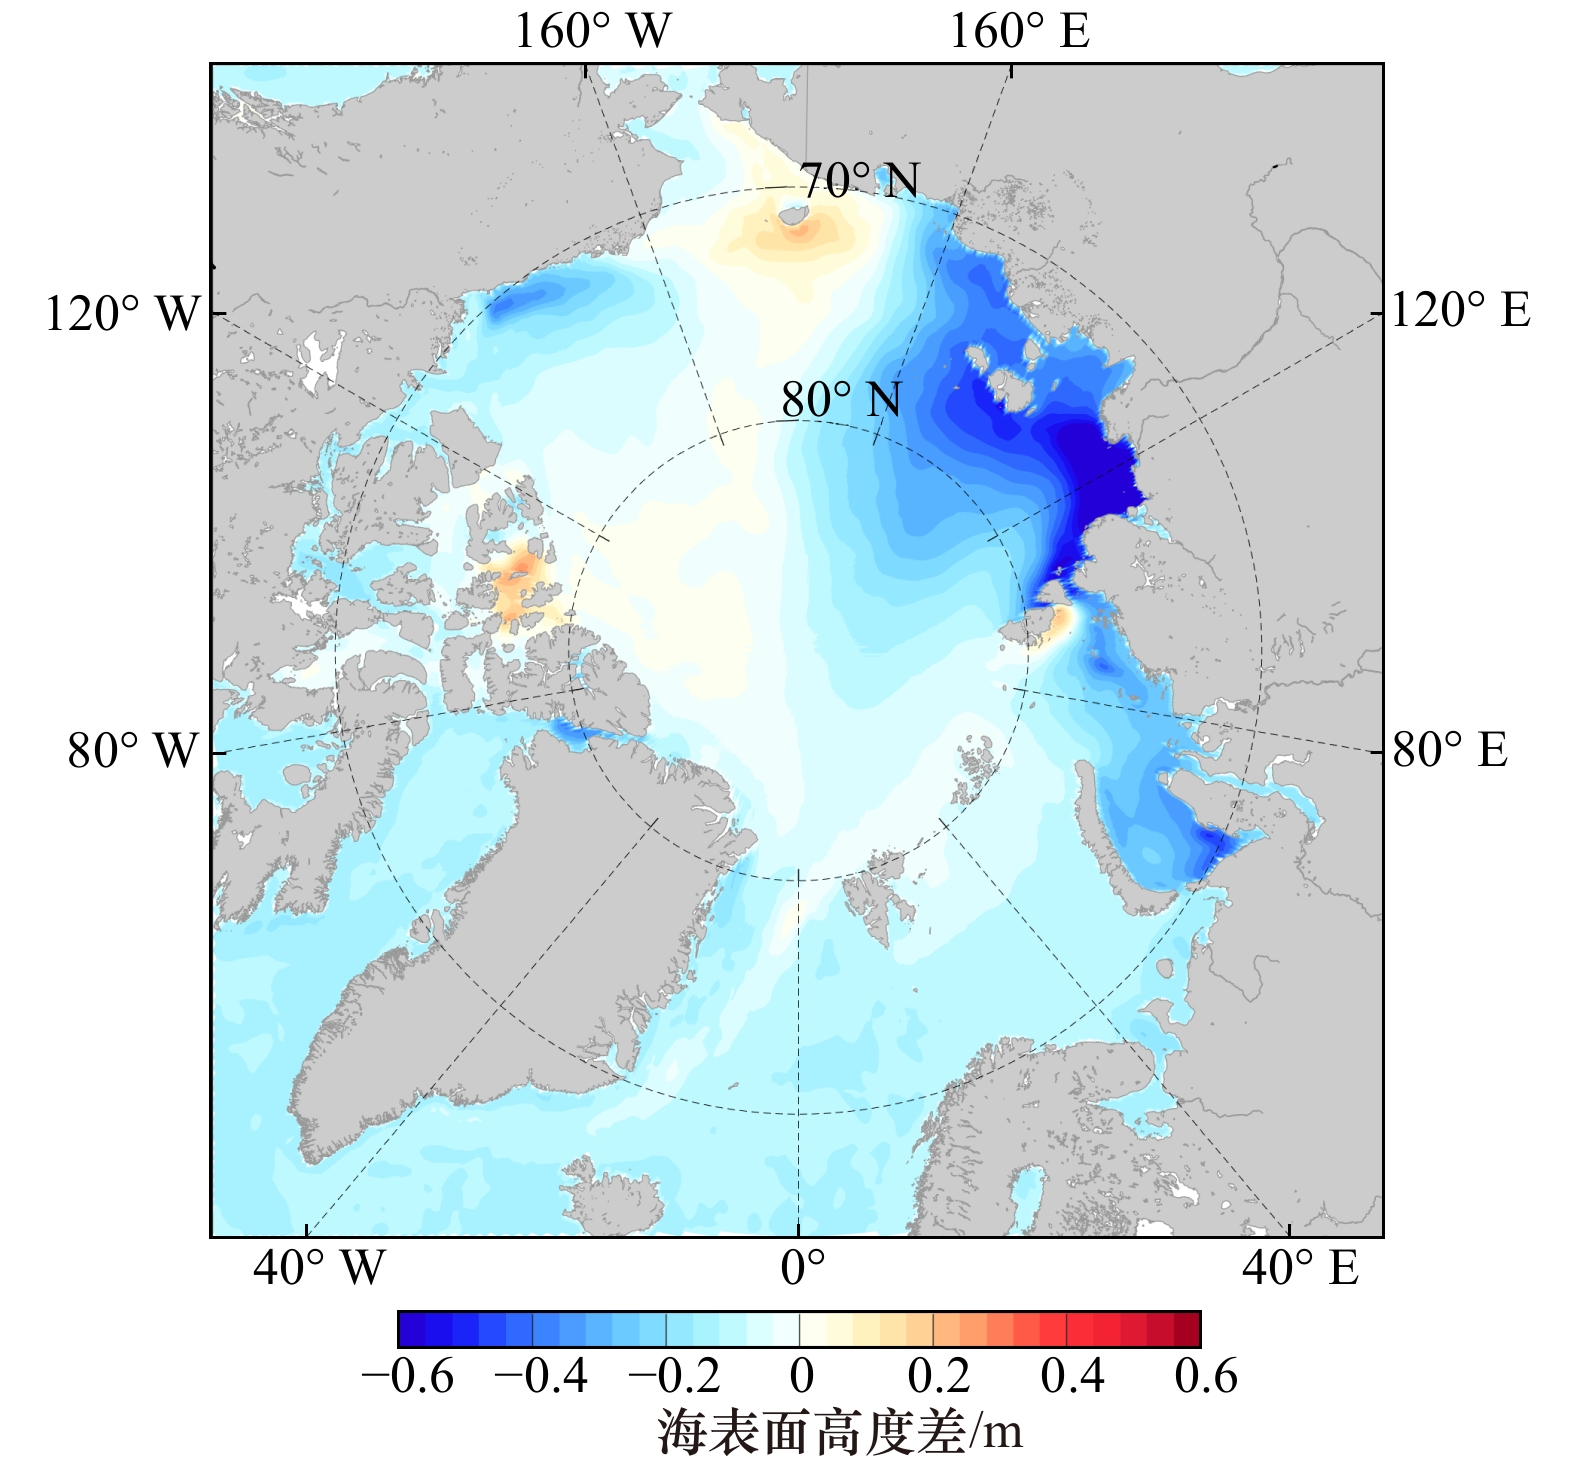
图 13 10年平均海表面高度差(关闭河流实验B减去控制实验A)
Fig. 13 10 years mean difference of the sea surface height (the results from the sensitivity experiment B minus the control experiment A)

图 14 各边缘海区域平均位势温度廓线对比
Fig. 14 Time-mean profiles of the potential temperature for each marginal sea
-
[1] Peterson B J, Holmes R M, McClelland J W, et al. Increasing river discharge to the Arctic Ocean[J]. Science, 2002, 298(5601): 2171−2173. doi: 10.1126/science.1077445 [2] Spall M A. On the circulation of Atlantic water in the Arctic Ocean[J]. Journal of Physical Oceanography, 2013, 43(11): 2352−2371. doi: 10.1175/JPO-D-13-079.1 [3] Rudels B. Arctic Ocean circulation, processes and water masses: A description of observations and ideas with focus on the period prior to the International Polar Year 2007-2009[J]. Progress in Oceanography, 2015, 132: 22−67. doi: 10.1016/j.pocean.2013.11.006 [4] Rawlins M A, Steele M, Holland M M, et al. Analysis of the Arctic system for freshwater cycle intensification: Observations and expectations[J]. Journal of Climate, 2010, 23(21): 5715−5737. doi: 10.1175/2010JCLI3421.1 [5] Nummelin A, Ilicak M, Li C, et al. Consequences of future increased Arctic runoff on Arctic Ocean stratification, circulation, and sea ice cover[J]. Journal of Geophysical Research: Oceans, 2016, 121(1): 617−637. doi: 10.1002/2015JC011156 [6] Pemberton P, Nilsson J. The response of the central Arctic Ocean stratification to freshwater perturbations[J]. Journal of Geophysical Research: Oceans, 2016, 121(1): 792−817. doi: 10.1002/2015JC011003 [7] Schlosser P, Newton R, Ekwurzel B, et al. Decrease of river runoff in the upper waters of the Eurasian Basin, Arctic Ocean, between 1991 and 1996: Evidence from δ18O data[J]. Geophysical Research Letters, 2002, 29(9): 1894. [8] Woodgate R A, Aagaard K, Weingartner T J. Monthly temperature, salinity, and transport variability of the Bering Strait through flow[J]. Geophysical Research Letters, 2005, 32(4): L04601. [9] Condron A, Winsor P, Hill C, et al. Simulated response of the Arctic freshwater budget to extreme NAO wind forcing[J]. Journal of Climate, 2009, 22(9): 2422−2437. doi: 10.1175/2008JCLI2626.1 [10] Serreze M C, Barrett A P, Slater A G, et al. The large-scale freshwater cycle of the Arctic[J]. Journal of Geophysical Research: Oceans, 2006, 111(C11): C11010. doi: 10.1029/2005JC003424 [11] 赵进平, 史久新. 北极环极边界流研究及其主要科学问题[J]. 极地研究, 2004, 16(3): 159−170.Zhao Jinping, Shi Jiuxin. Research progresses and main scientific issues in studies for Arctic circumpolar boundary current[J]. Chinese Journal of Polar Research, 2004, 16(3): 159−170. [12] 史久新, 赵进平. 北冰洋盐跃层研究进展[J]. 地球科学进展, 2003, 18(3): 351−357. doi: 10.3321/j.issn:1001-8166.2003.03.005Shi Jiuxin, Zhao Jinping. Adcances in studies on the Arctic halocline[J]. Advance in Earth Sciences, 2003, 18(3): 351−357. doi: 10.3321/j.issn:1001-8166.2003.03.005 [13] Nummelin A, Li C, Smedsrud L H. Response of Arctic Ocean stratification to changing river runoff in a column model[J]. Journal of Geophysical Research: Oceans, 2015, 120(4): 2655−2675. doi: 10.1002/2014JC010571 [14] Björk G, Söderkvist J, Winsor P, et al. Return of the cold halocline layer to the Amundsen Basin of the Arctic Ocean: Implications for the sea ice mass balance[J]. Geophysical Research Letters, 2002, 29(11): 8-1−8-4. [15] Newton R, Schlosser P, Martinson D G, et al. Freshwater distribution in the Arctic Ocean: Simulation with a high-resolution model and model-data comparison[J]. Journal of Geophysical Research: Oceans, 2008, 113(C5): C05024. [16] Steele M, Boyd T. Retreat of the cold halocline layer in the Arctic Ocean[J]. Journal of Geophysical Research: Oceans, 1998, 103(C5): 10419−10435. doi: 10.1029/98JC00580 [17] Lambert E, Nummelin A, Pemberton P, et al. Tracing the imprint of river runoff variability on Arctic water mass transformation[J]. Journal of Geophysical Research: Oceans, 2019, 124(1): 302−319. doi: 10.1029/2017JC013704 [18] Jahn A, Tremblay L B, Newton R, et al. A tracer study of the Arctic Ocean's liquid freshwater export variability[J]. Journal of Geophysical Research: Oceans, 2010, 115(C7): C07015. [19] Mu Longjiang, Zhao Jinping, Zhong Wenli. Regime shift of the dominant factor for halocline depth in the Canada Basin during 1990−2008[J]. Acta Oceanologica Sinica, 2017, 36(1): 35−43. doi: 10.1007/s13131-016-0883-0 [20] Aagaard K, Roach A T, Schumacher J D. On the wind-driven variability of the flow through Bering Strait[J]. Journal of Geophysical Research: Oceans, 1985, 90(C4): 7213−7221. doi: 10.1029/JC090iC04p07213 [21] Aagaard K, Carmack E C. The role of sea ice and other fresh water in the Arctic circulation[J]. Journal of Geophysical Research: Oceans, 1989, 94(C10): 14485−14498. doi: 10.1029/JC094iC10p14485 [22] Arzel O, Fichefet T, Goosse H, et al. Causes and impacts of changes in the Arctic freshwater budget during the twentieth and twenty-first centuries in an AOGCM[J]. Climate Dynamics, 2008, 30(1): 37−58. [23] Häkkinen S. Simulated interannual variability of the Greenland Sea deep water formation and its connection to surface forcing[J]. Journal of Geophysical Research: Oceans, 1995, 100(C3): 4761−4770. doi: 10.1029/94JC01900 [24] Holland M M, Bitz C M, Eby M, et al. The role of ice–ocean interactions in the variability of the North Atlantic thermohaline circulation[J]. Journal of Climate, 2001, 14(5): 656−675. doi: 10.1175/1520-0442(2001)014<0656:TROIOI>2.0.CO;2 [25] Manabe S, Stouffer R J. Simulation of abrupt climate change induced by freshwater input to the North Atlantic Ocean[J]. Nature, 1995, 378(6553): 165−167. doi: 10.1038/378165a0 [26] Rennermalm A K, Wood E F, Déry S J, et al. Sensitivity of the thermohaline circulation to Arctic Ocean runoff[J]. Geophysical Research Letters, 2006, 33(12): L12703. doi: 10.1029/2006GL026124 [27] Rennermalm A K, Wood E F, Weaver A J, et al. Relative sensitivity of the Atlantic meridional overturning circulation to river discharge into Hudson Bay and the Arctic Ocean[J]. Journal of Geophysical Research: Biogeosciences, 2007, 112(G4): G04S48. [28] Weaver A J, Marotzke J, Cummins P F, et al. Stability and variability of the thermohaline circulation[J]. Journal of Physical Oceanography, 1993, 23(1): 39−60. doi: 10.1175/1520-0485(1993)023<0039:SAVOTT>2.0.CO;2 [29] Stocker T F, Timmermann A, Renold M, et al. Effects of salt compensation on the climate model response in simulations of large changes of the Atlantic meridional overturning circulation[J]. Journal of Climate, 2007, 20(24): 5912−5928. doi: 10.1175/2007JCLI1662.1 [30] Stouffer R J, Yin J, Gregory J M, et al. Investigating the causes of the response of the thermohaline circulation to past and future climate changes[J]. Journal of Climate, 2006, 19(8): 1365−1387. doi: 10.1175/JCLI3689.1 [31] Mignot J, Ganopolski A, Levermann A. Atlantic subsurface temperatures: Response to a shutdown of the overturning circulation and consequences for its recovery[J]. Journal of Climate, 2007, 20(19): 4884−4898. doi: 10.1175/JCLI4280.1 [32] Whitefield J, Winsor P, McClelland J, et al. A new river discharge and river temperature climatology data set for the pan-Arctic region[J]. Ocean Modelling, 2015, 88: 1−15. doi: 10.1016/j.ocemod.2014.12.012 [33] Brown N J, Nilsson J, Pemberton P. Arctic Ocean freshwater dynamics: transient response to increasing river runoff and precipitation[J]. Journal of Geophysical Research: Oceans, 2019, 124(7): 5205−5219. doi: 10.1029/2018JC014923 [34] 牟龙江, 赵进平. 北极冰海耦合模式对两种不同大气再分析资料响应的分析[J]. 海洋学报, 2015, 37(11): 79−91.Mu Longjiang, Zhao Jinping. Analysis on the response of an Arctic ice-ocean coupled model to two different atmospheric reanalysis datasets[J]. Haiyang Xuebao, 2015, 37(11): 79−91. [35] 杨清华, 刘骥平, 张占海, 等. 北极海冰数值预报的初步研究——基于海冰−海洋耦合模式MITgcm的模拟试验[J]. 大气科学, 2011, 35(3): 473−482. doi: 10.3878/j.issn.1006-9895.2011.03.08Yang Qinghua, Liu Jiping, Zhang Zhanhai, et al. A preliminary study of the Arctic sea ice numerical forecasting: coupled sea ice-ocean modelling experiments based on MITgcm[J]. Chinese Journal of Atmospheric Sciences, 2011, 35(3): 473−482. doi: 10.3878/j.issn.1006-9895.2011.03.08 [36] Zhang Yu, Chen Changsheng, Beardsley R C, et al. Studies of the Canadian Arctic Archipelago water transport and its relationship to basin-local forcings: results from AO-FVCOM[J]. Journal of Geophysical Research Oceans, 2016, 121(6): 4392−4415. doi: 10.1002/2016JC011634 [37] Yang Qinghua, Loza S, Losch M, et al. Improving the Arctic sea-ice numerical forecasts by assimilation using a local SEIK filter[C]//International Symposium on Sea Ice in a Changing Environment, Hobart, Australia, 10 March 2014 - 14 March 2014. [38] Mu Longjiang, Liang Xi, Yang Qinghua, et al. Arctic Ice Ocean prediction system: evaluating sea-ice forecasts during Xuelong's first trans-Arctic Passage in summer 2017[J]. Journal of Glaciology, 2019, 65(253): 813−821. doi: 10.1017/jog.2019.55 [39] Gao Guoping, Chen Changsheng, Qi Jianhua, et al. An unstructured-grid, finite-volume sea ice model: Development, validation, and application[J]. Journal of Geophysical Research: Oceans, 2011, 116(C8): C00D04. [40] Zhang Yu, Chen Changsheng, Beardsley R C, et al. Seasonal and interannual variability of the Arctic sea ice: A comparison between AO-FVCOM and observations[J]. Journal of Geophysical Research: Oceans, 2016, 121(11): 8320−8350. doi: 10.1002/2016JC011841 [41] Pemberton P, Nilsson J, Hieronymus M, et al. Arctic Ocean water mass transformation in S–T coordinates[J]. Journal of Physical Oceanography, 2015, 45(4): 1025−1050. doi: 10.1175/JPO-D-14-0197.1 [42] Marshall J C, Scott J R, Proshutinsky A. 'Climate Response Functions' for the Arctic Ocean: a proposed coordinated modeling experiment[J]. Geoscientific Model Development Discussions, 2017, 10(7): 1−25. [43] Menemenlis D, Campin J M, Heimbach P, et al. ECCO2: High resolution global ocean and sea ice data synthesis[J]. Mercator Ocean Quarterly Newsletter, 2008, 31: 13−21. [44] Marshall J, Adcroft A, Hill C, et al. A finite-volume, incompressible Navier Stokes model for studies of the ocean on parallel computers[J]. Journal of Geophysical Research: Oceans, 1997, 102(C3): 5753−5766. doi: 10.1029/96JC02775 [45] Adcroft A, Campin J M, Hill C, et al. Implementation of an atmosphere–ocean general circulation model on the expanded spherical cube[J]. Monthly Weather Review, 2004, 132(12): 2845−2863. doi: 10.1175/MWR2823.1 [46] Nurser A J G, Bacon S. The Rossby radius in the Arctic Ocean[J]. Ocean Science, 2014, 10(6): 967−975. doi: 10.5194/os-10-967-2014 [47] Ebita A, Kobayashi S, Ota Y, et al. The Japanese 55-year reanalysis “JRA-55”: an interim report[J]. Sola, 2011, 7: 149−152. doi: 10.2151/sola.2011-038 [48] Steele M, Morley R, Ermold W. PHC: A global ocean hydrography with a high-quality Arctic Ocean[J]. Journal of Climate, 2001, 14(9): 2079−2087. doi: 10.1175/1520-0442(2001)014<2079:PAGOHW>2.0.CO;2 [49] Komuro Y. The impact of surface mixing on the Arctic river water distribution and stratification in a global ice–ocean model[J]. Journal of Climate, 2014, 27(12): 4359−4370. doi: 10.1175/JCLI-D-13-00090.1 [50] Nguyen A T, Menemenlis D, Kwok R. Improved modeling of the Arctic halocline with a subgrid-scale brine rejection parameterization[J]. Journal of Geophysical Research: Oceans, 2009, 114(C11): C11014. doi: 10.1029/2008JC005121 [51] Manizza M, Follows M J, Dutkiewicz S, et al. Modeling transport and fate of riverine dissolved organic carbon in the Arctic Ocean[J]. Global Biogeochemical Cycles, 2009, 23(4): GB4006. [52] Nguyen A T, Menemenlis D, Kwok R. Arctic ice-ocean simulation with optimized model parameters: Approach and assessment[J]. Journal of Geophysical Research: Oceans, 2011, 116(C4): C04025. [53] Nguyen A T, Kwok R, Menemenlis D. Source and pathway of the Western Arctic upper halocline in a data-constrained coupled ocean and sea ice model[J]. Journal of Physical Oceanography, 2012, 42(5): 802−823. doi: 10.1175/JPO-D-11-040.1 [54] Huhn O, Hellmer H, Rhein M, et al. Evidence of deep- and bottom-water formation in the western Weddell Sea[J]. Deep-Sea Research Part II: Topical Studies in Oceanography, 2008, 55(8/9): 1098−1116. [55] Smith H J. Runoff in the Arctic[J]. Science, 2013, 339(6119): 491−491. [56] Inoue J, Kikuchi T. Outflow of summertime Arctic sea ice observed by ice drifting buoys and its linkage with ice reduction and atmospheric circulation patterns[J]. Journal of the Meteorological Society of Japan, 2007, 85(6): 881−887. doi: 10.2151/jmsj.85.881 [57] Wang Xiaoyu, Zhao Jinping. Seasonal and inter-annual variations of the primary types of the Arctic sea-ice drifting patterns[J]. Advances in Polar Science, 2012, 23(2): 72−81. -

 下载:
下载:


 点击查看大图
计量
- 文章访问数: 415
- HTML全文浏览量: 47
- PDF下载量: 72
- 被引次数: 0
