

An experimental study on parametric scheme of lateral melting rate of ice layer based on temperature
-
摘要: 为定量探究影响冰层侧向融化的主导因素,并简化冰层侧向融化速率参数化方案,在实验室模拟了无风、静水、无辐射、纯热力学条件下纯水冰的融化过程,测量了冰层的侧向融化量,并记录了融化期间实验室气温、冰面皮温、水温及冰温等要素。观测结果表明,无辐射纯热力学条件下冰层侧向融化整体较均匀,侧向上层和下层融化速率相对中间层较快;相关性分析结果表明,气温与水温、冰温、冰面皮温之间都有很好的线性相关;信息流结果表明,气温是影响冰层侧向融化的最主要因素;最后通过拟合建立了用气温表征冰层侧向融化速率的参数化方案,并与前人的方案进行了比较,结果显示本文参数化方案模拟效果较好,所得标准偏差最小,为0.08 mm/h,达到了简化参数的目的。Abstract: In order to quantitatively explore the main factors that affect the lateral melting of the ice layer and simplify the parametric scheme of the lateral melting rate of the ice layer, the melting process of pure water ice under the conditions of no wind, still water, no radiation and pure thermodynamics was simulated in the laboratory, the lateral melting amount of the ice layer was measured, and the laboratory air temperature, ice skin temperature, water temperature, ice temperature and other factors during melting were recorded. The observation results show that under the pure thermodynamic condition of no radiation, the ice layer melts uniformly in the lateral, and the melting rate of the upper and lower layers is faster than that of the middle layer. The results of correlation analysis show that there is a good linear correlation between air temperature and water temperature, ice temperature and ice skin temperature. Information flow results show that air temperature is the most important factor affecting the lateral melting of ice. Finally, a parametric model between the lateral melting rate and the air temperature is established by fitting, and is compared with previous parametric schemes. The results show that the parametric model in this study has a better simulation effect, and the standard deviation is the smallest, which is 0.08 mm/h, thus achieving the purpose of simplifying the parameters.
-
Key words:
- non-radiative pure thermodynamics /
- lateral melting /
- information flow /
- parametricscheme
-
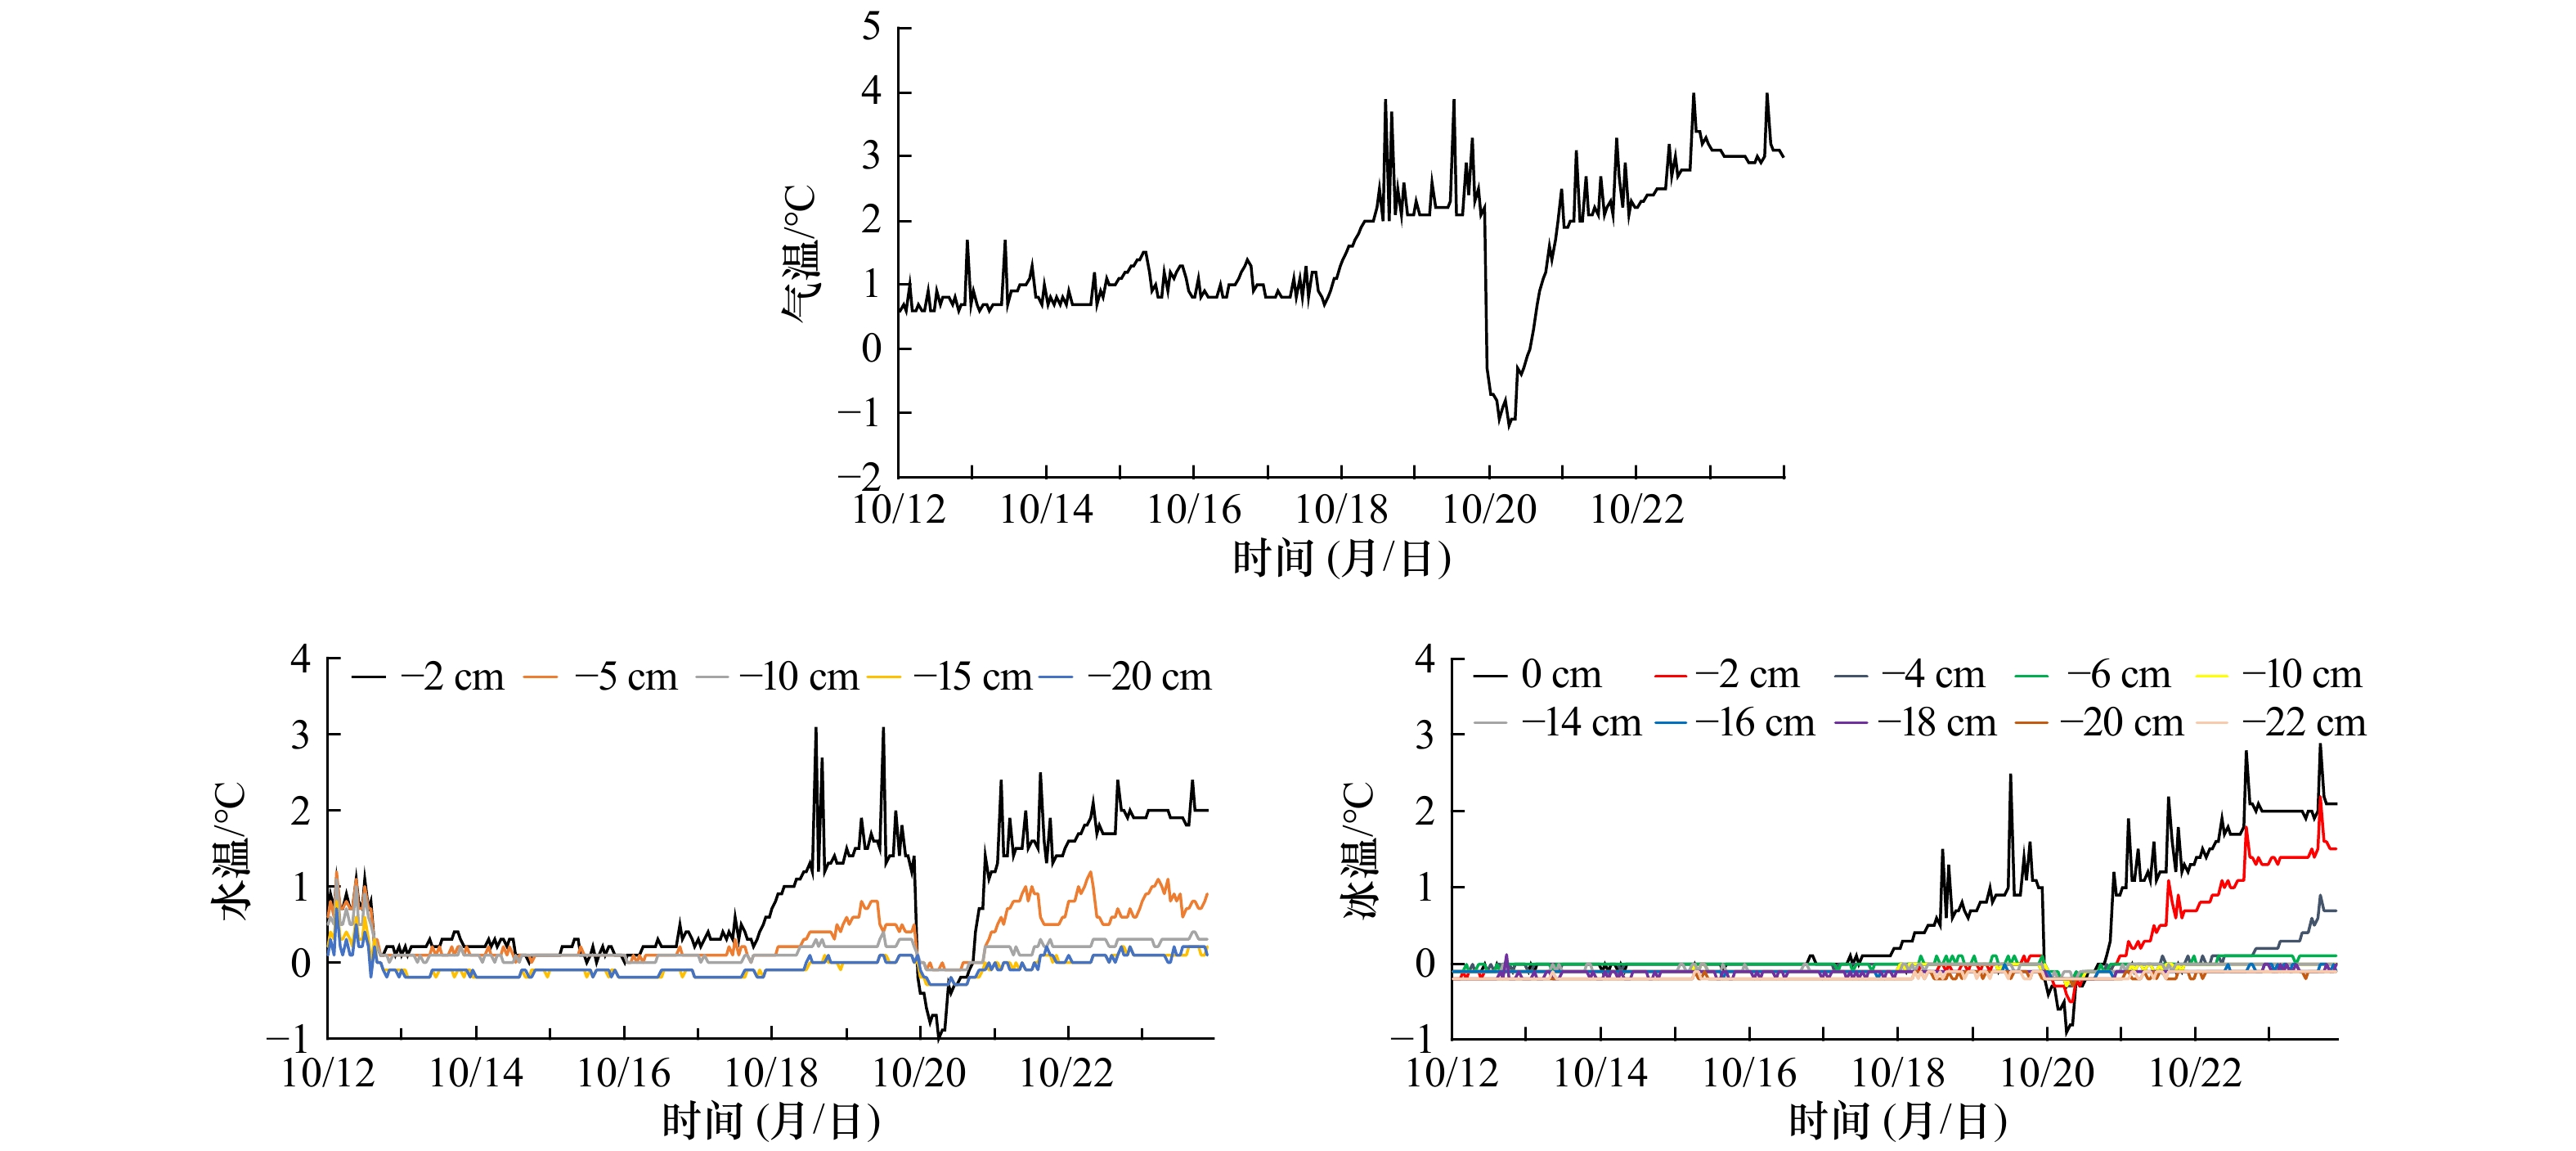
图 3 融化期间观测的气温、水温及冰温
Fig. 3 Observing air temperature, water temperature and ice temperature during melting
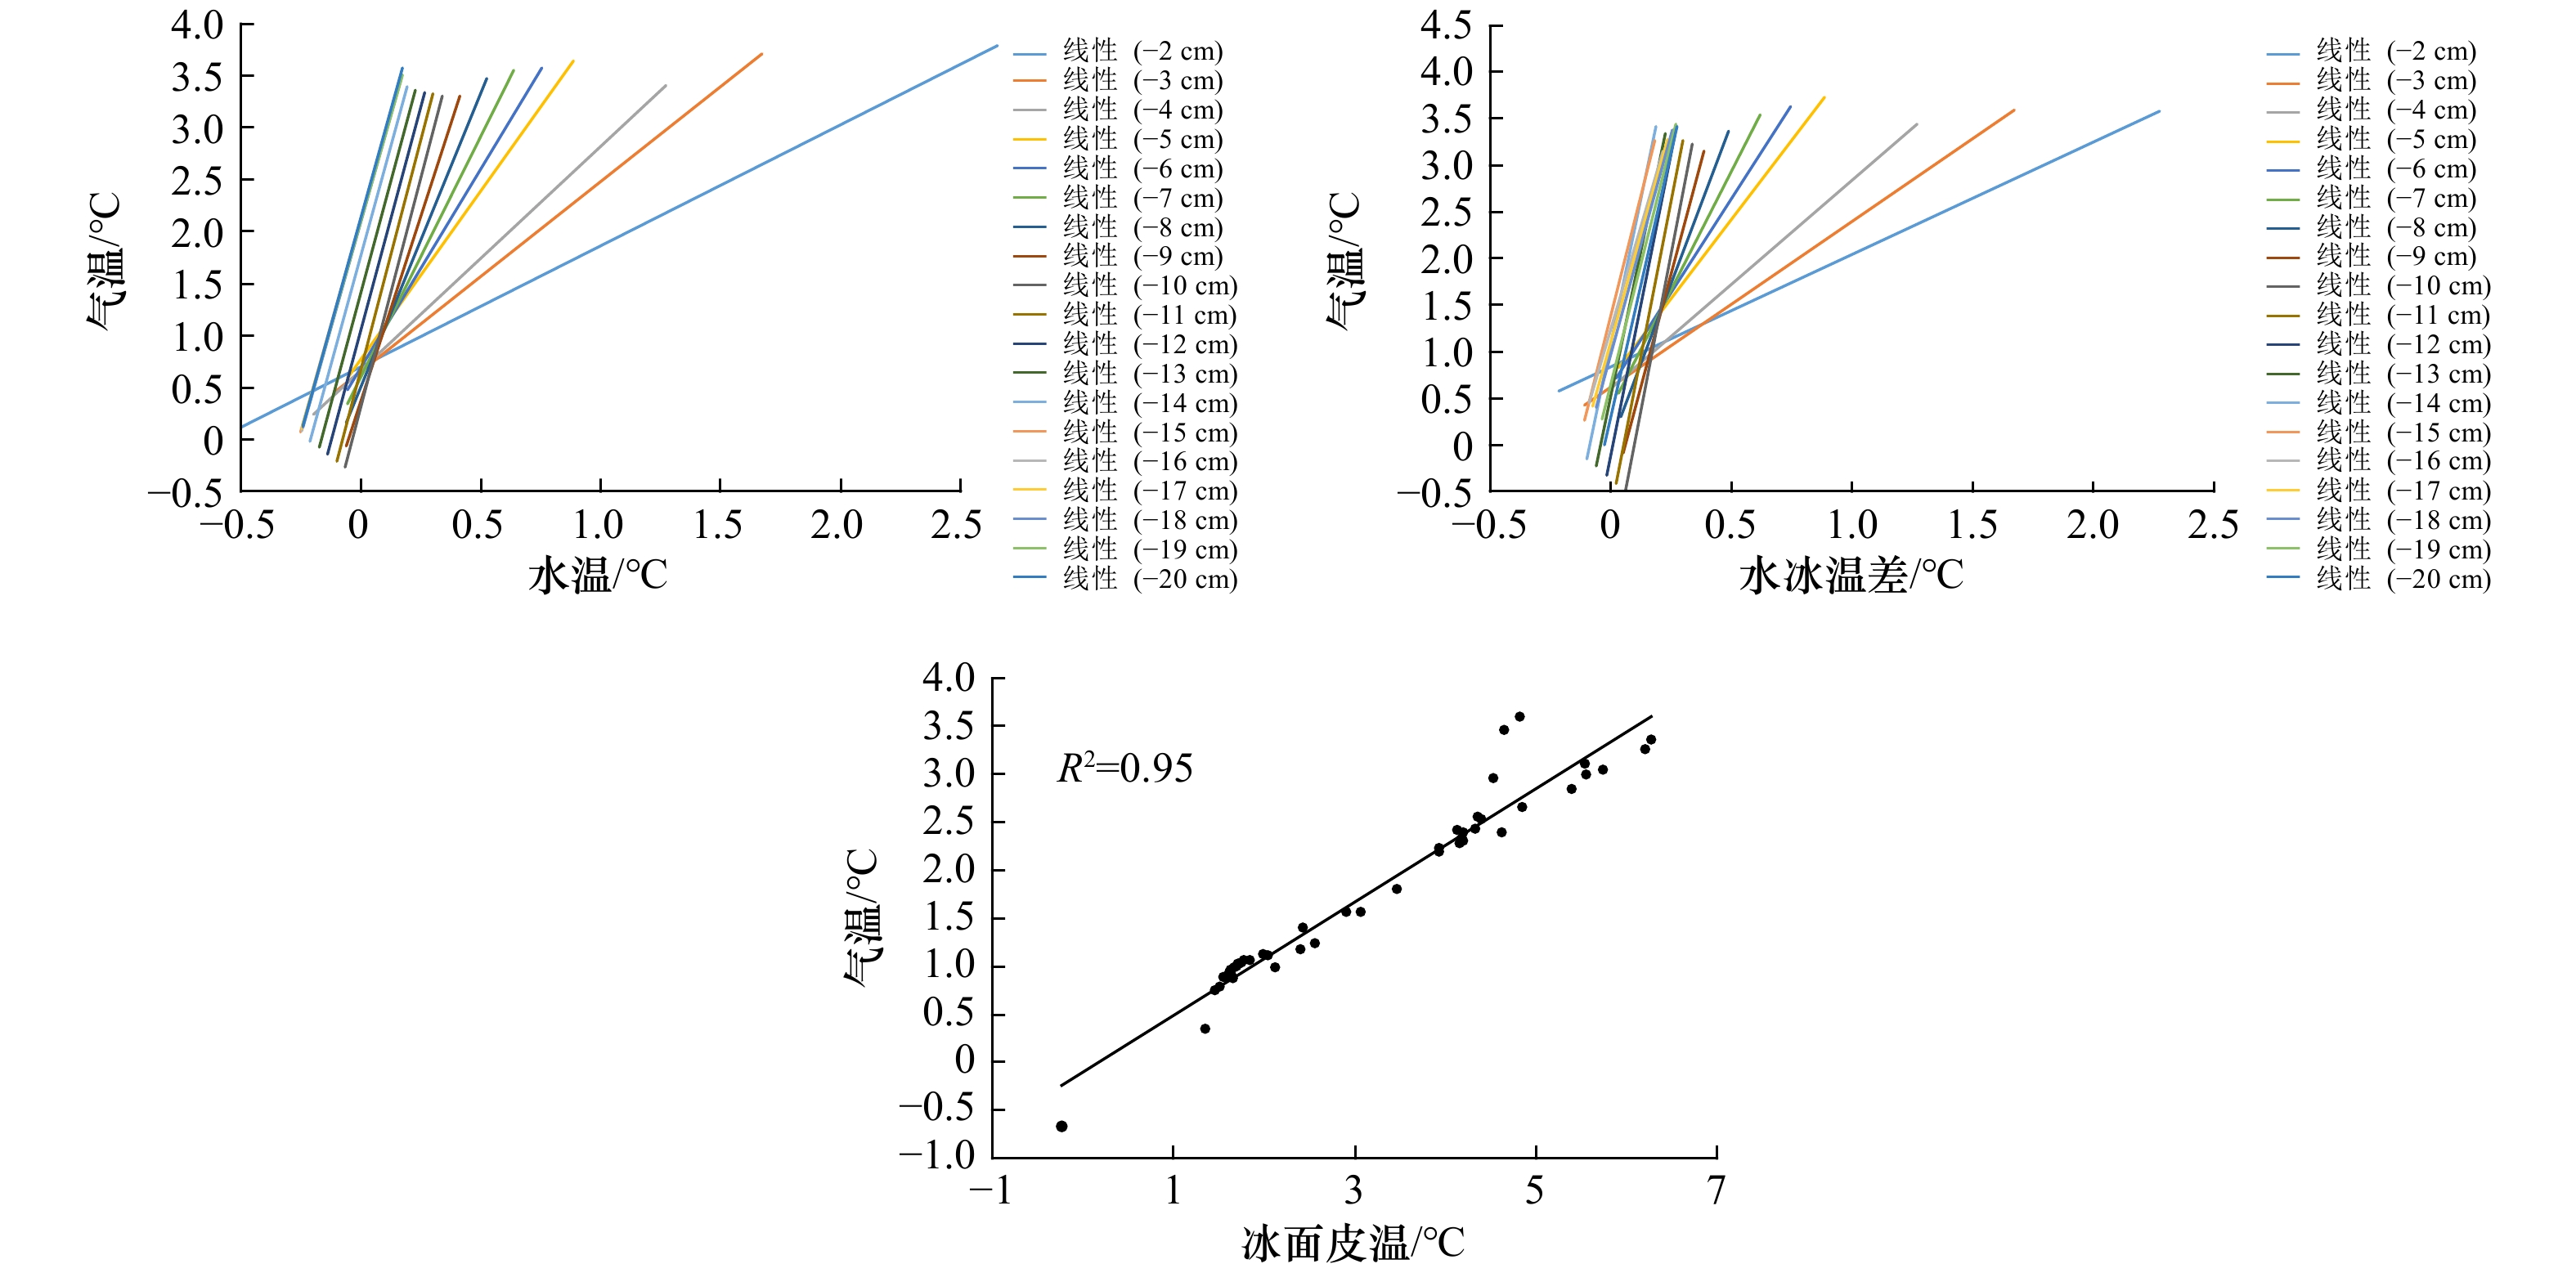
图 5 气温与水温、水冰温差及冰面皮温之间的相关性
Fig. 5 The correlation between air temperature and water temperature, water-ice temperature difference and ice skin temperature
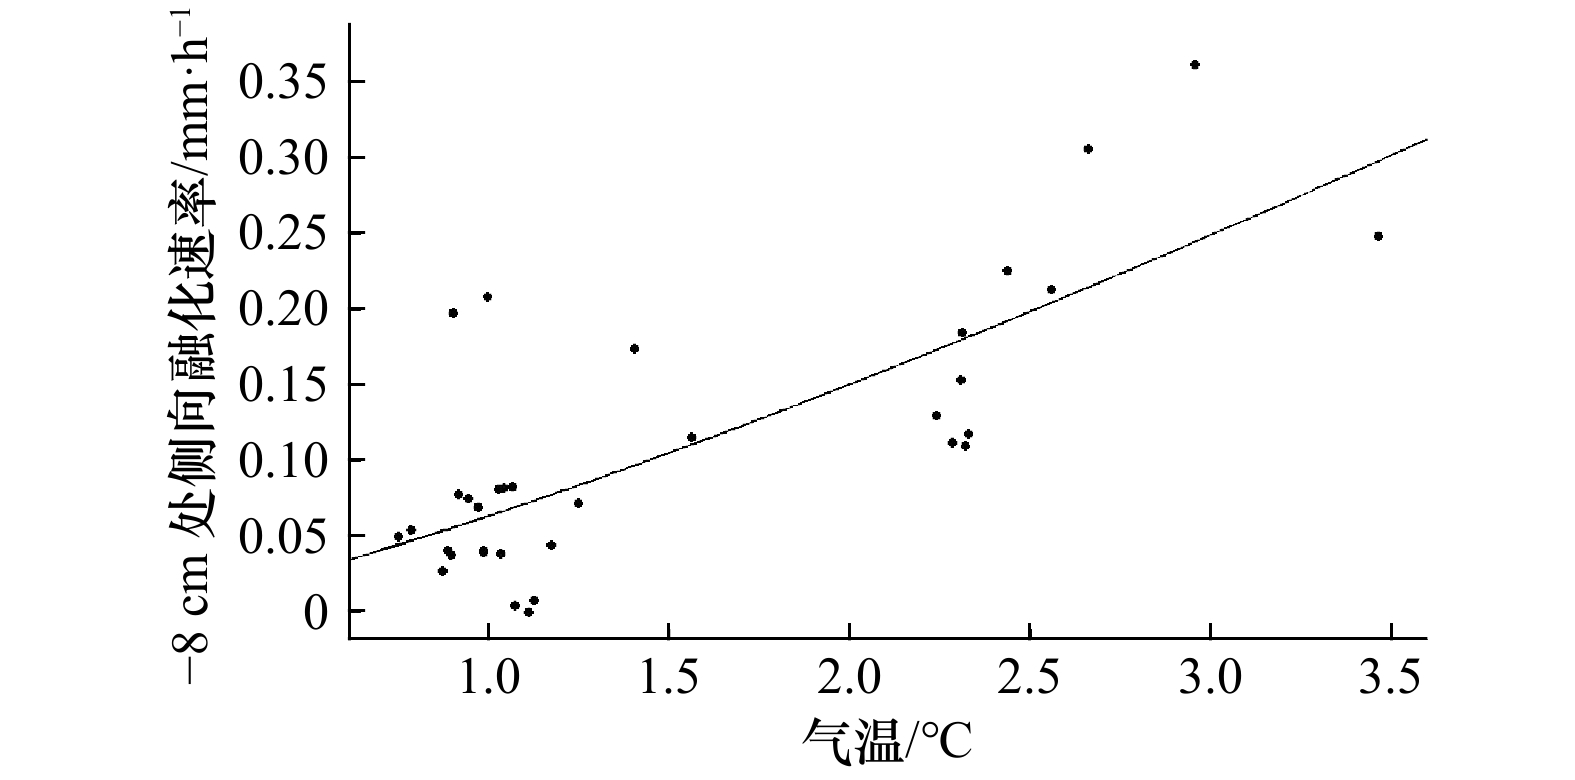
图 6 −8 cm处侧向融化速率与气温拟合
Fig. 6 The fitting diagram of lateral melting rate at −8 cm and air temperature
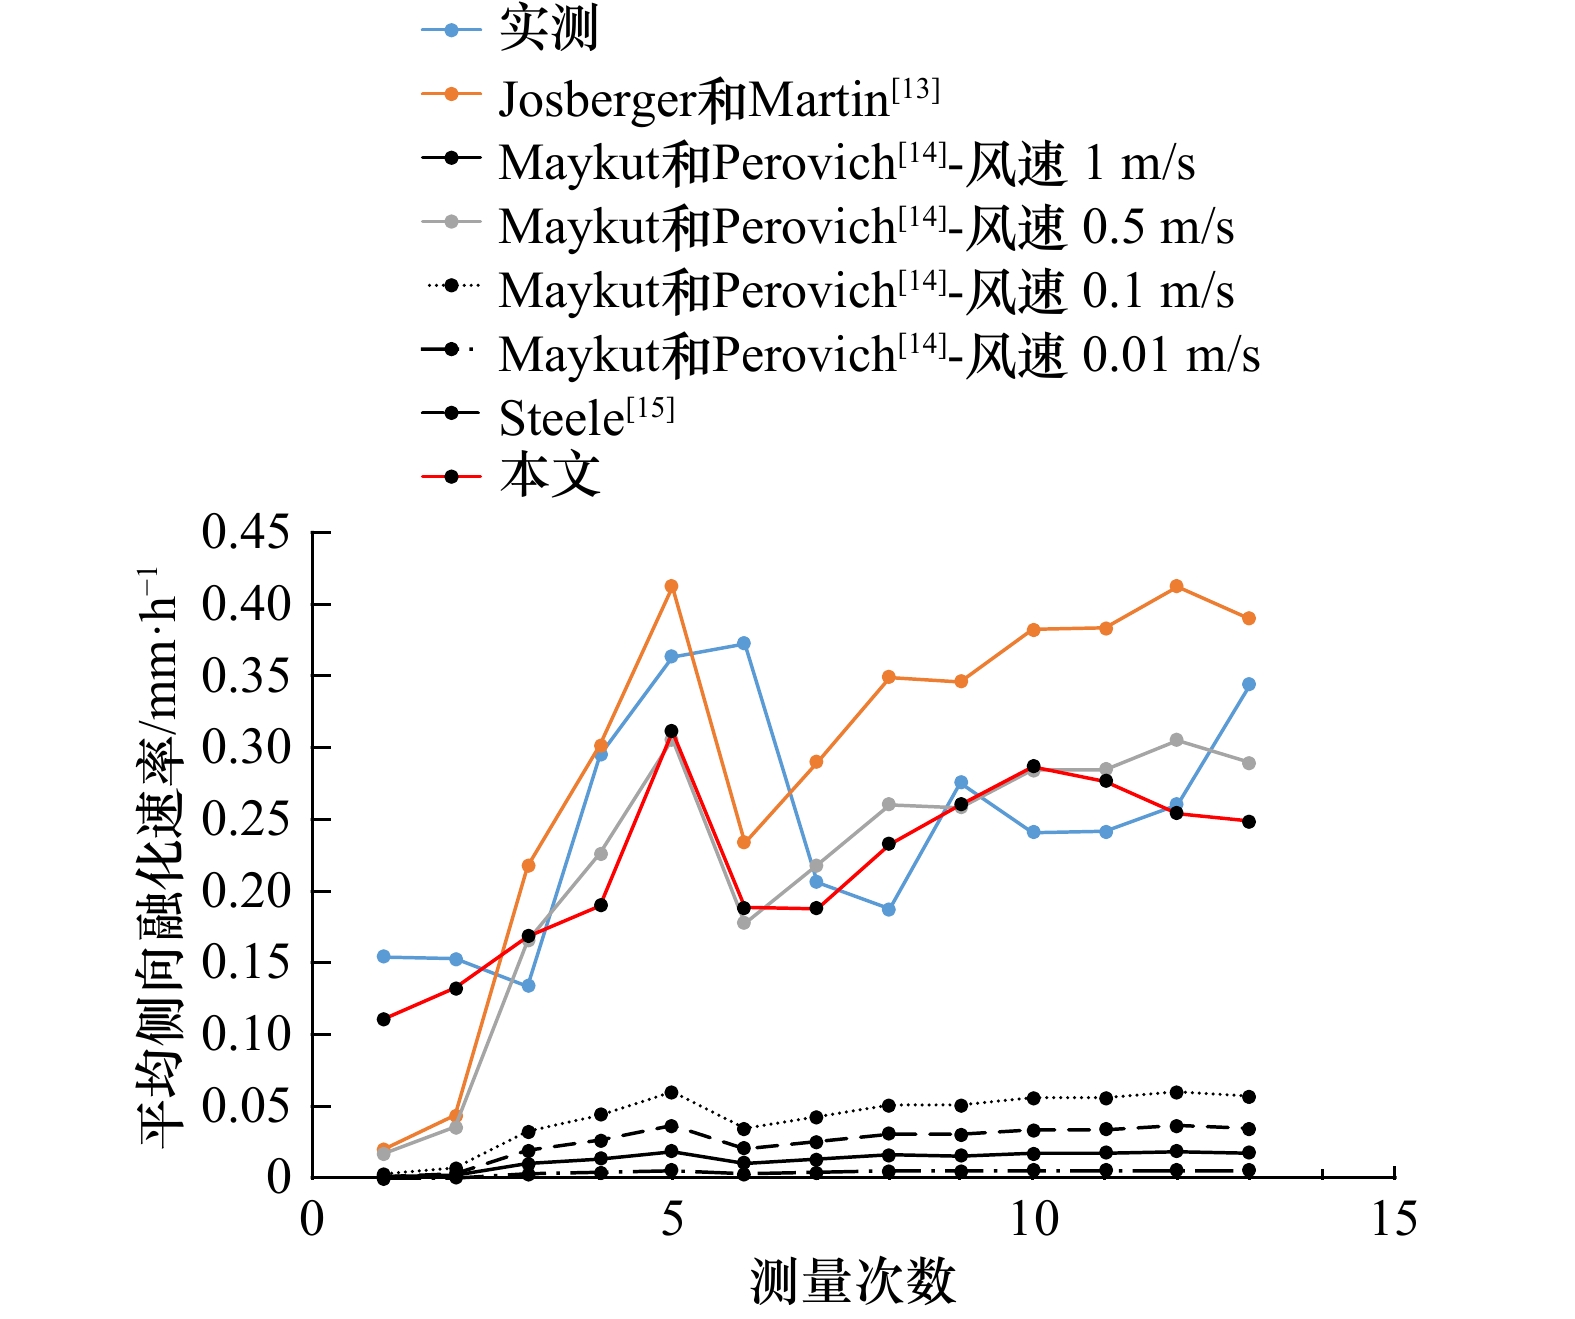
图 7 各参数化方案模拟结果与实测数据对比
Fig. 7 The comparison of simulation results and measured data of each parameterization scheme
表 1 气温与水温及水冰温差之间的拟合优度R2
Tab. 1 The goodness of fit R2 between air temperature and water temperature, water-ice temperature difference
–2 cm –3 cm –4 cm –5 cm –6 cm –7 cm –8 cm –9 cm –10 cm –11 cm 气温–水温 0.96 0.72 0.92 0.74 0.77 0.82 0.87 0.91 0.91 0.91 气温–水冰温差 0.52 0.72 0.85 0.64 0.70 0.74 0.80 0.86 0.80 0.81 –12 cm –13 cm –14 cm –15 cm –16 cm –17 cm –18 cm –19 cm –20 cm 气温–水温 0.91 0.91 0.90 0.90 0.90 0.90 0.89 0.89 0.89 气温–水冰温差 0.82 0.81 0.80 0.86 0.87 0.86 0.82 0.85 0.85  下载: 导出CSV
表 2 各影响因素与侧向融化速率之间的信息流
Tab. 2 Information flow between each influencing factor and the rate of lateral melting
深度/cm 信息传递方向 Ta→Mr Mr→Ta Tw→Mr Mr→Tw Ts→Mr Mr→Ts ∆T→Mr Mr→∆T 0 0.017 0.004 – – 0.029 –0.004 – – –1 –0.004 –0.002 – – 0.003 –0.001 – – –2 –0.004 –0.002 –0.041 –0.036 0.001 0.000 –0.041 –0.036 –3 0.123 0.015 0.007 –0.012 0.109 0.032 0.005 –0.010 –4 0.204 0.029 0.007 0.007 0.185 0.053 0.000 0.000 –5 0.259 0.099 0.296 0.043 0.291 0.026 0.303 0.053 –6 0.446 –0.133 0.311 0.019 0.372 –0.070 0.311 0.034 –7 0.589 –0.065 0.474 0.052 0.570 –0.023 0.447 0.066 –8 0.557 –0.012 0.463 0.098 0.489 0.029 0.473 0.120 –9 0.453 0.068 0.393 0.051 0.443 0.023 0.421 0.079 –10 0.545 –0.109 0.355 –0.005 0.524 –0.092 0.250 0.198 –11 0.435 0.049 0.313 0.105 0.393 0.029 0.287 0.224 –12 0.502 –0.174 0.332 –0.032 0.416 –0.051 0.246 0.101 –13 0.435 –0.158 0.300 –0.009 0.348 –0.073 0.238 0.118 –14 0.400 0.092 0.354 0.091 0.395 0.029 0.321 0.135 –15 0.315 –0.006 0.305 0.038 0.316 0.009 0.332 0.050 –16 0.183 0.079 0.101 0.099 0.210 0.076 0.126 0.092 –17 0.372 0.118 0.327 0.115 0.351 0.047 0.326 0.125 –18 0.359 0.075 0.291 0.072 0.330 0.026 0.310 0.070 –19 0.244 –0.051 0.138 0.107 0.232 –0.014 0.119 0.170 –20 0.230 0.007 0.167 0.059 0.177 0.026 0.192 0.096 –21 0.281 –0.070 – – 0.222 –0.002 – – –22 0.140 0.002 – – 0.106 0.001 – – –23 0.129 0.011 – – 0.102 0.000 – – –24 0.171 –0.070 – – 0.126 –0.065 – – –25 0.161 –0.019 – – 0.124 –0.036 – – –26 0.092 –0.015 – – 0.067 –0.022 – – 注:Mr表示侧向融化速率,Ta表示气温,Ts表示冰面皮温,Tw表示对应层水温,∆T表示对应层水冰温差,–表示水温数据缺失。
下载: 导出CSV
表 3 各参数化方案模拟结果与实测数据标准偏差
Tab. 3 The standard deviation between simulation results and measured data of each parameterization scheme
下载: 导出CSV
-
[1] Haas C, Pfaffling A, Hendricks S, et al. Reduced ice thickness in Arctic Transpolar Drift favors rapid ice retreat[J]. Geophysical Research Letters, 2008, 35(17): L17501. doi: 10.1029/2008GL034457 [2] Comiso J C, Parkinson C L, Gersten R, et al. Accelerated decline in the Arctic sea ice cover[J]. Geophysical Research Letters, 2008, 35(1): L01703. [3] Comiso J C. Large decadal decline of the arctic multiyear ice cover[J]. Journal of Climate, 2012, 25(4): 1176−1193. doi: 10.1175/JCLI-D-11-00113.1 [4] 柯长青, 彭海涛, 孙波, 等. 2002年−2011年北极海冰时空变化分析[J]. 遥感学报, 2013, 17(2): 459−466.Ke Changqing, Peng Haitao, Sun Bo, et al. Spatio-temporal variability of Arctic sea ice from 2002 to 2011[J]. Journal of Remote Sensing, 2013, 17(2): 459−466. [5] Comiso J C, Meier W N, Gersten R. Variability and trends in the Arctic Sea ice cover: Results from different techniques[J]. Journal of Geophysical Research, 2017, 122(8): 6883−6900. [6] 柯长青, 王蔓蔓. 基于CryoSat-2数据的2010-2017年北极海冰厚度和体积的季节与年际变化特征[J]. 海洋学报, 2018, 40(11): 1−13.Ke Changqing, Wang Manman. Seasonal and interannual variation of thinkness and volume of the Arctic sea ice based on CryoSat-2 during 2010-2017[J]. Haiyang Xuebao, 2018, 40(11): 1−13. [7] Lu P, Li Z J, Cheng B, et al. Sea ice surface features in Arctic summer 2008: aerial observations[J]. Remote Sensing of Environment, 2010, 114(4): 693−699. doi: 10.1016/j.rse.2009.11.009 [8] 王庆元, 李清泉, 王兰宁. 侧边界融化对北极海冰影响的数值模拟[J]. 极地研究, 2013, 25(1): 84−89.Wang Qingyuan, Li Qingquan, Wang Lanning. Numerical simulations of the effects of lateral melting on Arctic sea ice[J]. Chinese Journal of Polar Research, 2013, 25(1): 84−89. [9] 张岩, 李畅游, 史小红, 等. 乌梁素海湖泊冰消融过程的现场观测[J]. 海洋湖沼通报, 2016, 36(4): 38−42.Zhang Yan, Li Changyou, Shi Xiaohong, et al. Field observation of ice melting process in Wuliangsuhai Lake[J]. Transactions of Oceanology and Limnology, 2016, 36(4): 38−42. [10] 肖建民, 金龙海, 谢永刚, 等. 寒区水库冰盖形成与消融机理分析[J]. 水利学报, 2004, 35(6): 80−85. doi: 10.3321/j.issn:0559-9350.2004.06.014Xiao Jianmin, Jin Longhai, Xie Yonggang, et al. Study on mechanism of formation and melting of reservoir ice cover in cold area[J]. Journal of Hydraulic Engineering, 2004, 35(6): 80−85. doi: 10.3321/j.issn:0559-9350.2004.06.014 [11] 练继建, 赵新. 静动水冰厚生长消融全过程的辐射冰冻度−日法预测研究[J]. 水利学报, 2011, 42(11): 1261−1267.Lian Jijian, Zhao Xin. Radiation degree-day method for predicting the development of ice cover thickness under the hydrostatic and non-hydrostatic conditions[J]. Journal of Hydraulic Engineering, 2011, 42(11): 1261−1267. [12] 王庆凯, 李志军, 曹晓卫, 等. 实测冰−水侧向界面热力学融化速率[J]. 南水北调与水利科技, 2016, 14(6): 81−86.Wang Qingkai, Li Zhijun, Cao Xiaowei, et al. Analysis of measured thermodynamic melting rate of lateral interface between ice and water[J]. South-to-North Water Transfers and Water Science & Technology, 2016, 14(6): 81−86. [13] Josberger E G, Martin S. A laboratory and theoretical study of the boundary layer adjacent to a vertical melting ice wall in salt water[J]. Journal of Fluid Mechanics, 1981, 111: 439−473. doi: 10.1017/S0022112081002450 [14] Maykut G A, Perovich D K. The role of shortwave radiation in the summer decay of a sea ice cover[J]. Journal of Geophysical Research: Oceans, 1987, 92(C7): 7032−7044. doi: 10.1029/JC092iC07p07032 [15] Steele M. Sea ice melting and floe geometry in a simple ice-ocean model[J]. Journal of Geophysical Research: Oceans, 1992, 97(C11): 17729−17738. doi: 10.1029/92JC01755 [16] Perovich D, Richter-Menge J A. From points to Poles: extrapolating point measurements of sea-ice mass balance[J]. Annals of Glaciology, 2006, 44: 188−192. doi: 10.3189/172756406781811204 [17] Lei R, Li Z, Cheng Y, et al. A new apparatus for monitoring sea ice thickness based on the magnetostrictive-delay-line principle[J]. Journal of Atmospheric & Oceanic Technology, 2009, 26(4): 818−827. [18] 雷瑞波, 李志军, 程斌, 等. 夏季北冰洋浮冰−水道热力学特征现场观测研究[J]. 极地研究, 2010, 22(3): 286−295.Lei Ruibo, Li Zhijun, Cheng Bin, et al. Observations on the thermodynamic balance between floe and lead in the Arctic Ocean during summer[J]. Chinese Journal of Polar Research, 2010, 22(3): 286−295. [19] 王庆凯, 方贺, 李志军, 等. 湖冰侧、底部融化现场观测与热力学分析[J]. 水利学报, 2018, 49(10): 1207−1215.Wang Qingkai, Fang He, Li Zhijun, et al. Field investigations on lateral and bottom melting of lake ice and thermodynamic analysis[J]. Journal of Hydraulic Engineering, 2018, 49(10): 1207−1215. [20] Liang X S. Unraveling the cause-effect relation between time series[J]. Physical Review E, 2014, 90(5): 052150. doi: 10.1103/PhysRevE.90.052150 [21] Liang X S. Information flow and causality as rigorous notions ab initio[J]. Physical Review E, 2015, 94(5): 052201. -

计量
- 文章访问数: 379
- HTML全文浏览量: 113
- PDF下载量: 16
- 被引次数: 0
