

Time-space velocity analysis of coastline based on digital shoreline analysis system: A case study of the Haizhou Bay
-
摘要: 本文选取1985−2018年间具有代表性的6期Landsat遥感影像,运用数字海岸线分析系统,综合利用面积法和基线法定量分析海州湾的岸线变迁,并进行岸线分类和驱动力分析。结果表明,30多年来海州湾岸线整体呈持续向海推进的态势,增长岸线比例总体处于不断增加的趋势,除了2005−2009年发生短暂的减小;1985−2018年,岸线长度增加了10.40 km,陆域面积增加了52.84 km2;海州湾岸线以人工岸线为主,且比重日渐增大,从1985年的47.90%到2018年的70.88%,前中期的沿海围垦养殖及后期的围海造陆是海岸线变迁的主要驱动力;其终点变化速率为26.09 m/a,净海岸线变化为155.12 m,记录增加总横断面在各个时期均大于50%,岸线变迁最剧烈的区域为新沭河−高公岛段,陆域增长点在于赣榆新城、连云新城建设和连云港港口建设。Abstract: Six representative Landsat remote sensing images from 1985 to 2018 are selected in this paper. Using the digital coastline analysis system to quantitatively analyze the shoreline changes in the Haizhou Bay by using the area method and the baseline method, and to classify and the driving force analysis. The results show that the coastline of the Haizhou Bay moving towards the sea for more than 30 years, and the proportion of the growth shoreline is generally in a growing trend, except for a brief decrease in 2005−2009. From 1985 to 2018, the shoreline length increased by 10.40 km and the land area increased by 52.84 km2. The artificial coastline is the dominant type in the Haizhou Bay, and its proportion is increasing. From 47.90% in 1985 to 70.88% in 2018, coastal cofferdam farming in the early and mid-term and post-sea reclamation are the main driving forces for coastline change. The endpoint change rate was 26.09 m/a, the net coastline change was 155.12 m, and the recorded total cross-section was greater than 50% in each period. The most severe area of the coastline change was from the Xinshu Estuary to Gaogong Island. In the island section, the growth of land area lies in the construction of Ganyu City, Lianyun New City and Lianyungang Port.
-
Key words:
- Haizhou Bay /
- remote sensing /
- digital shoreline analysis system /
- coastline /
- spatial-temporal change
-
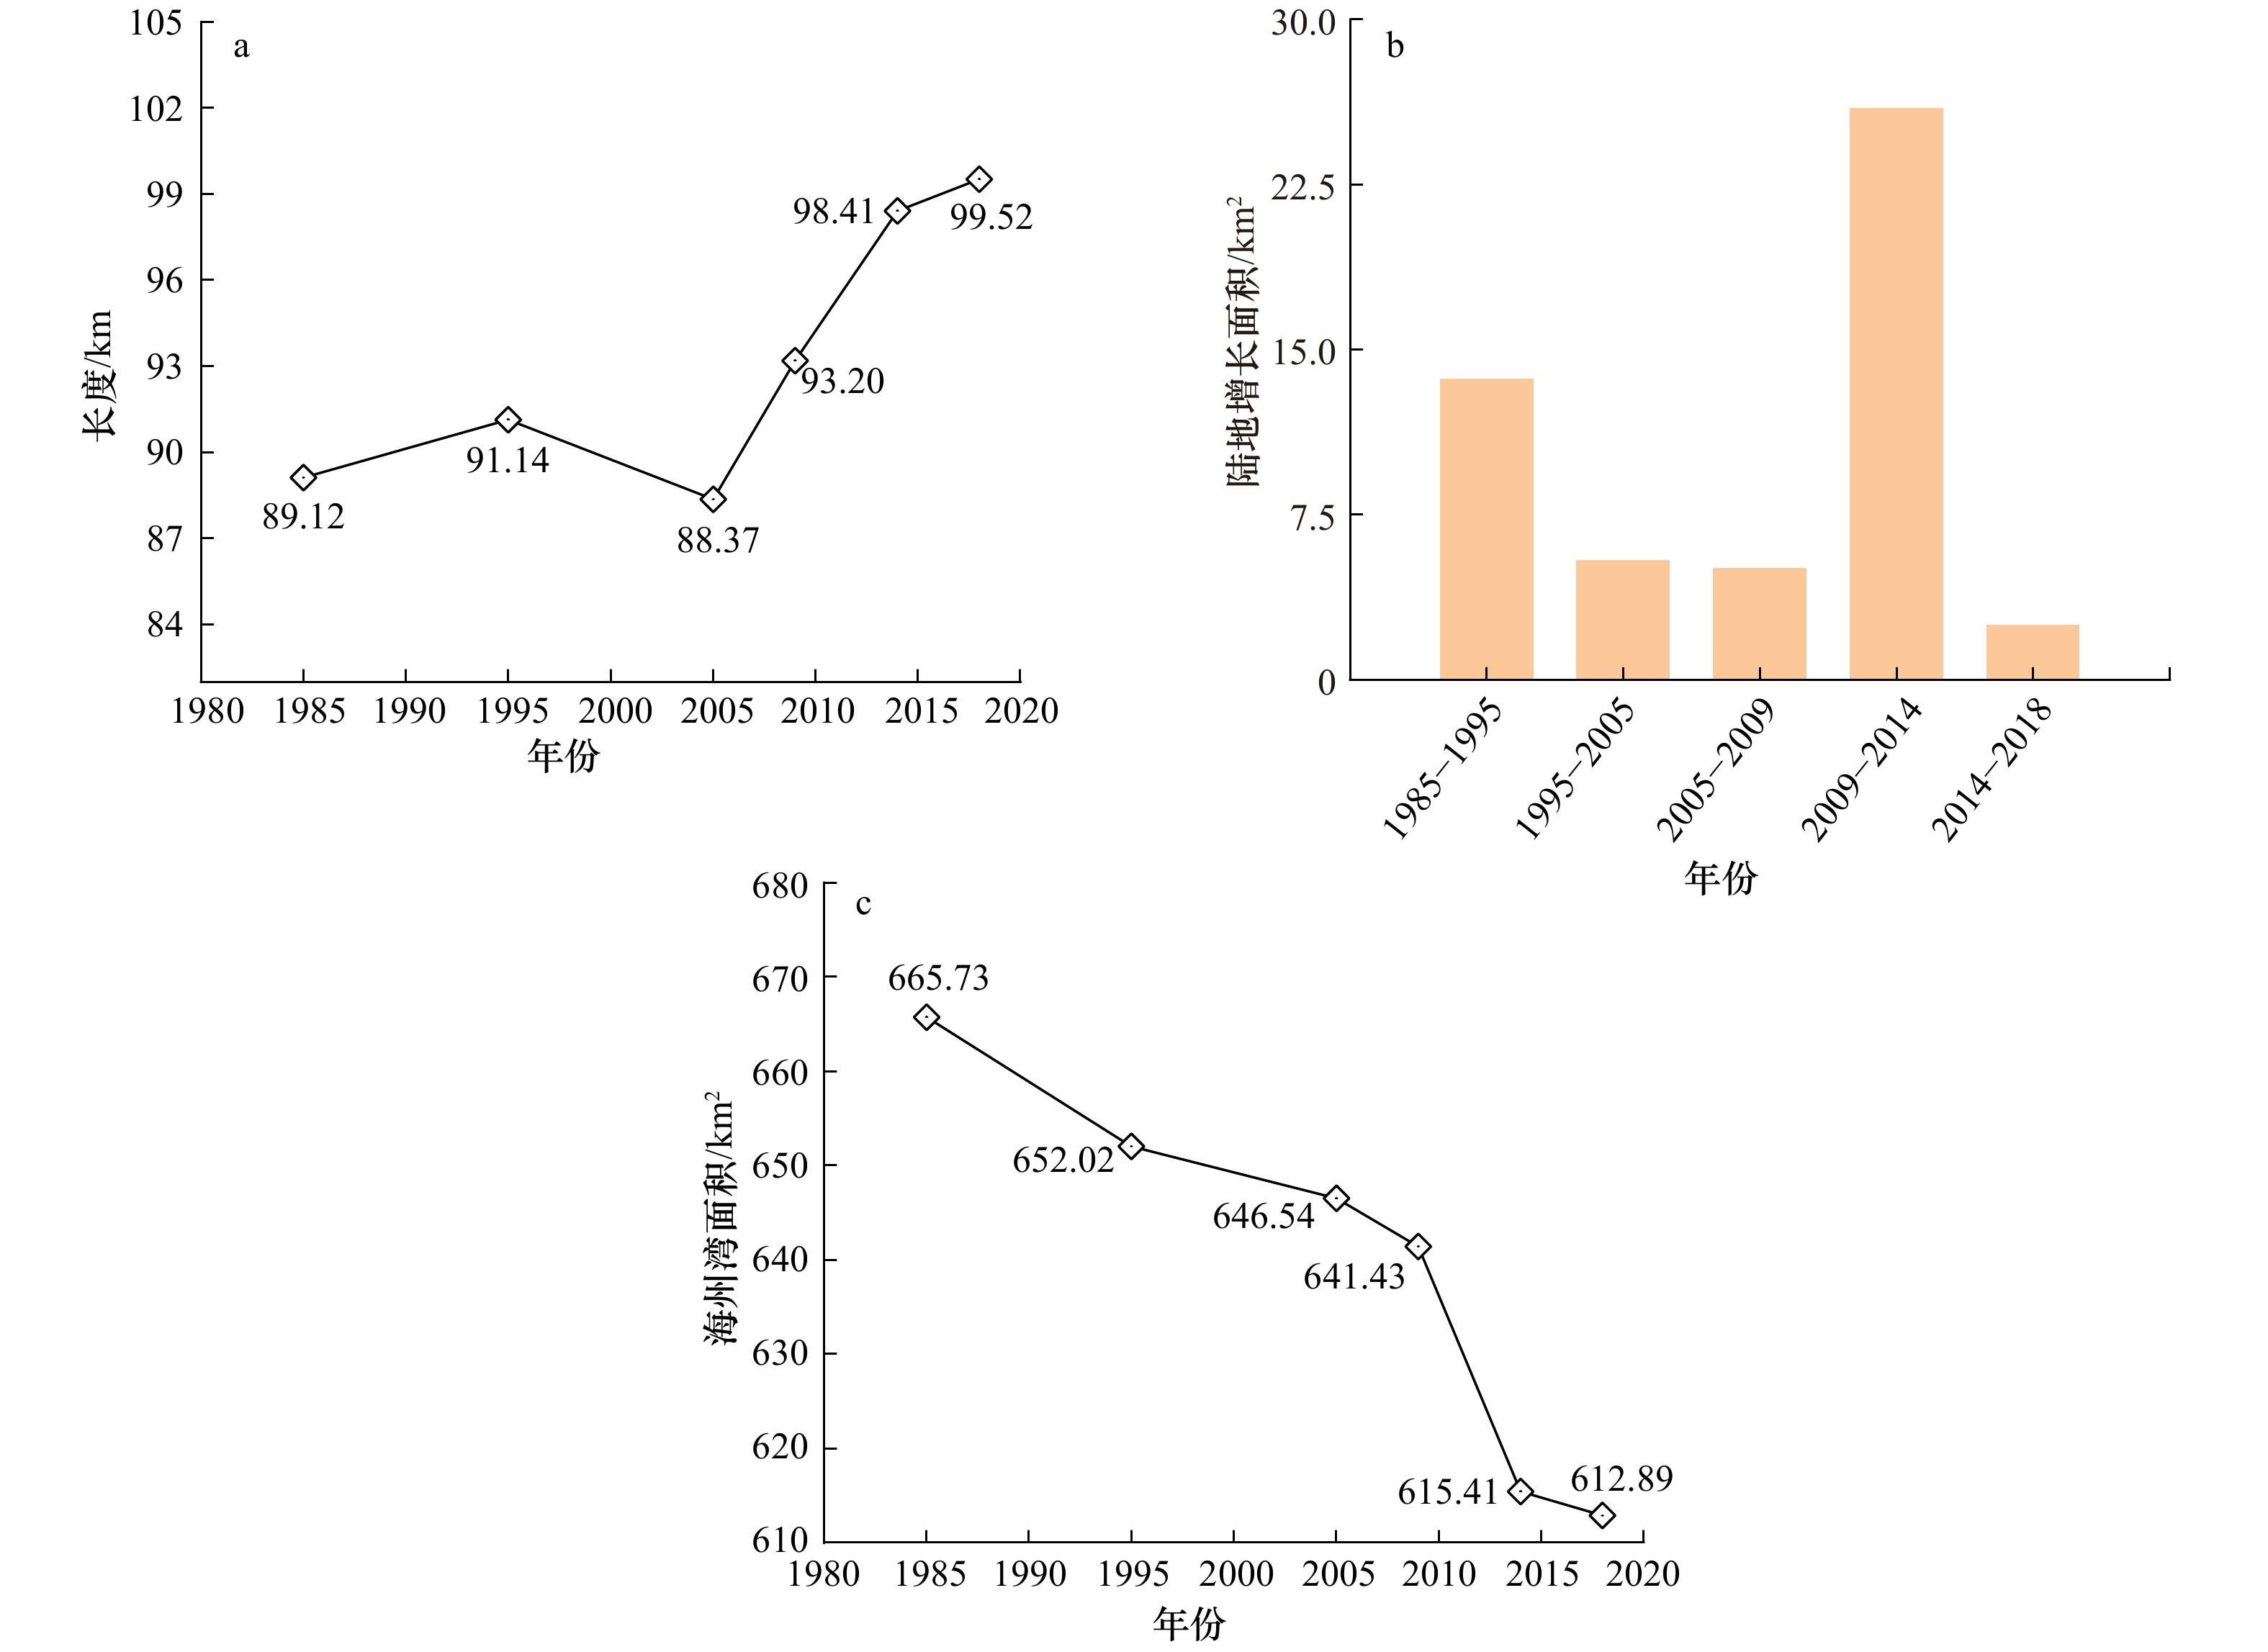
图 2 海州湾岸线不同时期海岸线长度、陆地增长面积及海州湾面积变化过程
Fig. 2 The length of the Haizhou Bay coastline, the change of land growth area and the change process of the Haizhou Bay area
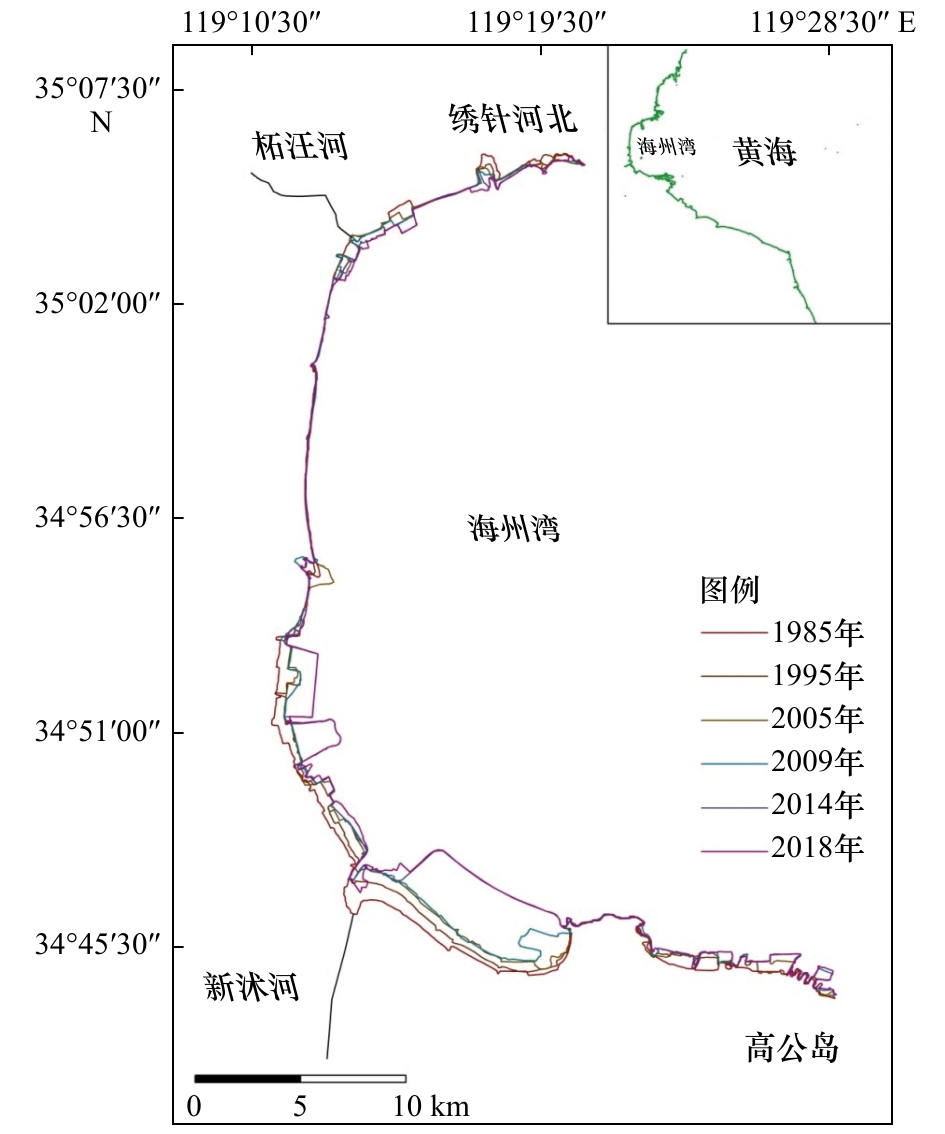
图 3 1985−2018年海州湾岸线变迁
Fig. 3 The coastline changes of the Haizhou Bay from 1985 to 2018

图 4 1985−2018年海州湾不同时期的岸线终点变化速率及其分布
Fig. 4 Change rate and distribution of shoreline endpoints of the Haizhou Bay in different periods from 1985 to 2018
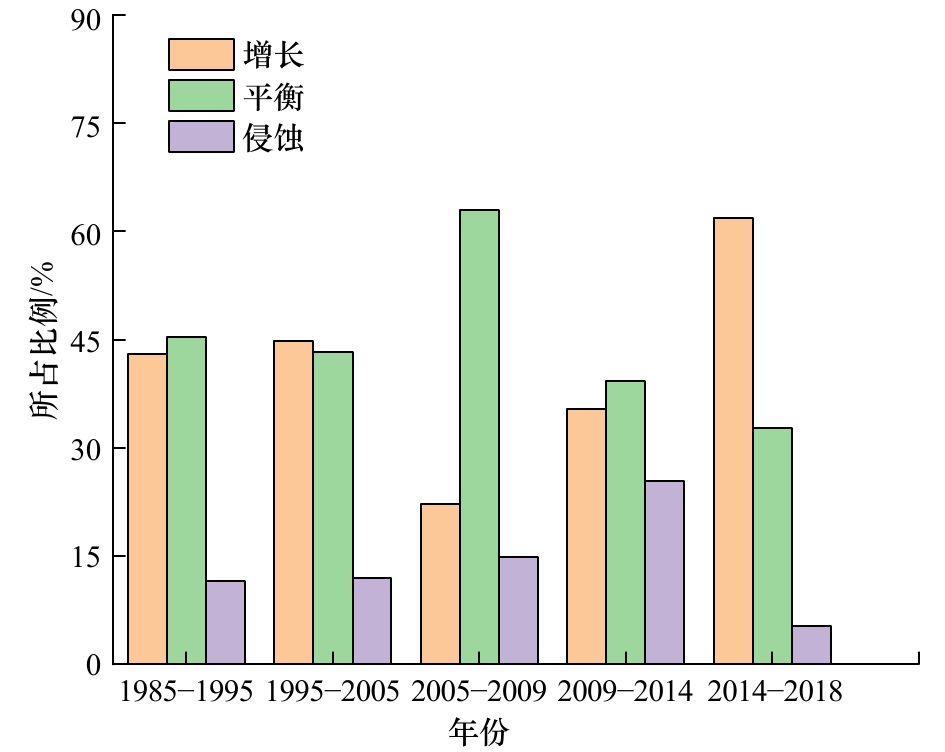
图 5 1985−2018年海州湾增长、平衡、侵蚀岸线所占比例
Fig. 5 Proportion of the Haizhou Bay growth, balanced and eroded shoreline from 1985 to 2018
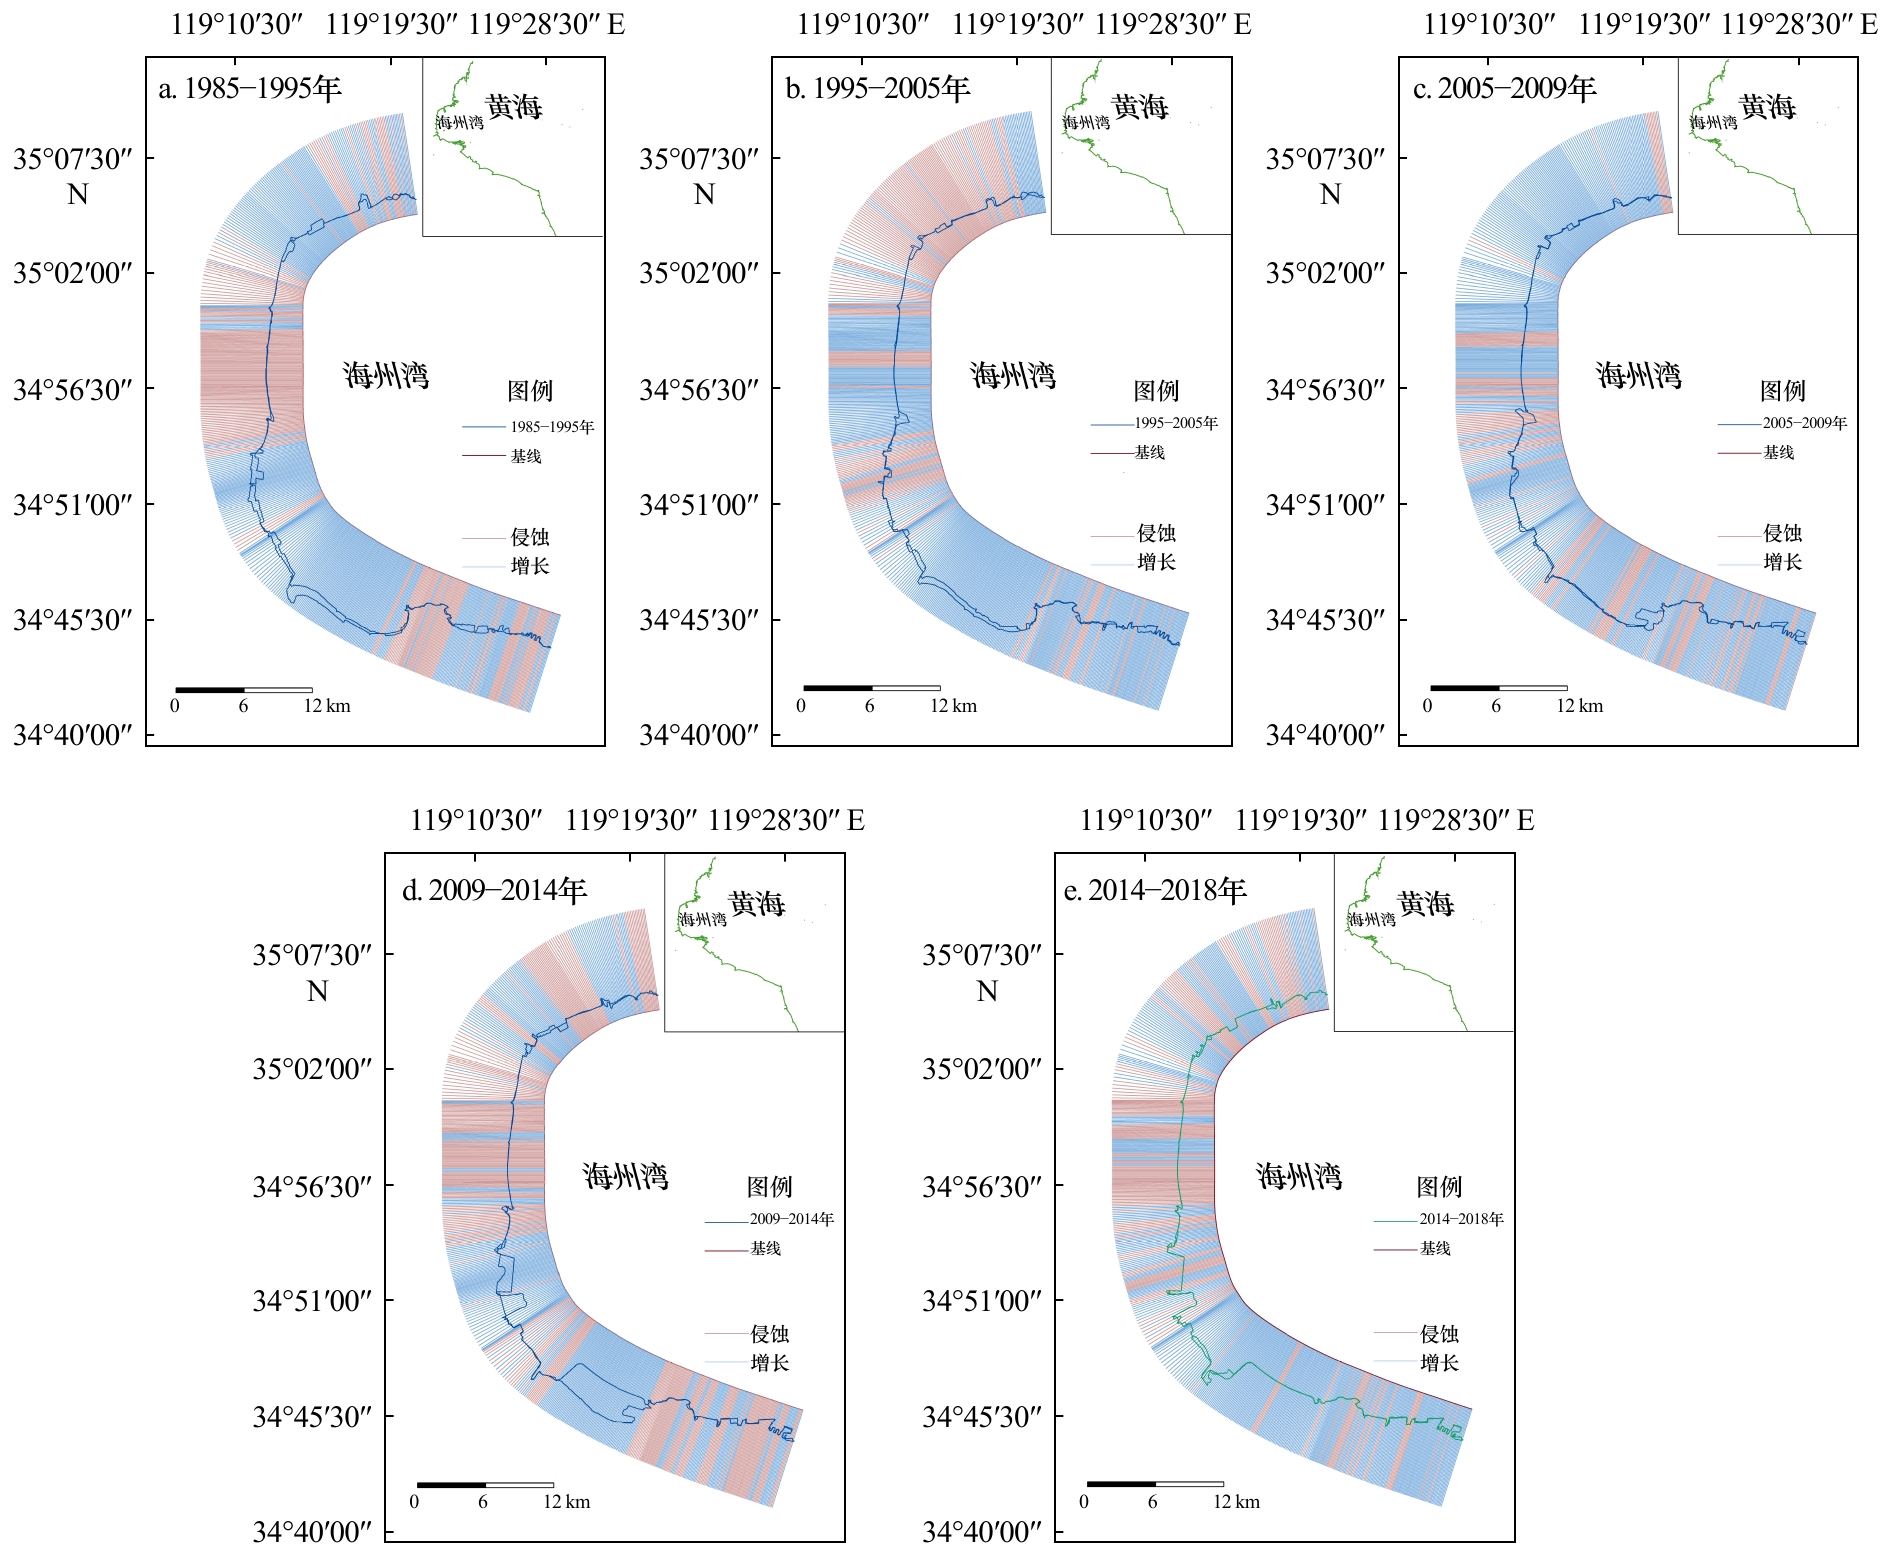
图 6 1985−2018年海州湾不同时期的净海岸线变化及其分布
Fig. 6 Changes and distribution of net coastline of the Haizhou Bay in different periods from 1985 to 2018
表 1 遥感影像信息
Tab. 1 Remote sensing image information
序号 卫星 传感器类型 轨道号/行号 获取日期 空间分辨率/m 条带 1A Landsat4-5 TM 120/036 1985年3月23日 30 无 2A Landsat5 TM 120/036 1995年4月20日 30 无 3A Landsat7 ETM+ 120/036 2005年3月6日 30 有 4A Landsat7 ETM+ 120/036 2009年5月4日 30 有 5A Landsat8 OLI_TIRS 120/036 2014年4月24日 30 无 6A Landsat8 OLI_TIRS 120/036 2018年4月19日 30 无  下载: 导出CSV
表 2 海州湾海岸线长度统计
Tab. 2 Coastal length of the Haizhou Bay
海岸线长度 年份 1985 1995 2005 2009 2014 2018 自然岸线 砂质岸线/km 20.72 19.84 17.98 15.99 16.88 14.25 基岩岸线/km 8.85 7.80 6.41 4.90 4.67 5.08 淤泥质岸线/km 4.56 1.77 4.54 2.68 2.03 1.08 河口岸线/km 7.09 3.92 4.37 6.64 6.49 8.23 小计/km 41.22 33.33 33.30 30.21 30.07 28.64 人工岸线/km 47.90 57.81 55.07 62.99 68.34 70.88 合计/km 89.12 91.14 88.37 93.20 98.41 99.52
下载: 导出CSV
表 3 海州湾岸线变化趋势
Tab. 3 Change trend of the Haizhou Bay shoreline
年份 研究区域 垂线范围 岸线
长度
/km平均变化
EPR/m·a−1平均变化
EPR/m·a−1最大增长
EPR/m·a−1最大侵蚀
EPR/m·a−1平均增长
NSM/m平均侵蚀
NSM/m记录整体
增加总垂线数
/百分比EPR记录整体
侵蚀总垂线数
/百分比EPR1985−1995年 绣针河北−柘汪河 1~100 21.40 11.37 18.65 123.73 −48.25 187.70 −93.71 319/58.32 228/41.68 柘汪河−新沭河 101~337 32.60 16.22 116.36 −58.01 413.37 −45.25 新沭河−高公岛 338~547 35.13 24.83 173.55 −25.79 407.54 −45.01 1995−2005年 绣针河北−柘汪河 1~100 14.60 −0.15 11.62 79.25 −47.97 263.56 −93.59 359/65.75 187/34.25 柘汪河−新沭河 101~337 38.10 5.43 117.85 −63.19 136.33 −83.96 新沭河−高公岛 338~547 38.44 24.22 74.48 −17.14 278.32 −61.34 2005−2009年 绣针河北−柘汪河 1~100 22.80 18.62 23.25 115.39 −67.91 93.54 −82.77 421/77.11 125/22.89 柘汪河−新沭河 101~337 30.40 0.92 141.29 −274.11 72.00 −181.34 新沭河−高公岛 338~547 35.17 50.65 441.43 −112.57 300.08 −55.24 2009−2014年 绣针河北−柘汪河 1~100 22.10 21.41 79.20 131.39 −41.13 226.67 −39.90 277/50.64 270/49.36 柘汪河−新沭河 101~337 30.20 46.06 420.29 −33.94 540.23 −26.24 新沭河−高公岛 338~547 40.90 144.13 576.03 −73.13 1335.68 −52.14 2014−2018年 绣针河北−柘汪河 1~100 26.30 9.20 9.02 237.01 −13.25 64.36 −12.69 362/66.54 182/33.46 柘汪河−新沭河 101~337 35.70 5.81 91.07 −235.31 70.72 −17.76 新沭河−高公岛 338~547 36.41 12.57 215.65 −32.18 62.03 50.75
下载: 导出CSV
-
[1] 王颖, 季小梅. 中国海陆过渡带——海岸海洋环境特征与变化研究[J]. 地理科学, 2011, 31(2): 129−135.Wang Ying, Ji Xiaomei. Environmental characteristics and changes of coastal ocean as land-ocean transitional zone of China[J]. Scientia Geographica Sinica, 2011, 31(2): 129−135. [2] 孙荣章. 突破海州湾经济发展探析[J]. 海洋开发与管理, 2006, 23(2): 37−43. doi: 10.3969/j.issn.1005-9857.2006.02.002Sun Rongzhang. Analysis on the innovative economic development of Haizhou Bay[J]. Ocean Development and Management, 2006, 23(2): 37−43. doi: 10.3969/j.issn.1005-9857.2006.02.002 [3] 巢子豪, 高一博, 谢宏全, 等. 1984~2012年海州湾海岸线时空演变研究[J]. 海洋科学, 2016, 40(6): 95−100. doi: 10.11759/hykx20150514001Chao Zihao, Gao Yibo, Xie Hongquan, et al. Study of temporal and spatial evolutions of coastline of the Haizhou Bay from 1984 to 2012[J]. Marine Sciences, 2016, 40(6): 95−100. doi: 10.11759/hykx20150514001 [4] 刘鹏, 王庆, 战超, 等. 基于DSAS和FA的1959-2002年黄河三角洲海岸线演变规律及影响因素研究[J]. 海洋与湖沼, 2015, 46(3): 585−594. doi: 10.11693/hyhz20141200343Liu Peng, Wang Qing, Zhan Chao, et al. Quantitative analysis of coastline change in the Yellow River delta from 1959 to 2002[J]. Oceanologia et Limnologia Sinica, 2015, 46(3): 585−594. doi: 10.11693/hyhz20141200343 [5] David T I, Mukesh M V, Kumaravel S, et al. Long-and short-term variations in shore morphology of Van Island in gulf of Mannar using remote sensing images and DSAS analysis[J]. Arabian Journal of Geosciences, 2016, 9(20): 756. doi: 10.1007/s12517-016-2772-4 [6] Mahapatra M, Ratheesh R, Rajawat A S. Shoreline change analysis along the coast of South Gujarat, India, using digital shoreline analysis system[J]. Journal of the Indian Society of Remote Sensing, 2014, 42(4): 869−876. doi: 10.1007/s12524-013-0334-8 [7] 狄欢, 张硕, 钱卫国. 海州湾海洋牧场区表层沉积物主要理化状况及其相关性分析[J]. 大连海洋大学学报, 2013, 28(4): 406−412. doi: 10.3969/j.issn.2095-1388.2013.04.017Di Huan, Zhang Shuo, Qian Weiguo. The main physical and chemical characterization and correlation of surface sediment at marine ranching area in Haizhou Bay[J]. Journal of Dalian Ocean University, 2013, 28(4): 406−412. doi: 10.3969/j.issn.2095-1388.2013.04.017 [8] 章守宇, 张焕君, 焦俊鹏, 等. 海州湾人工鱼礁海域生态环境的变化[J]. 水产学报, 2006, 30(4): 475−480.Zhang Shouyu, Zhang Huanjun, Jiao Junpeng, et al. Change of ecological environment of artificial reef waters in Haizhou Bay[J]. Journal of Fisheries of China, 2006, 30(4): 475−480. [9] 孙晓宇, 吕婷婷, 高义, 等. 2000-2010年渤海湾岸线变迁及驱动力分析[J]. 资源科学, 2014, 36(2): 413−419.Sun Xiaoyu, Lü Tingting, Gao Yi, et al. Driving force analysis of Bohai Bay coastline change from 2000 to 2010[J]. Resources Science, 2014, 36(2): 413−419. [10] 李梅娜, 陈小英, 刘金庆, 等. 基于遥感的威海岸线变迁分析[J]. 海洋地质与第四纪地质, 2016, 36(6): 79−84.Li Meina, Chen Xiaoying, Liu Jinqing, et al. Coastline change in Weihai based on remote sensing[J]. Marine Geology & Quaternary Geology, 2016, 36(6): 79−84. [11] 张晓祥, 王伟玮, 严长清, 等. 南宋以来江苏海岸带历史海岸线时空演变研究[J]. 地理科学, 2014, 34(3): 344−351.Zhang Xiaoxiang, Wang Weiwei, Yan Changqing, et al. Historical coastline spatio-temporal evolution analysis in Jiangsu coastal area during the past 1 000 years[J]. Scientia Geographica Sinica, 2014, 34(3): 344−351. [12] 高义, 王辉, 苏奋振, 等. 中国大陆海岸线近30 a的时空变化分析[J]. 海洋学报, 2013, 35(6): 31−42.Gao Yi, Wang Hui, Su Fenzhen, et al. The analysis of spatial and temporal changes of the continental coastlines of China in recent three decades[J]. Haiyang Xuebao, 2013, 35(6): 31−42. [13] 杨磊, 李加林, 袁麒翔, 等. 中国南方大陆海岸线时空变迁[J]. 海洋学研究, 2014, 32(3): 42−49. doi: 10.3969/j.issn.1001-909X.2014.03.006Yang Lei, Li Jialin, Yuan Qixiang, et al. Spatial-temporal changes of continental coastline in southern China[J]. Journal of Marine Sciences, 2014, 32(3): 42−49. doi: 10.3969/j.issn.1001-909X.2014.03.006 [14] 毛志华, 黄海清, 朱乾坤, 等. 利用海岸线的海洋遥感图像控制点(GCP)自动匹配法[J]. 海洋学报, 2000, 22(5): 41−50.Mao Zhihua, Huang Haiqing, Zhu Qiankun, et al. Automatic location of GCPs at sea[J]. Haiyang Xuebao, 2000, 22(5): 41−50. [15] 孙伟富, 马毅, 张杰, 等. 不同类型海岸线遥感解译标志建立和提取方法研究[J]. 测绘通报, 2011(3): 41−44.Sun Weifu, Ma Yi, Zhang Jie, et al. Study of remote sensing interpretation keys and extraction technique of different types of shoreline[J]. Bulletin of Surveying and Mapping, 2011(3): 41−44. [16] 殷飞, 田林亚, 王涛, 等. 海岸线遥感解译和提取方法研究[J]. 地理空间信息, 2018, 16(8): 64−66, 83. doi: 10.3969/j.issn.1672-4623.2018.08.019Yin Fei, Tian Linya, Wang Tao, et al. Research on coastline remote sensing interpretation and extraction technique[J]. Geospatial Information, 2018, 16(8): 64−66, 83. doi: 10.3969/j.issn.1672-4623.2018.08.019 [17] 张祥国. 海州湾临洪河口淤进与弧形海岸形态发育的相关性[D]. 南京: 南京师范大学, 2006.Zhang Xiangguo. Correlation between sedimentation in Linhong Estuary of Haizhou Bay and morphological development of curved coasts[D]. Nanjing: Nanjing Normal University, 2006. [18] 常立侠, 冼嘉俊, 陈昌亮, 等. 海岛岸线界定标准及方法初探[J]. 海岸工程, 2015, 34(2): 89−96. doi: 10.3969/j.issn.1002-3682.2015.02.011Chang Lixia, Xian Jiajun, Chen Changliang, et al. A preliminary study on the standard and method of island coastline definition[J]. Coastal Engineering, 2015, 34(2): 89−96. doi: 10.3969/j.issn.1002-3682.2015.02.011 [19] 孙新轩, 吕蓬, 李磊. 利用最小二乘法检测缓冲区海岸线变化研究[J]. 信息工程大学学报, 2014, 15(1): 12−16. doi: 10.3969/j.issn.1671-0673.2014.01.003Sun Xinxuan, Lü Peng, Li Lei. Research on detecting buffer shoreline using the least squares method[J]. Journal of Information Engineering University, 2014, 15(1): 12−16. doi: 10.3969/j.issn.1671-0673.2014.01.003 [20] 陈晓英, 张杰, 马毅. 近40年来海州湾海岸线时空变化分析[J]. 海洋科学进展, 2014, 32(3): 324−334. doi: 10.3969/j.issn.1671-6647.2014.03.004Chen Xiaoying, Zhang Jie, Ma Yi. Analysis of the spatial and temporal changes of the coastline in the Haizhou Bay during the past 40 years[J]. Advances in Marine Science, 2014, 32(3): 324−334. doi: 10.3969/j.issn.1671-6647.2014.03.004 [21] Nassar K, Fath H, Mahmod W E, et al. Automatic detection of shoreline change: case of North Sinai Coast, Egypt[J]. Journal of Coastal Conservation, 2018, 22(6): 1057−1083. doi: 10.1007/s11852-018-0613-1 [22] Jana A, Biswas A, Maiti S, et al. Shoreline changes in response to sea level rise along Digha Coast, Eastern India: an analytical approach of remote sensing, GIS and statistical techniques[J]. Journal of Coastal Conservation, 2014, 18(3): 145−155. doi: 10.1007/s11852-013-0297-5 [23] Addo K A. Shoreline morphological changes and the human factor. Case study of Accra Ghana[J]. Journal of Coastal Conservation, 2013, 17(1): 85−91. doi: 10.1007/s11852-012-0220-5 [24] Bheeroo R A, Chandrasekar N, Kaliraj S, et al. Shoreline change rate and erosion risk assessment along the Trou Aux Biches–Mont Choisy beach on the northwest coast of Mauritius using GIS-DSAS technique[J]. Environmental Earth Sciences, 2016, 75(5): 444. doi: 10.1007/s12665-016-5311-4 [25] 丁小松, 单秀娟, 陈云龙, 等. 基于数字化海岸分析系统(DSAS)的海岸线变迁速率研究: 以黄河三角洲和莱州湾海岸线为例[J]. 海洋通报, 2018, 37(5): 565−575. doi: 10.11840/j.issn.1001-6392.2018.05.010Ding Xiaosong, Shan Xiujuan, Chen Yunlong, et al. Study on the change rate of shoreline based on Digital Coastal Analysis System (DSAS): taking the shoreline of the Yellow River Delta and Laizhou Bay as an example[J]. Marine Science Bulletin, 2018, 37(5): 565−575. doi: 10.11840/j.issn.1001-6392.2018.05.010 [26] 吕京福, 印萍, 边淑华, 等. 海岸线变化速率计算方法及影响要素分析[J]. 海洋科学进展, 2003, 21(1): 51−59. doi: 10.3969/j.issn.1671-6647.2003.01.006Lü Jingfu, Yin Ping, Bian Shuhua, et al. Selection of methods for calculating shoreline change rate and analysis of affecting factor[J]. Advances in Marine Science, 2003, 21(1): 51−59. doi: 10.3969/j.issn.1671-6647.2003.01.006 [27] Baral R, Pradhan S, Samal R N, et al. Shoreline change analysis at chilika lagoon coast, India using digital shoreline analysis system[J]. Journal of the Indian Society of Remote Sensing, 2018, 46(10): 1637−1644. doi: 10.1007/s12524-018-0818-7 [28] Sytnik O, Del Río L, Greggio N, et al. Historical shoreline trend analysis and drivers of coastal change along the Ravenna coast, NE Adriatic[J]. Environmental Earth Sciences, 2018, 77(23): 779. doi: 10.1007/s12665-018-7963-8 -

计量
- 文章访问数: 509
- HTML全文浏览量: 90
- PDF下载量: 39
- 被引次数: 0
