

Mesoscale eddies energy characteristic in the Kuroshio Extension and north Pacific subtropical countercurrent region
-
摘要: 不同科研工作者对黑潮延伸体区域和北太平洋副热带逆流区域的中尺度现象进行过不同的研究,但对两区域中尺度涡进行统一比较分析的工作较少。因此,本文利用11年的卫星高度计海表面高度异常资料分别对这两个区域的中尺度现象特征及其能量变化过程进行系统的分析和对比。研究发现,两区域的气旋涡与反气旋涡在分布、振幅、能量和寿命上均存在差异;进一步的动能谱分析和能量串级讨论发现:两区域的动能谱密度虽均集中在2×10⁻³~4×10⁻³ 周/km的波数域上,但黑潮延伸体区域大部分涡旋信号分布在经向上,而北太平洋副热带逆流区域主要分布在纬向上,这可能与两区域中尺度涡能量来源的不同有关。由于两区域在2×10–3~3×10–3 周/km的波数域上动能转移项以负值为主,这说明两区域在此波数域上均存在能量源,并且发生能量逆向串级。Abstract: Different researchers have studied mesoscale phenomena of Kuroshio Extension (KE) and north Pacific subtropical countercurrent (STCC) area independently, but they have never made comparisons and analysis of the phenomenon in the two areas. In this paper, the mesoscale phenomenon and the change process of energy in these two regions are unified analyzed and compared by using the 11 years data of sea surface anomaly of altimeter. Firstly, the ‘Okubo-Weiss algorithm’ is used to detect and analyze the eddy, and concluded that there are differences in distribution, amplitude, energy and lifetime between the cyclonic eddies and the anticyclonic eddies in these two regions. Secondly, the kinetic energy spectrum and energy cascade of mesoscale eddies in the two regions are discussed by using the method of kinetic energy spectrum analysis. The kinetic energy spectral density of both regions is concentrated in 2×10⁻³ circle/km to 4×10⁻³ circle/km. The propagation direction of most of mesoscale eddies in the KE region are more meridionally, while that in the STCC region are more zonally. The kinetic energy transfer terms of the two regions are mainly negative in the range of 2×10⁻³ circle/km to 3×10⁻³ circle/km, which implied that there is an energy source in this wavenumber, meanwhile, there is an inverse cascade.
-
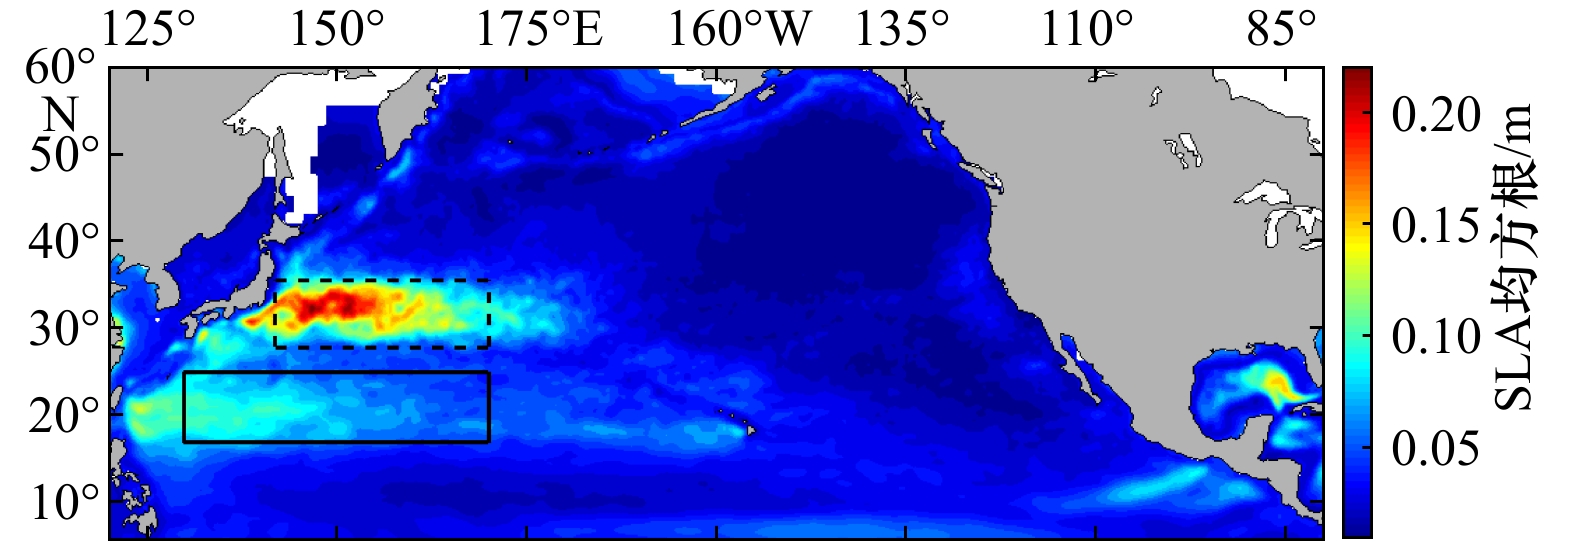
图 1 利用AVISO北太平洋区域2002年1月至2012年12月经过180 d高通滤波的海表面高度异常(SLA)的均方根分布
虚线框表示黑潮延伸体区域,实线框表示北太平洋副热带逆流区域
Fig. 1 The root mean square of sea level anomaly (SLA) based on the 180 d of high-pass filtered AVISO data in the north Pacific from January 2002 to December 2012
The dotted line frame and the solid line frame represent the Kuroshio Extension and north Pacific subtropical countercurrent region, respectively
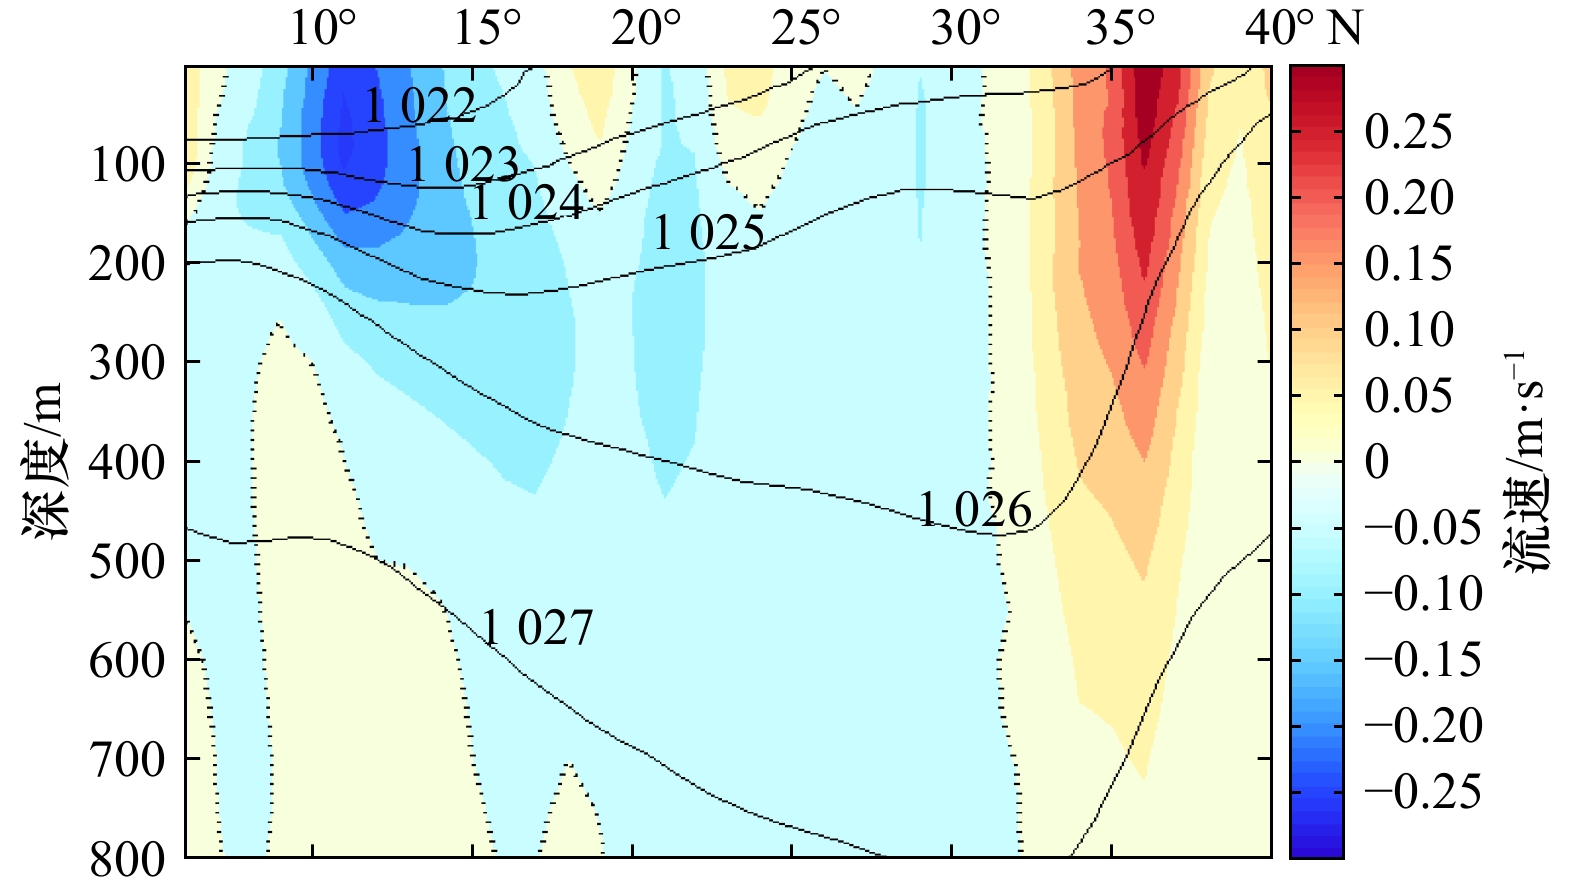
图 2 利用2004年1月至2011年12月的Argo温盐数据得出的等位势密度线(实线)和纬向地转流速(彩色背景)沿150°E的纬度–深度分布
Fig. 2 The latitude-depth distribution along 150°E of isopotential density line (solid line) and zonal geostrophic velocity (background) obtained from the Argo temperature and salt data from January 2004 to December 2011
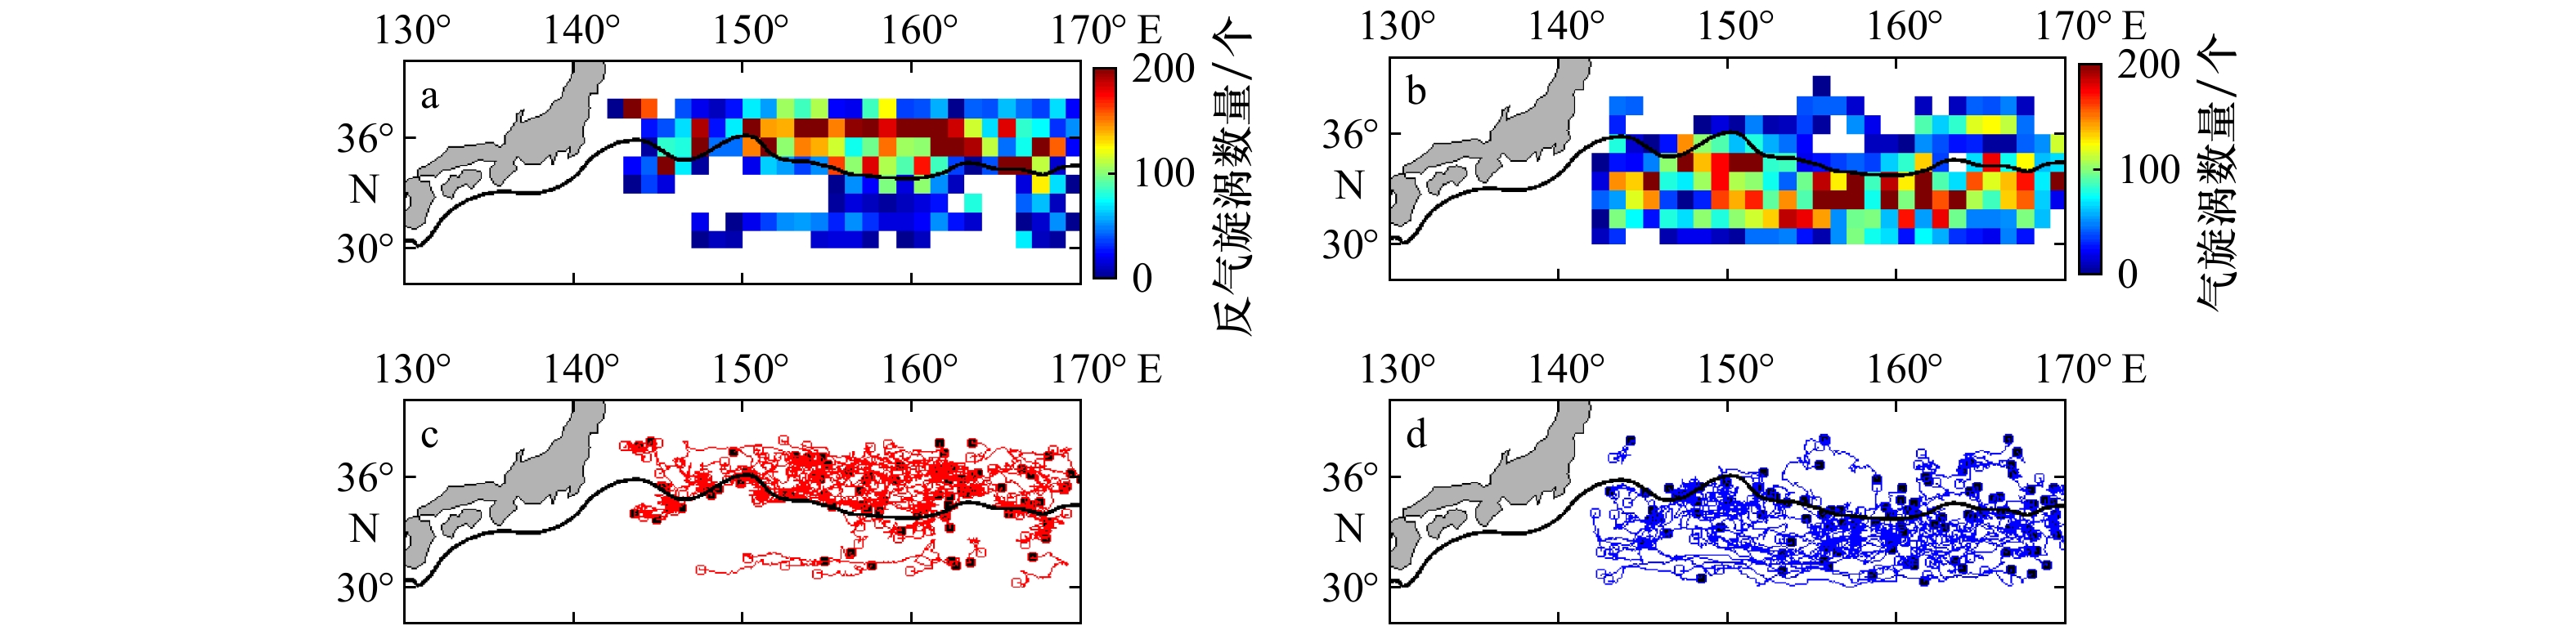
图 3 KE区域分别利用欧拉方法和拉格朗日方法统计的生命周期超12周的反气旋暖涡和气旋冷涡的数量和轨迹分布
a和b分别表示用欧拉方法统计的反气旋涡和气旋涡的数量分布;c和d分别表示用拉格朗日方法统计的反气旋涡和气旋涡的轨迹;实心圆表示涡旋轨迹的起始点,空心圆表示涡旋轨迹的终点;黑色粗线表示11年平均的黑潮延伸体的主轴
Fig. 3 The number and track distribution of the anticyclone eddies and cyclone eddies with the lifetime more than 12 weeks in KE region by using Euler and Lagrange methods, respectively
a and b represent the number distribution of anticyclone eddies and cyclone eddies calculated by Euler method. c and d represent the trajectories of anticyclone eddies and cyclone eddies calculated by Lagrange method. The solid circle and the hollow circle represent the starting point and the end point of the orbits of eddies. The black line represents the main axis of the Kuroshio Extension
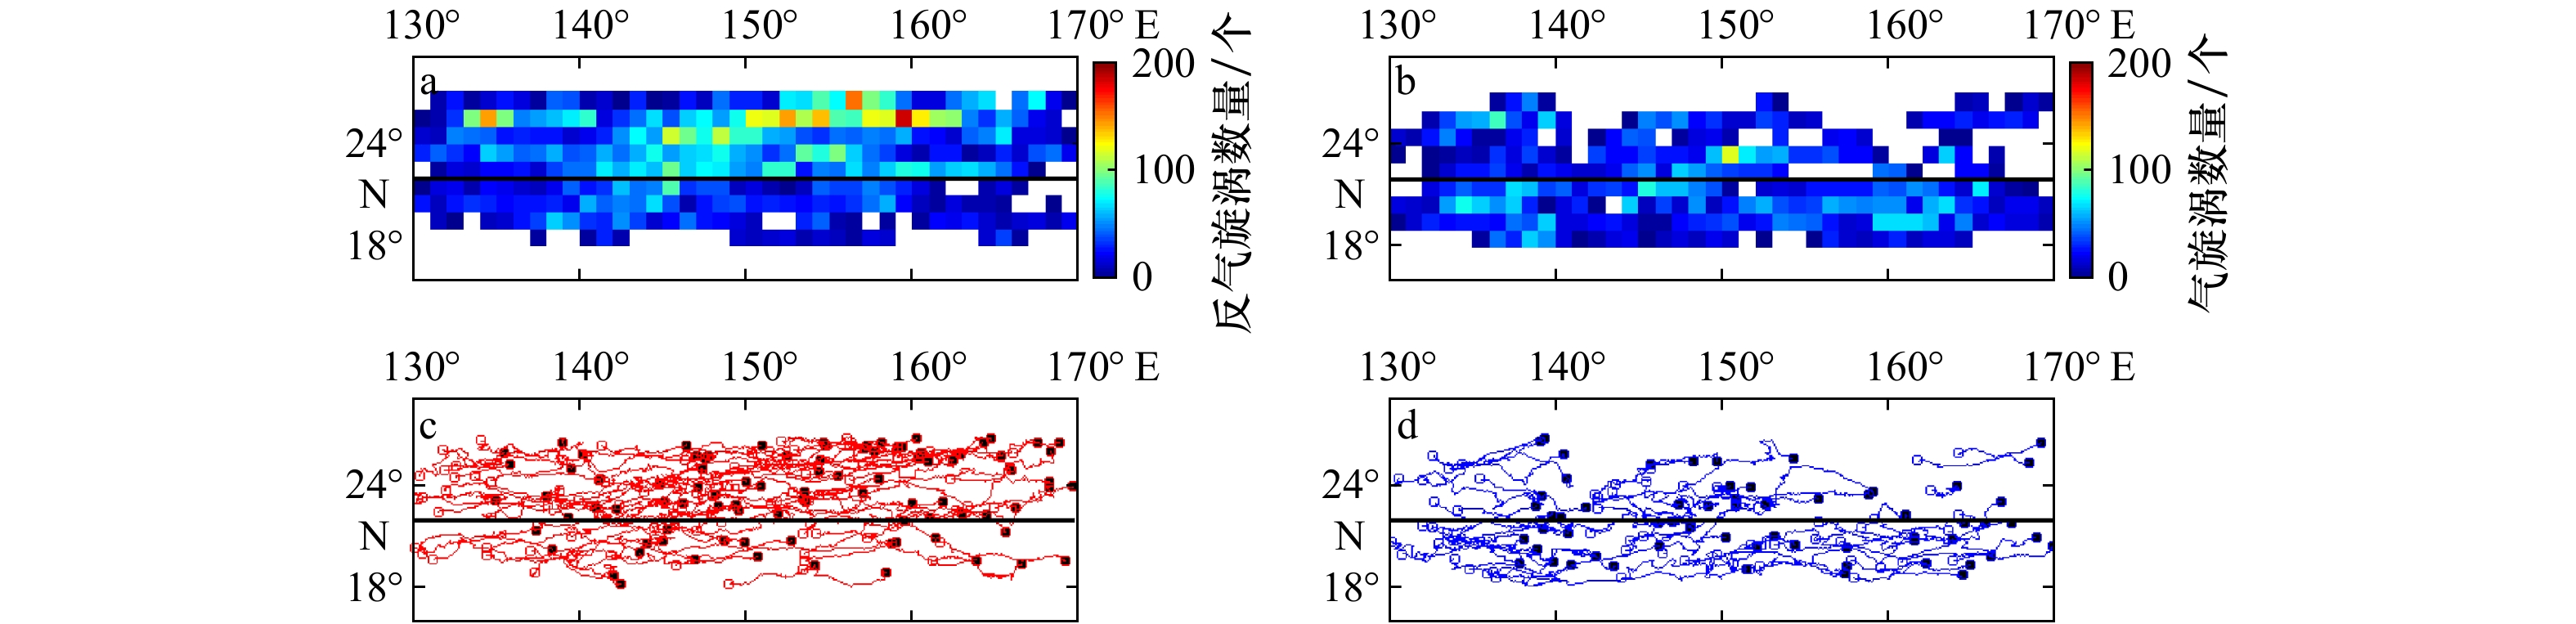
图 4 STCC区域分别利用欧拉方法和拉格朗日方法统计的生命周期超12周的反气旋暖涡和气旋冷涡的数量和轨迹分布
a和b分别表示用欧拉方法统计的反气旋涡和气旋涡的数量分布;c和d分别表示用拉格朗日方法统计的反气旋涡和气旋涡的轨迹;实心圆表示涡旋轨迹的起始点,空心圆表示涡旋轨迹的终点;黑色粗线为22°N
Fig. 4 The number and track distribution of the anticyclone eddies and cyclone eddies with the lifetime more than 12 weeks in STCC region by using Euler method and Lagrange method, respectively
a and b represent the number distribution of anticyclone eddies and cyclone eddies calculated by Euler method. c and d represent the trajectories of anticyclone eddies and cyclone eddies calculated by Lagrange method. The solid circle and the hollow circle represent the starting point and the end point of the orbits of eddies. The black line is 22°N
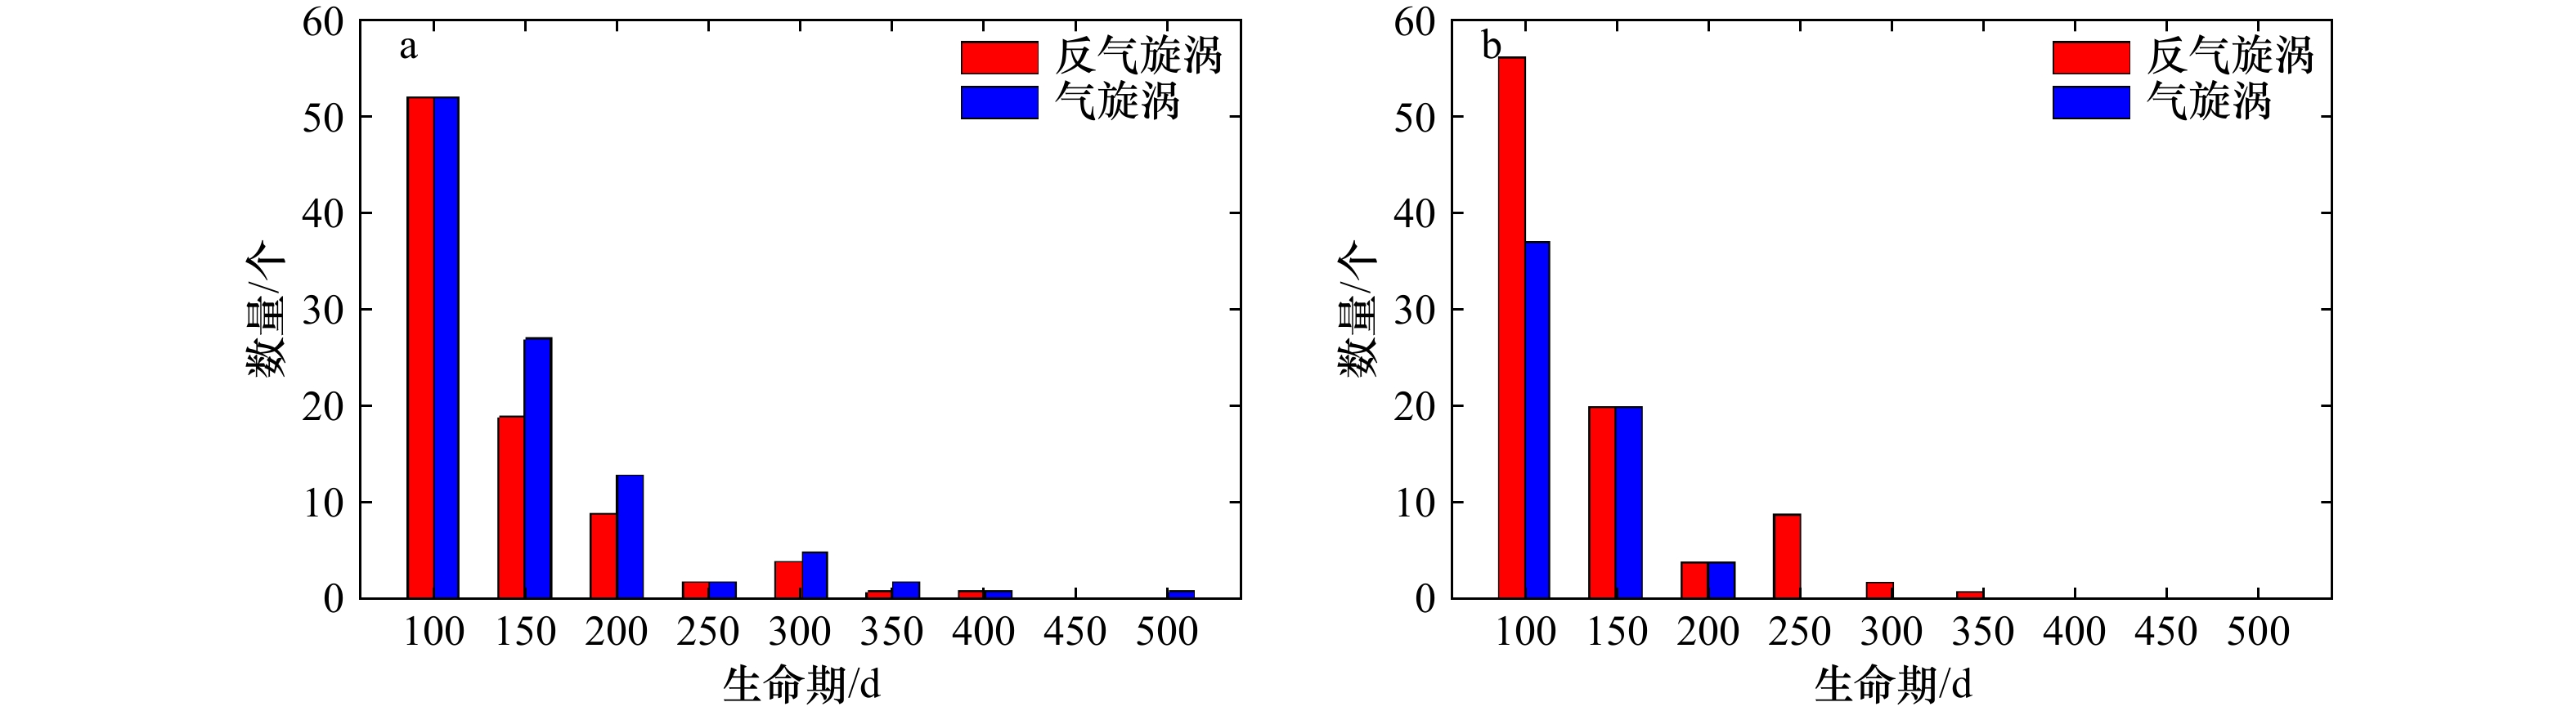
图 5 KE区域(a)和STCC区域(b)生命周期超12周的反气旋涡和气旋涡的生命周期直方图
Fig. 5 The histogram of the lifetime of the anticyclone eddies and cyclone eddies over 12 weeks in KE region (a) and STCC region (b)

图 6 KE区域生命周期超过12周的反气旋涡和气旋涡的半径、振幅和涡旋动能(EKE)的分布
a、c和e分别表示反气旋涡的半径、振幅和EKE的分布;b、d和f分别表示气旋涡的半径、振幅和EKE的分布;黑色粗线表示KE的主轴
Fig. 6 The radius, amplitude and eddy kinetic energy (EKE) distribution of the anticyclone eddies and cyclone eddies with the life cycle over 12 weeks in KE region
a, c and e are represent the radius, amplitude and EKE distribution of the anticyclone eddies, respectively. b, d and f are represent the radius, amplitude and EKE distribution of the cyclone eddies, respectively. The black line represents the main axis of the KE
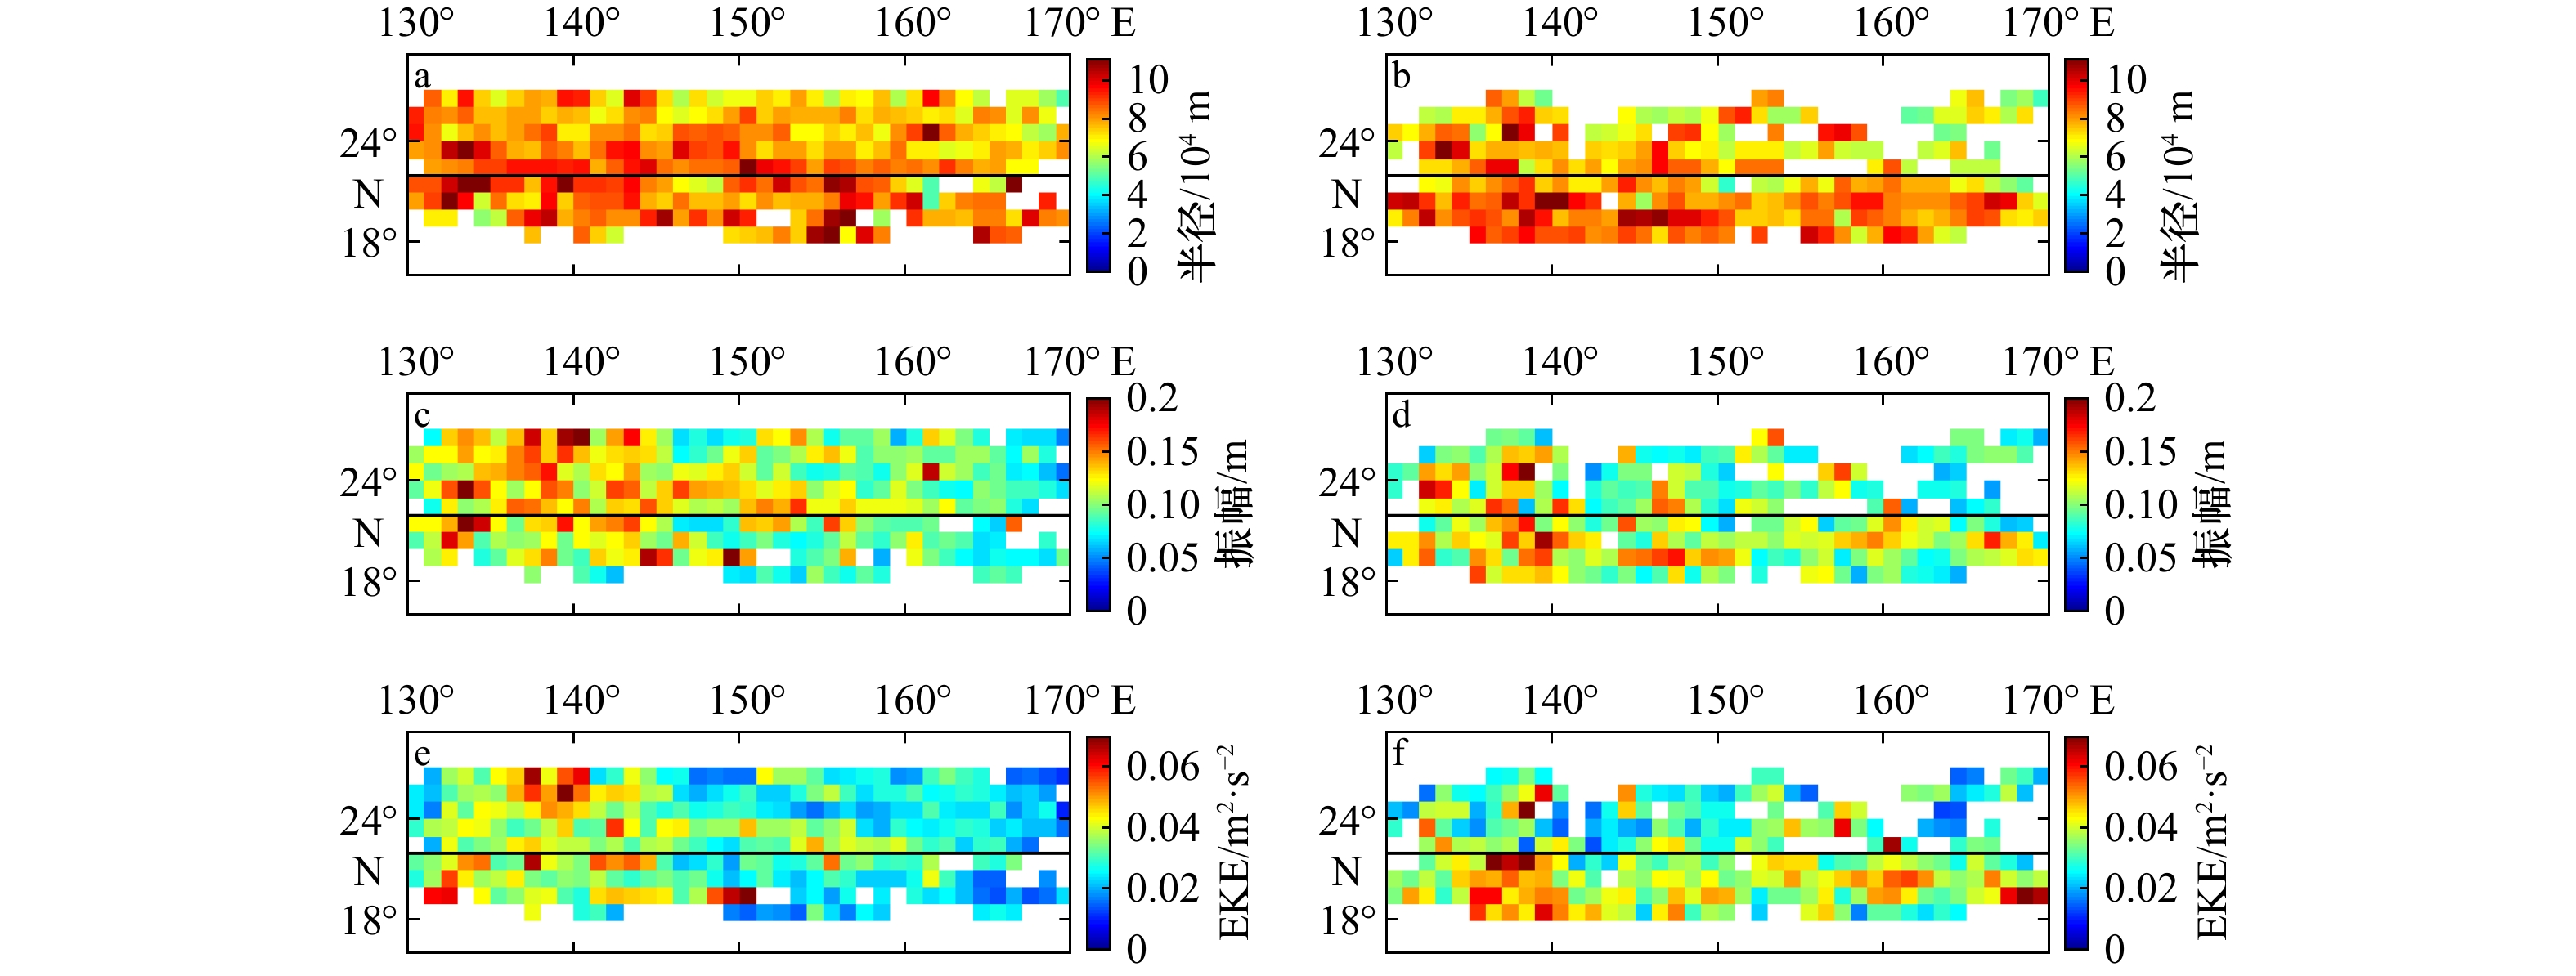
图 7 STCC区域生命周期超过12周的反气旋涡和气旋涡的半径、振幅和涡旋动能(EKE)的分布
a、c和e分别表示反气旋涡的半径、振幅和EKE的分布;b、d和f分别表示气旋涡的半径、振幅和EKE的分布;黑色粗线为22°N
Fig. 7 The radius, amplitude and eddy kinetic energy (EKE) distribution of the anticyclone eddies and cyclone eddies with the life cycle over 12 weeks in STCC region
a, c and e are represent the radius, amplitude and EKE distribution of the anticyclone eddies, respectively. b, d and f are represent the radius, amplitude and EKE distribution of the cyclone eddies, respectively. The black line is 22°N

图 8 利用AVISO SLA数据计算的KE区域的平均EKE和
${\rm{ rms }}\;\xi $ 的时间序列(a)和逐月分布(b);以及STCC区域的平均EKE和${\rm{ rms }}\;\xi $ 的时间序列(c)和逐月分布(d)Fig. 8 The time series (a) and monthly distribution (b) of the average EKE and rms
$\xi $ of KE region, and the time series (c) and monthly distribution (d) of the average EKE and${\rm{ rms }}\;\xi $ of STCC region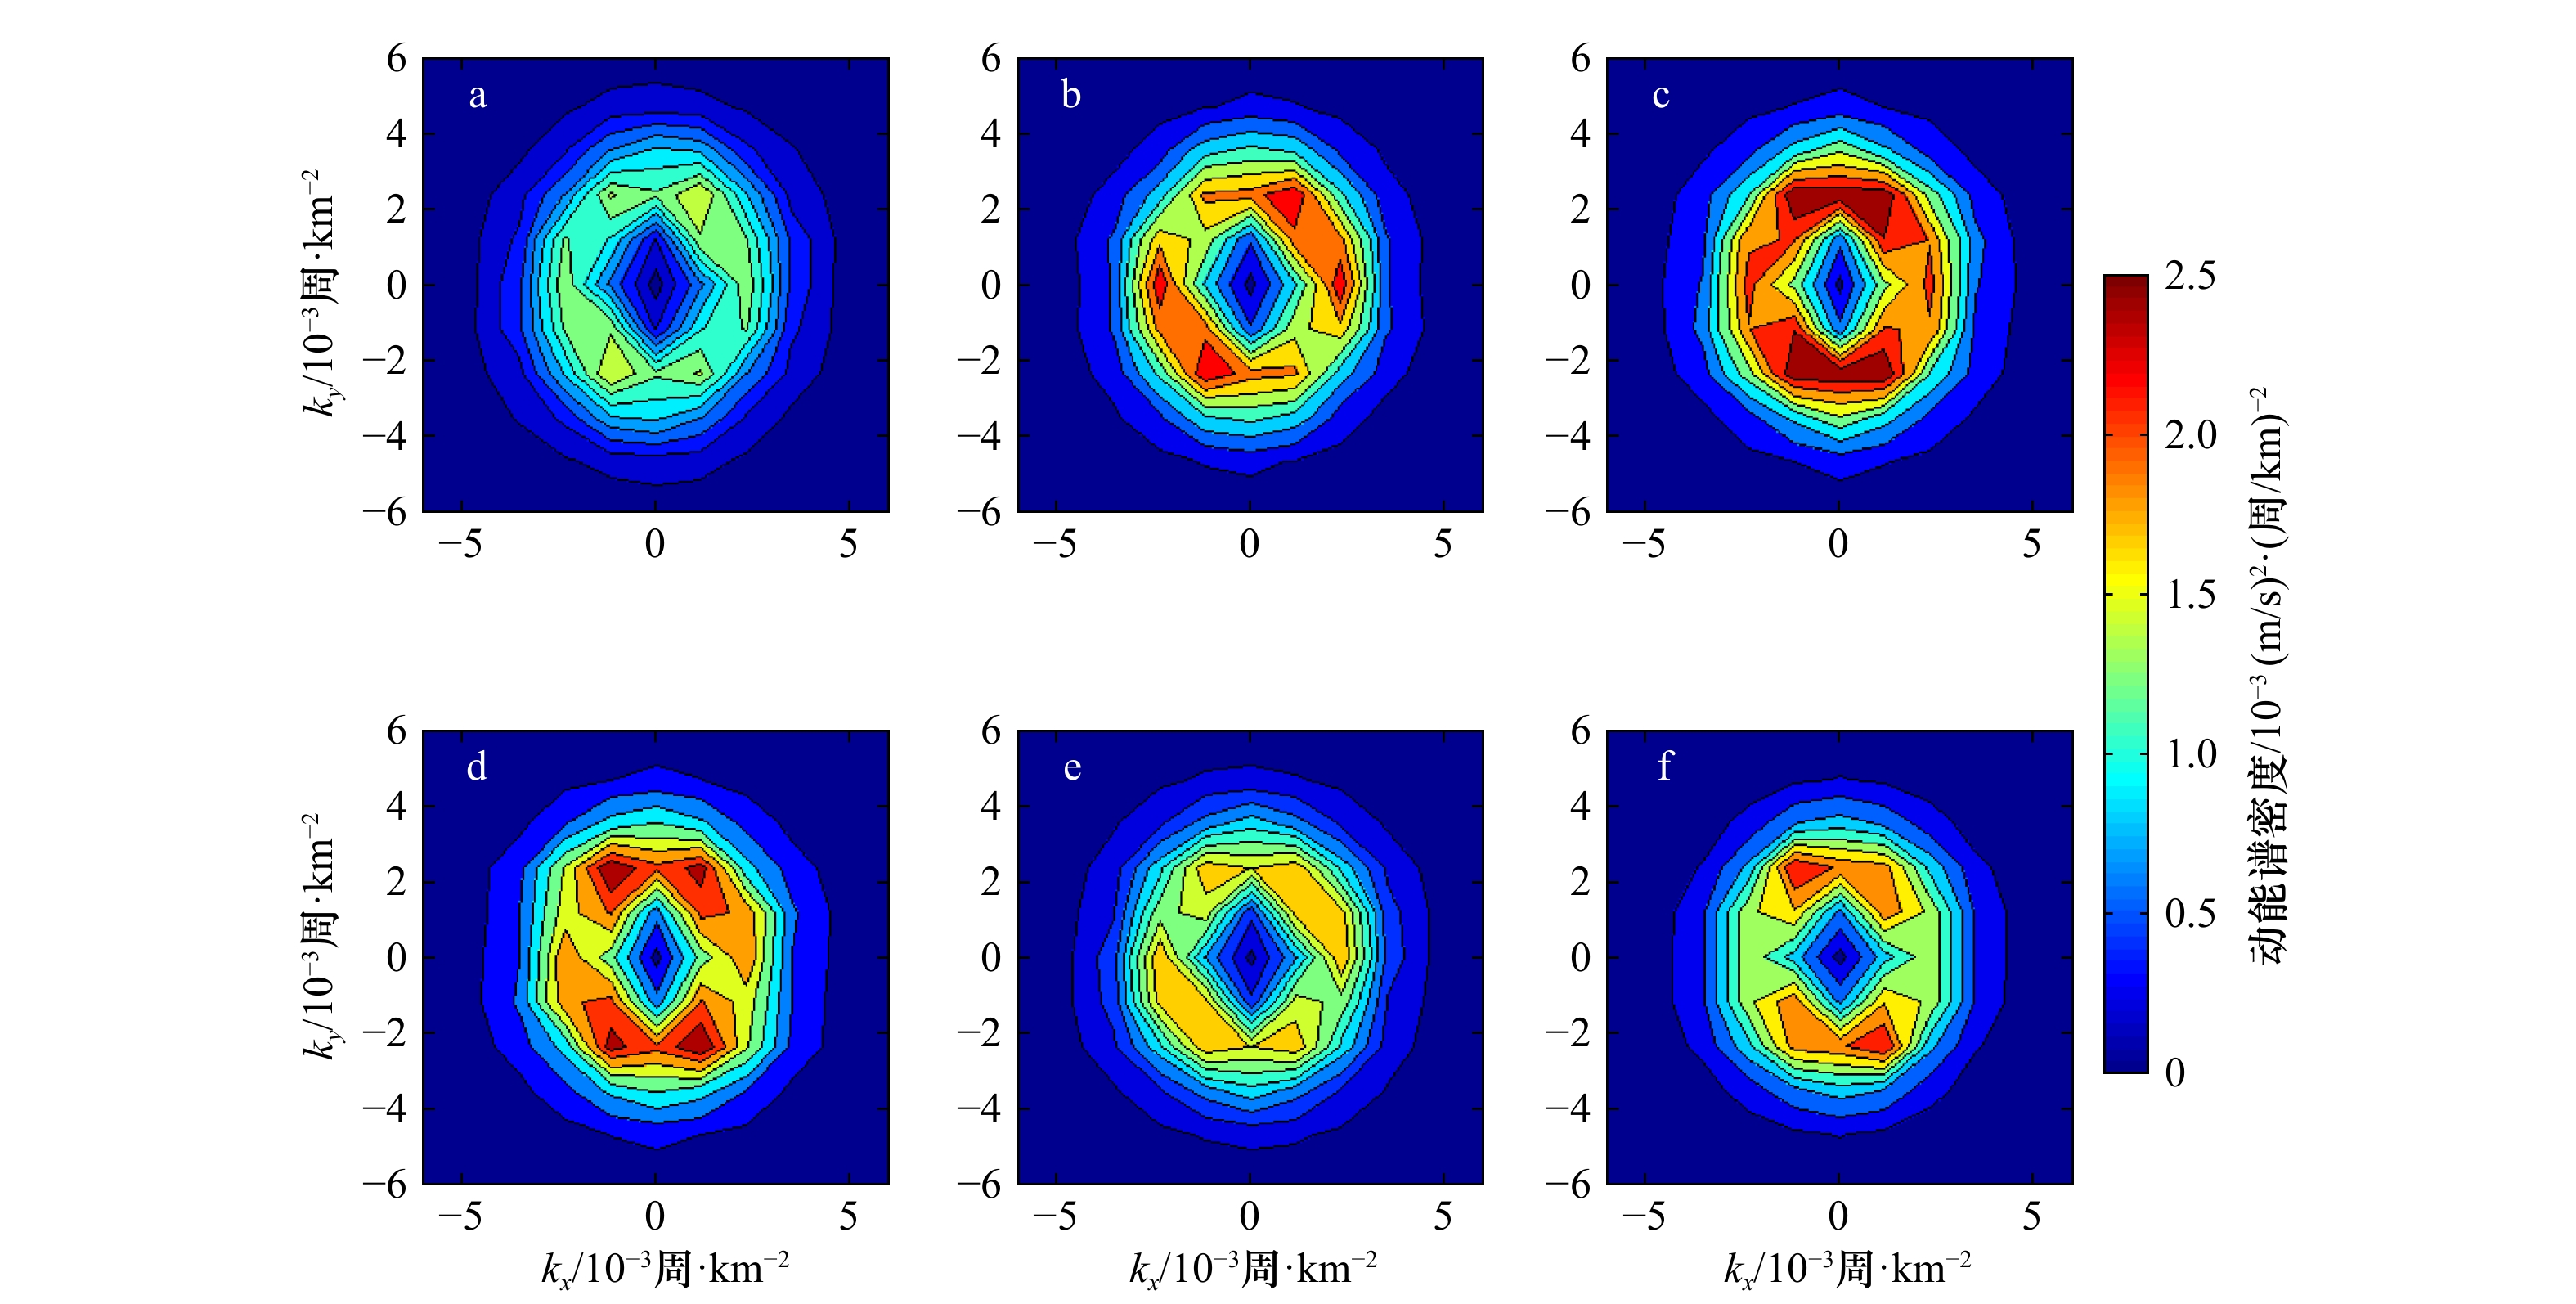
图 9 KE区域的2个月平均二维动能谱密度分布
a–f分别表示2–3月,4–5月,6–7月,8–9月,10–11月,12–1月的动能谱密度
Fig. 9 The distribution of bimonthly kinetic energy spectral density in KE region
a–f represent the kinetic energy spectral density from February to March, April to May, June to July, August to September, October to November and December to January, respectively
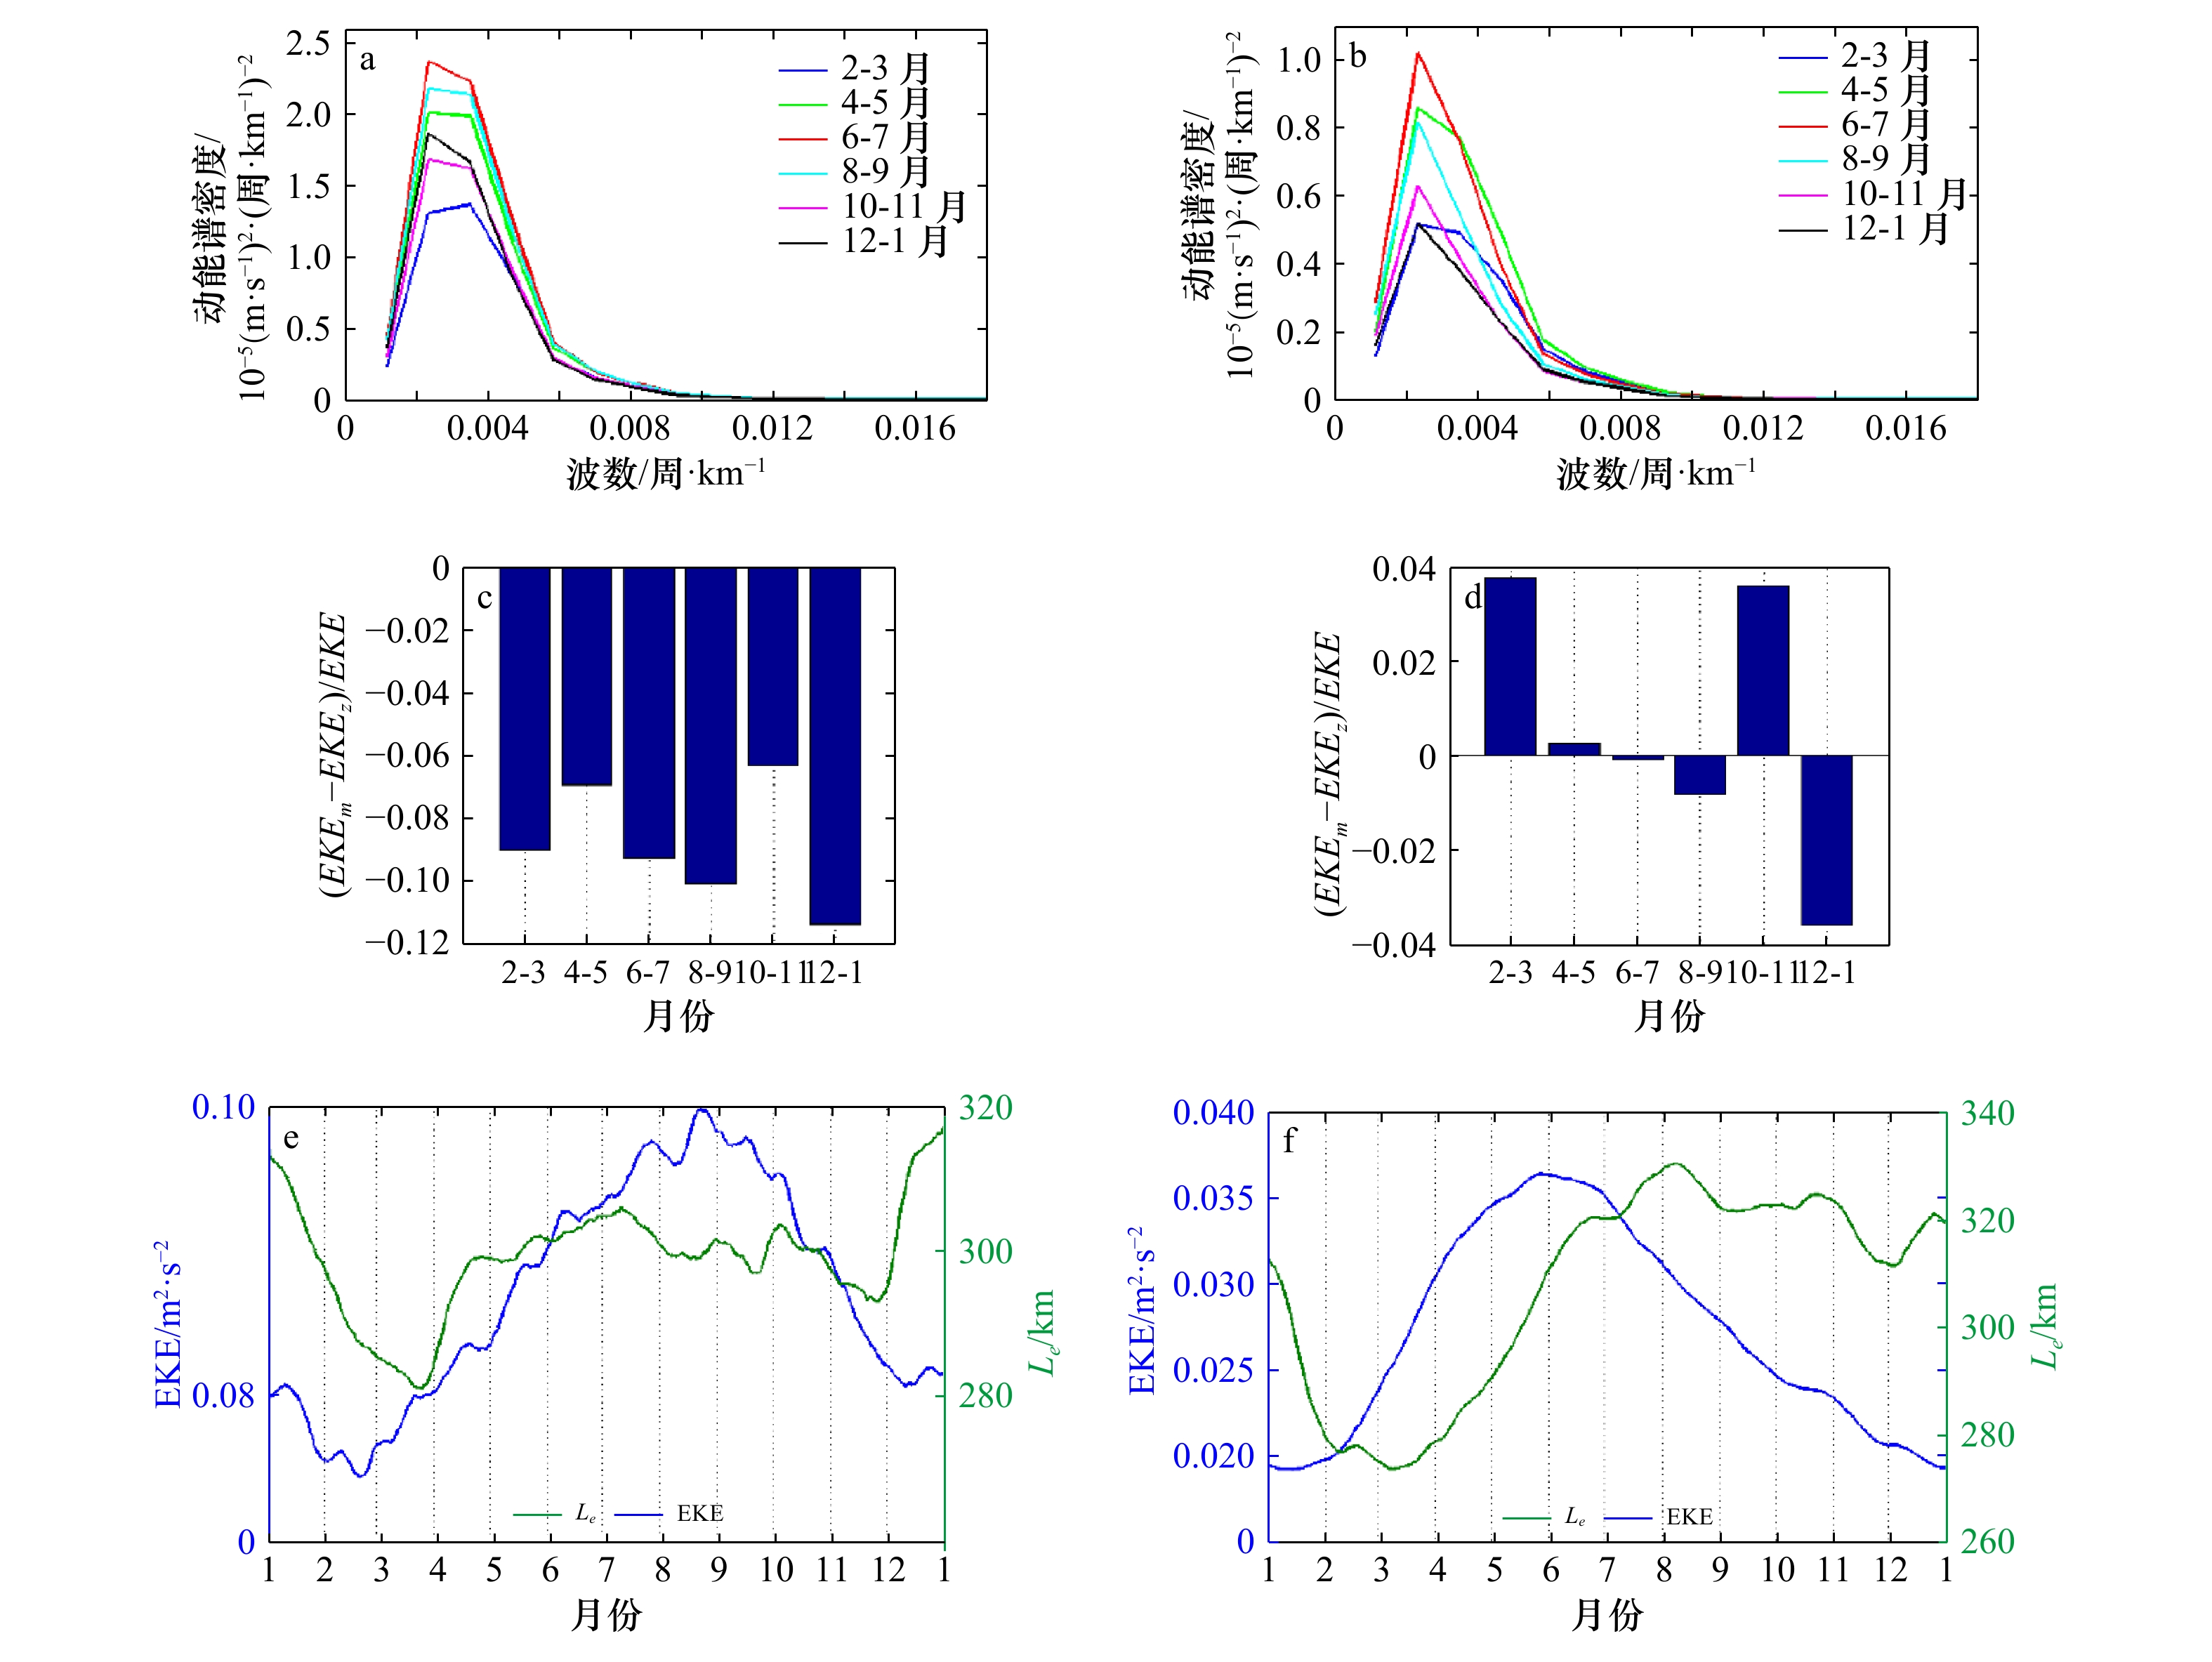
图 10 KE区域(a)和STCC区域(b)的波数-动能谱密度分布;KE区域(c)和STCC区域(d)根据
${{\left( {EK{E_z} - EK{E_m}} \right)} / {EKE}}$ 所得的EKE的纬向和经向比例;KE区域(e)和STCC区域(f)的EKE和能量尺度的逐月分布Fig. 10 The wavenumber-kinetic energy spectral density distribution in KE region (a) and STCC region (b). Measure of proportion of EKE that is zonally elongated vs. meridionally elongated
${{\left( {EK{E_z} - EK{E_m}} \right)} /{EKE}}$ in KE region (c) and STCC region (d). The monthly distribution of EKE and energy-containing length scale in KE region (e) and STCC region (f)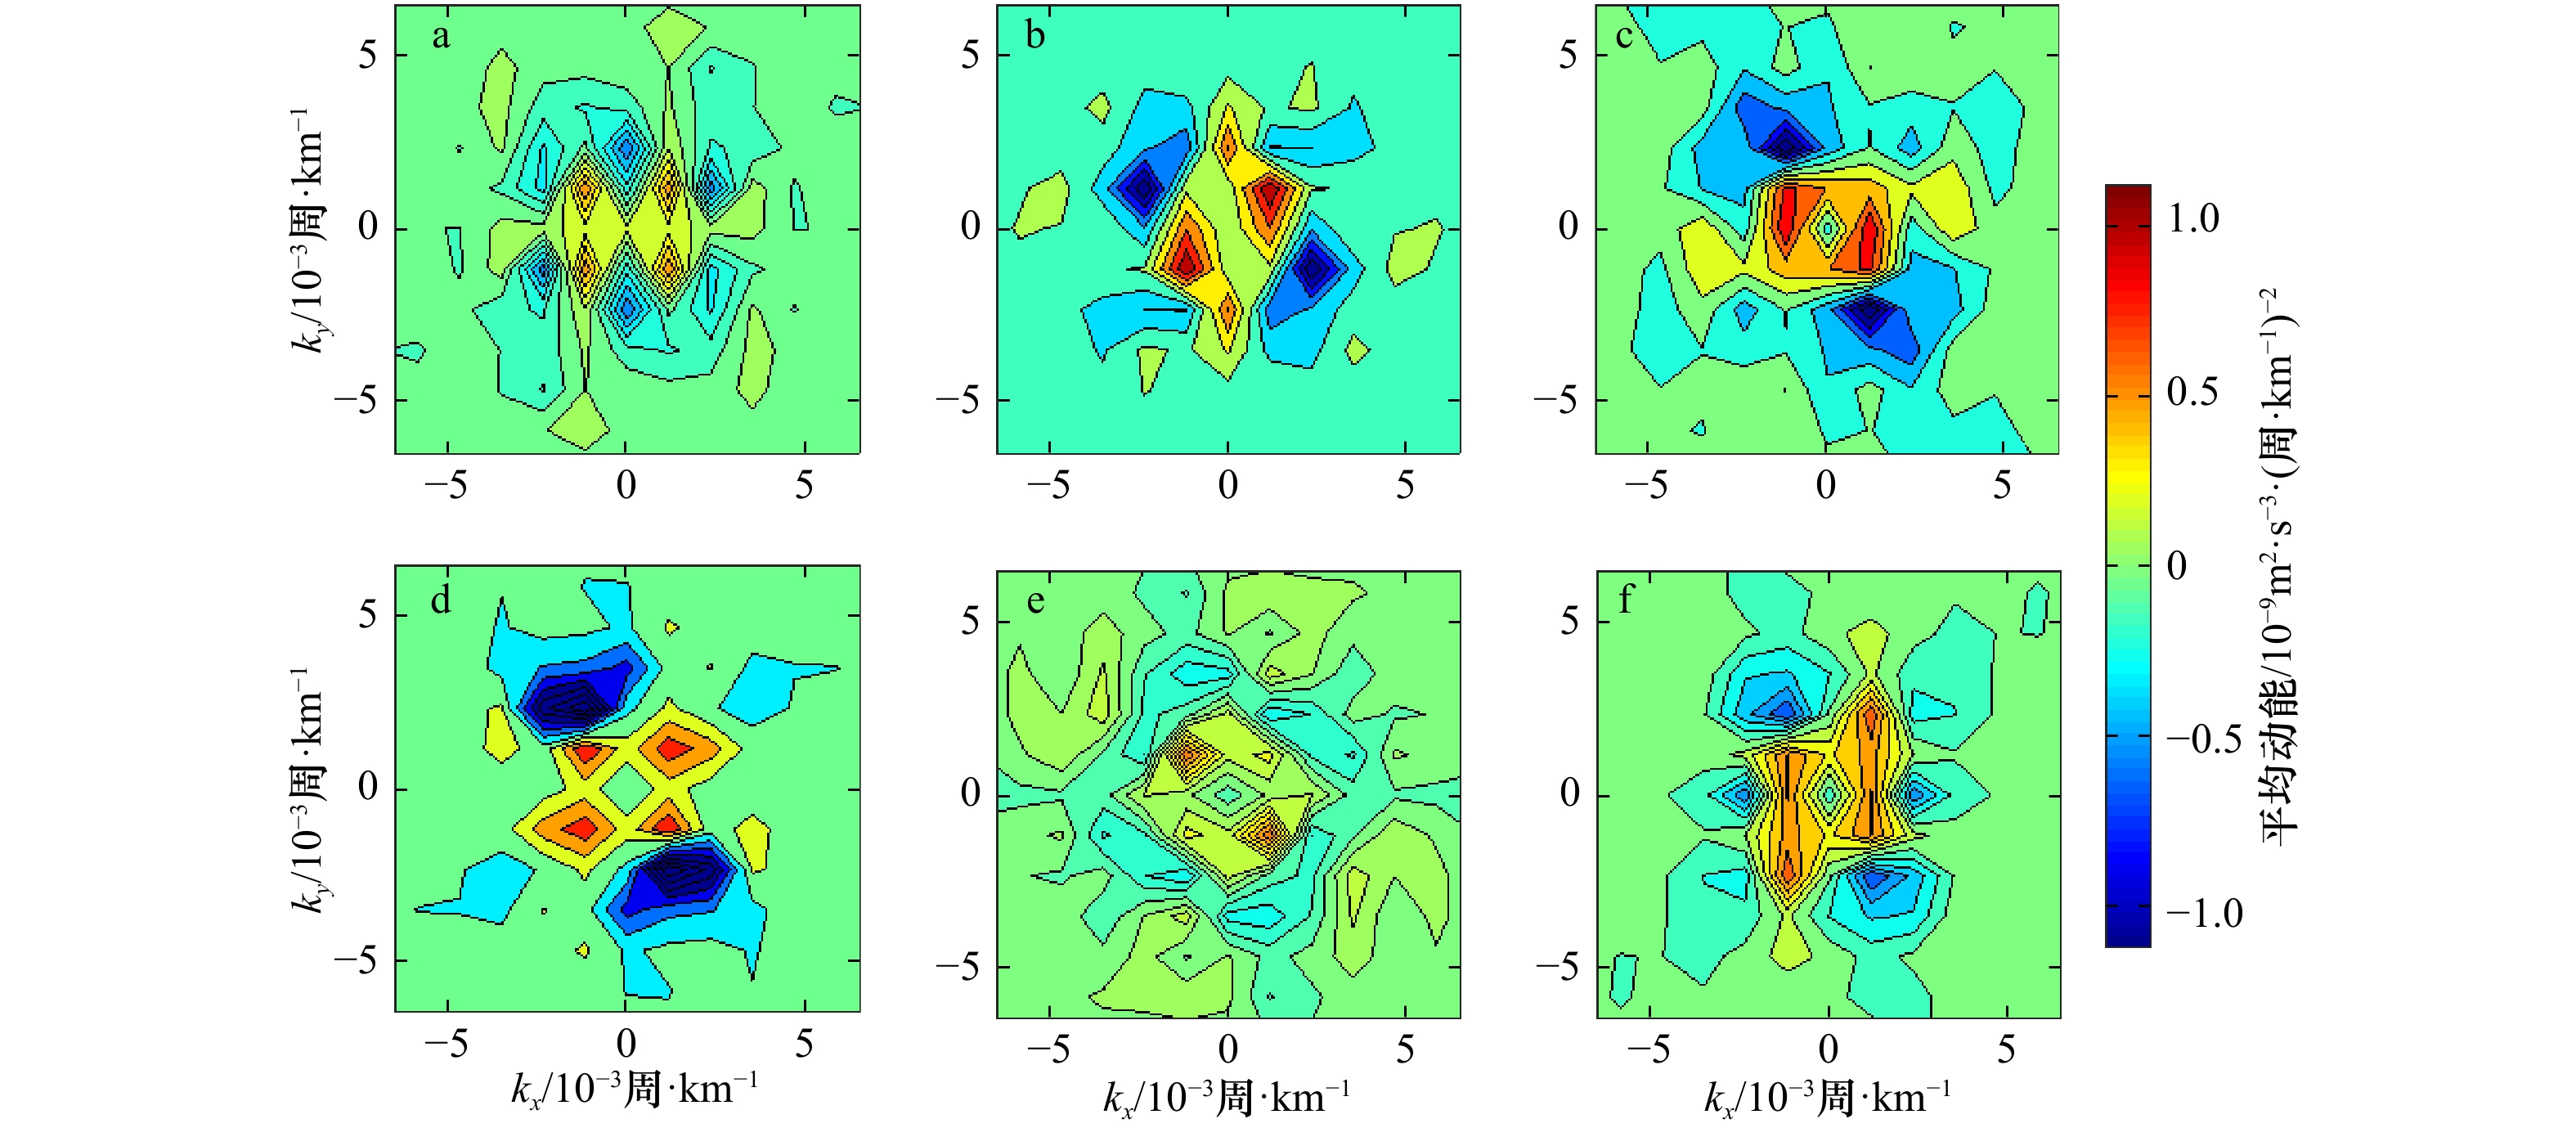
图 11 KE区域2个月平均动能转移项分布
a–f分别表示2–3月,4–5月,6–7月,8–9月,10–11月,12–1月的动能转移项
Fig. 11 The distribution of bimonthly kinetic energy spectral energy transfer in KE region
a–f represent the kinetic energy transfer from February to March, April to May, June to July, August to September, October to November and December to January, respectively
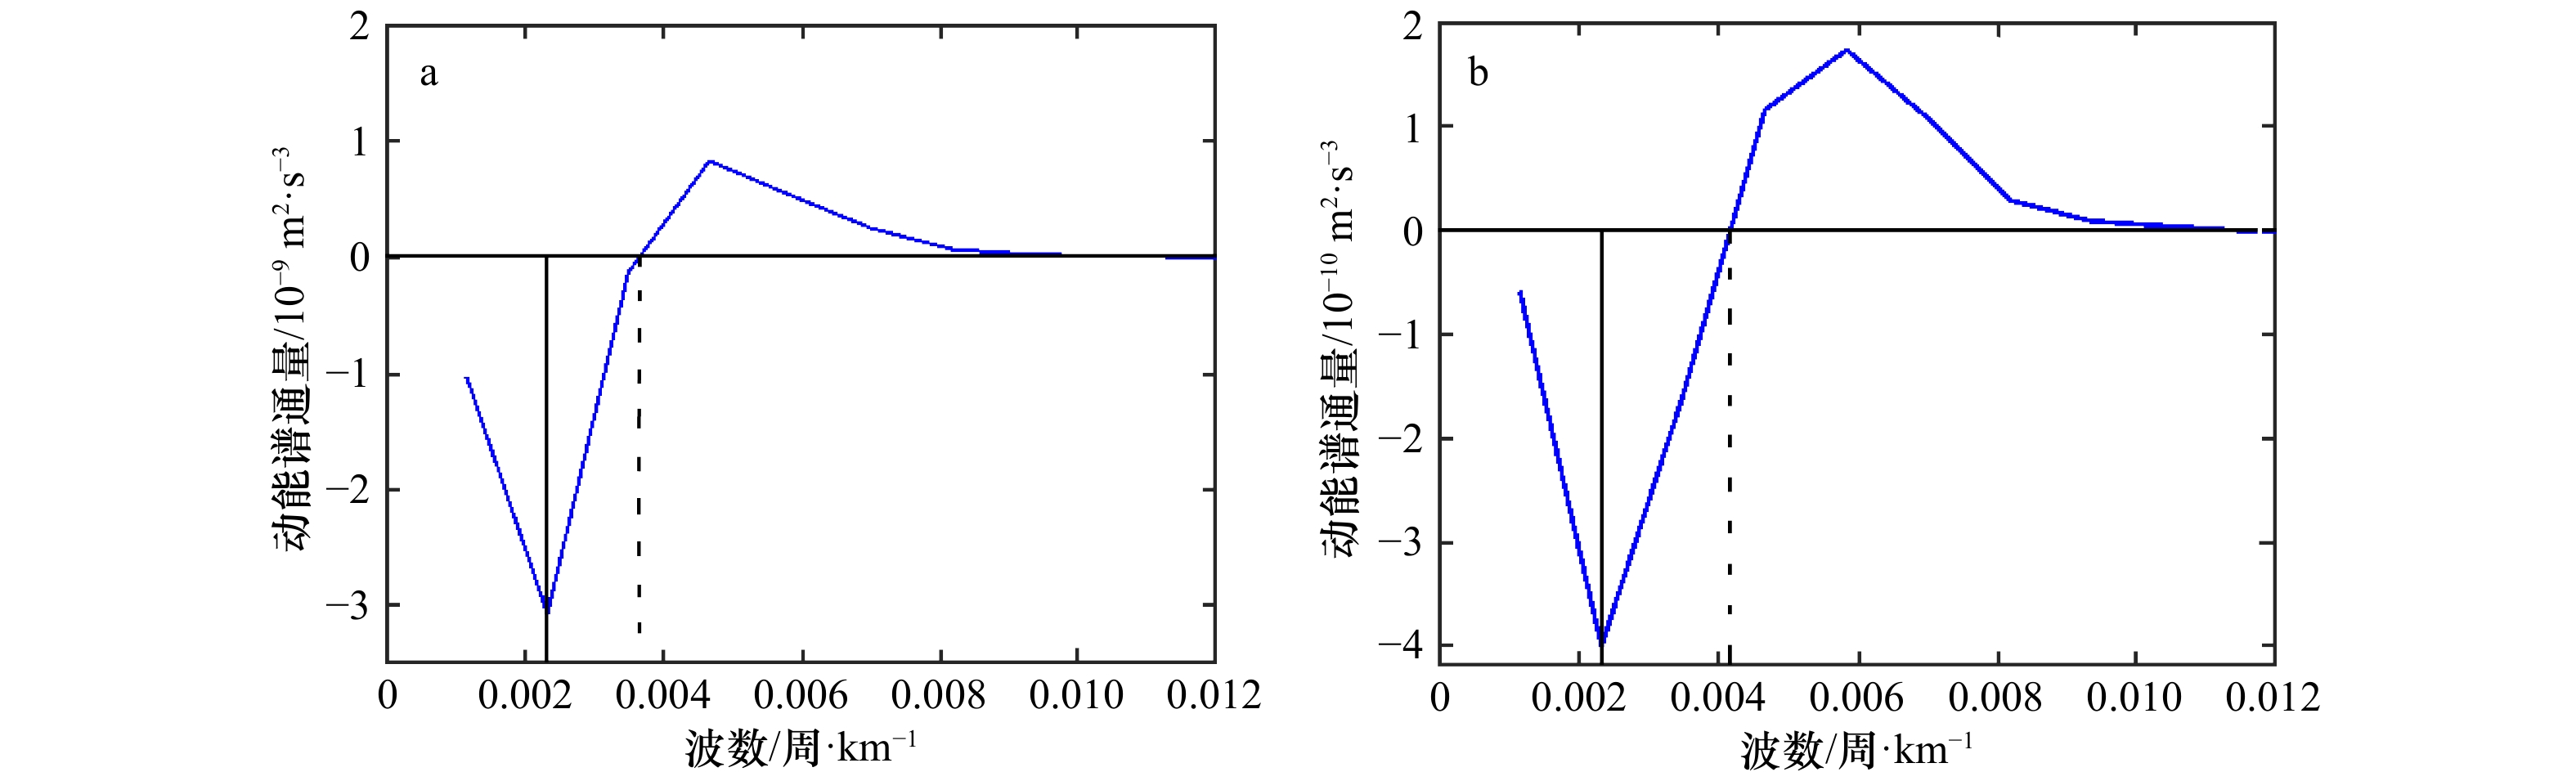
图 12 KE区域(a)和STCC区域(b)时间平均动能谱通量随各向同性波数的分布
Fig. 12 The time average kinetic energy spectral flux is distributed with the isotropic wavenumber in KE region (a) and STCC region (b)
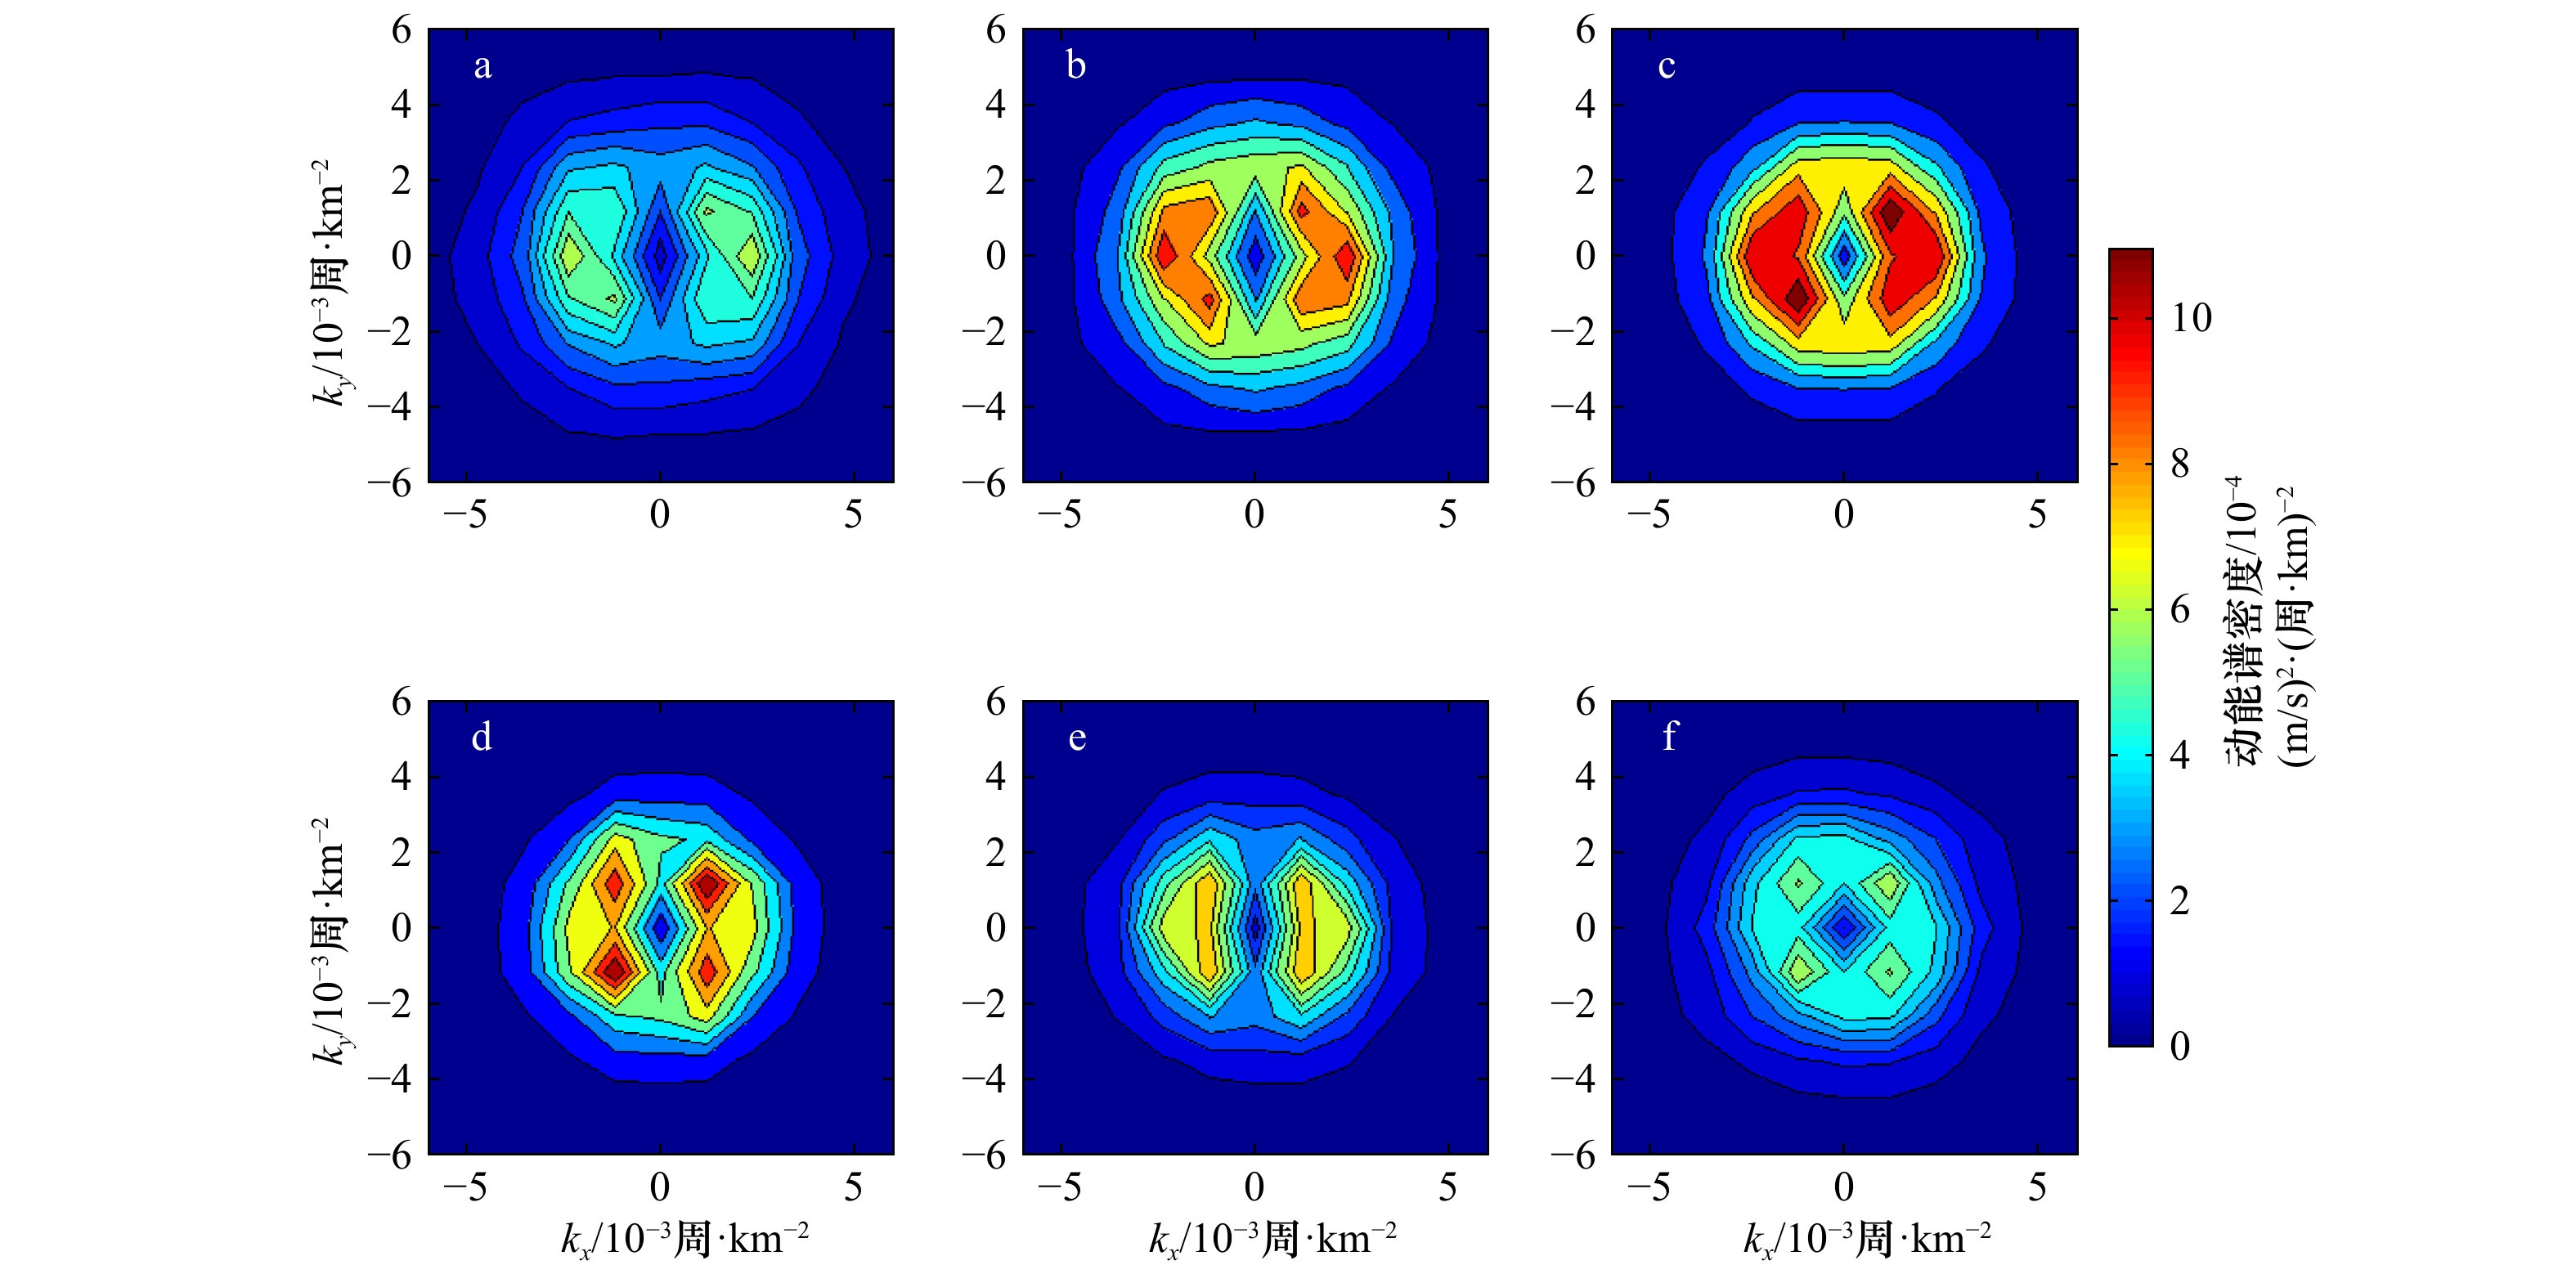
图 13 STCC区域的2个月平均二维动能谱密度分布
a–f分别表示2–3月,4–5月,6–7月,8–9月,10–11月,12–1月的动能谱密度
Fig. 13 The distribution of bimonthly kinetic energy spectral density in STCC region
a–f represent the kinetic energy spectral density from February to March, April to May, June to July, August to September, October to November and December to January, respectively
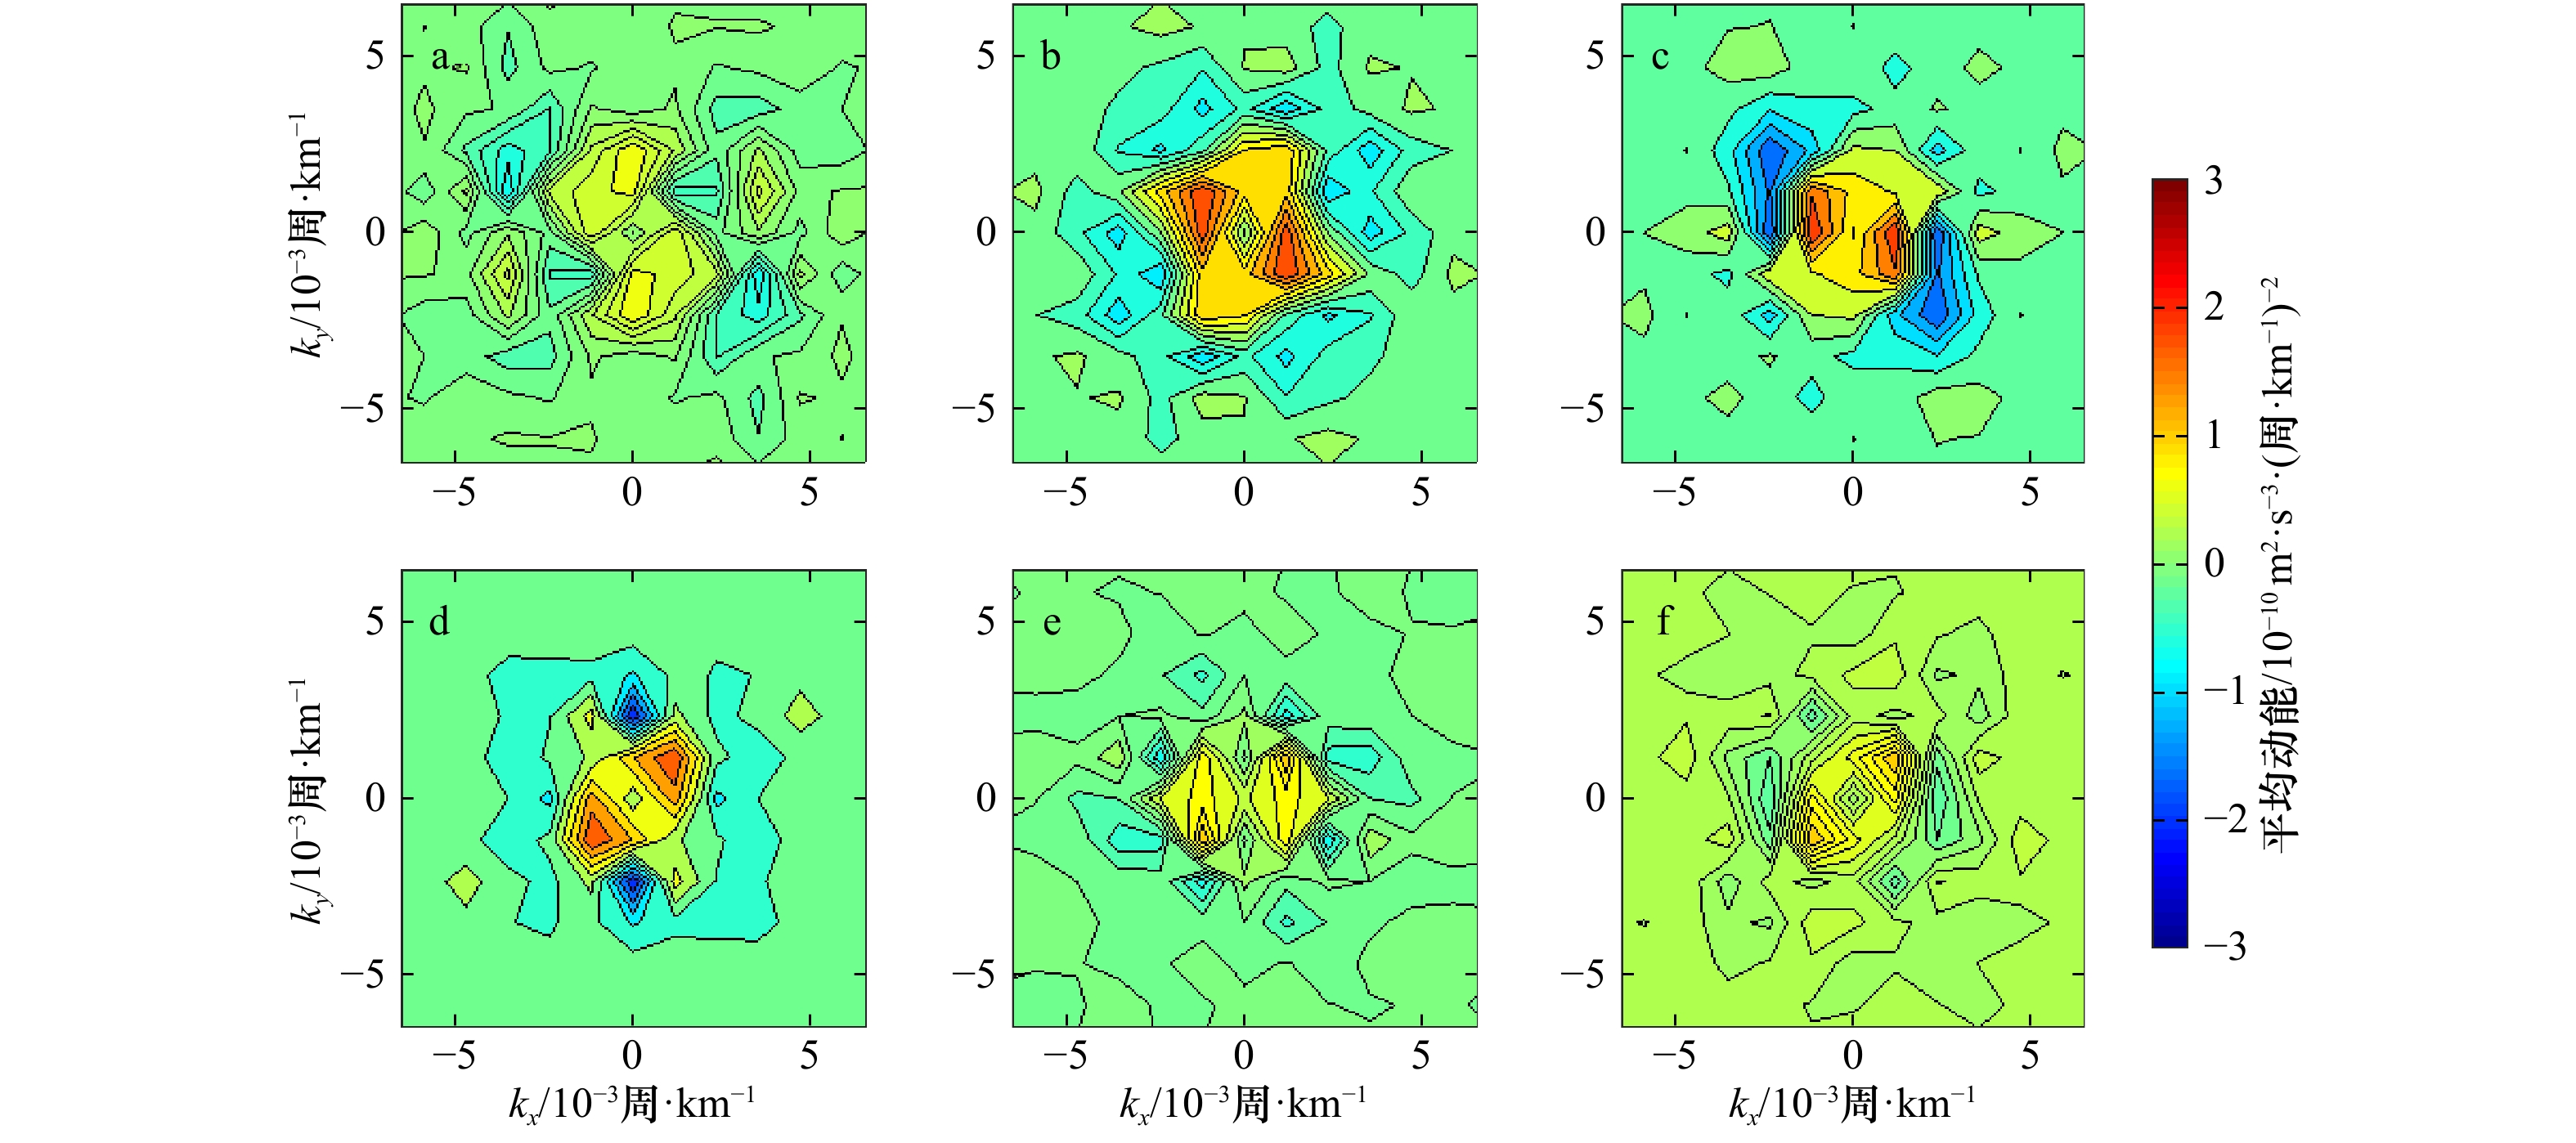
图 14 STCC区域2个月平均动能转移项分布
a–f分别表示2–3月,4–5月,6–7月,8–9月,10–11月,12–1月的动能转移项
Fig. 14 The distribution of bimonthly spectral energy transfer in STCC region
a–f represent the kinetic energy transfer from February to March, April to May, June to July, August to September, October to November and December to January, respectively
-
[1] Qiu Bo, Kelly K A, Joyce T M. Mean flow and variability in the Kuroshio Extension from Geosat altimetry data[J]. Journal of Geophysical Research: Oceans, 1991, 96(C10): 18491−18507. doi: 10.1029/91JC01834 [2] Qiu Bo, Chen Suiming. Variability of the Kuroshio Extension jet, recirculation gyre, and mesoscale eddies on decadal time scales[J]. Journal of Physical Oceanography, 2005, 35(11): 2090−2103. doi: 10.1175/JPO2807.1 [3] Qiu Bo, Chen Suiming. Concurrent decadal mesoscale eddy modulations in the western North Pacific subtropical gyre[J]. Journal of Physical Oceanography, 2013, 43(2): 344−358. doi: 10.1175/JPO-D-12-0133.1 [4] Taguchi B, Qiu Bo, Nonaka M, et al. Decadal variability of the Kuroshio Extension: mesoscale eddies and recirculations[J]. Ocean Dynamics, 2010, 60(3): 673−691. doi: 10.1007/s10236-010-0295-1 [5] Itoh S, Yasuda I. Characteristics of mesoscale eddies in the Kuroshio-Oyashio Extension region detected from the distribution of the sea surface height anomaly[J]. Journal of Physical Oceanography, 2010, 40(5): 1018−1034. doi: 10.1175/2009JPO4265.1 [6] Kobashi F, Kawamura H. Seasonal variation and instability nature of the North Pacific Subtropical Countercurrent and the Hawaiian Lee Countercurrent[J]. Journal of Geophysical Research: Oceans, 2002, 107(C11): 6−1. [7] Qiu Bo. Seasonal eddy field modulation of the North Pacific Subtropical Countercurrent: TOPEX/Poseidon observations and theory[J]. Journal of Physical Oceanography, 1999, 29(10): 2471−2486. doi: 10.1175/1520-0485(1999)029<2471:SEFMOT>2.0.CO;2 [8] Chang Yulin, Oey L Y. Analysis of STCC eddies using the Okubo-Weiss parameter on model and satellite data[J]. Ocean Dynamics, 2014, 64(2): 259−271. doi: 10.1007/s10236-013-0680-7 [9] Sheu W J, Wu C R, Oey L Y. Blocking and westward passage of eddies in the Luzon Strait[J]. Deep-Sea Research Part II: Topical Studies in Oceanography, 2010, 57(19/20): 1783−1791. [10] Zhang Zhichun, Yuan Dongliang, Chu P C. Geostrophic meridional transport in tropical Northwest Pacific based on Argo profiles[J]. Chinese Journal of Oceanology and Limnology, 2013, 31(3): 656−664. doi: 10.1007/s00343-013-2169-0 [11] Yuan Dongliang, Zhang Zhichun, Chu P C, et al. Geostrophic circulation in the tropical North Pacific Ocean based on Argo profiles[J]. Journal of Physical Oceanography, 2014, 44(2): 558−575. doi: 10.1175/JPO-D-12-0230.1 [12] Qiu Bo. The Kuroshio Extension system: its large-scale variability and role in the midlatitude ocean-atmosphere interaction[J]. Journal of Oceanography, 2002, 58(1): 57−75. doi: 10.1023/A:1015824717293 [13] Qiu Bo, Chen Shuiming, Klein P, et al. Seasonal mesoscale and submesoscale eddy variability along the North Pacific Subtropical Countercurrent[J]. Journal of Physical Oceanography, 2014, 44(12): 3079−3098. doi: 10.1175/JPO-D-14-0071.1 [14] Okubo A. Horizontal dispersion of floatable particles in the vicinity of velocity singularities such as convergences[J]. Deep Sea Research and Oceanographic Abstracts, 1970, 17(3): 445−454. doi: 10.1016/0011-7471(70)90059-8 [15] Weiss J. The dynamics of enstrophy transfer in two-dimensional hydrodynamics[J]. Physica D: Nonlinear Phenomena, 1991, 48(2/3): 273−294. [16] Isern-Fontanet J, García-Ladona E, Font J. Vortices of the Mediterranean Sea: an altimetric perspective[J]. Journal of Physical Oceanography, 2006, 36(1): 87−103. doi: 10.1175/JPO2826.1 [17] Chaigneau A, Gizolme A, Grados C. Mesoscale eddies off Peru in altimeter records: Identification algorithms and eddy spatio-temporal patterns[J]. Progress in Oceanography, 2008, 79(2/4): 106−119. [18] Penven P, Echevin V, Pasapera J, et al. Average circulation, seasonal cycle, and mesoscale dynamics of the Peru Current System: a modeling approach[J]. Journal of Geophysical Research: Oceans, 2005, 110(C10): C10021. doi: 10.1029/2005JC002945 [19] 王亚华, 何宏让, 臧增亮, 等. GRAPES全球模式的动能谱分析[J]. 干旱气象, 2015, 33(2): 220−226.Wang Yahua, He Hongrang, Zang Zengliang, et al. The kinetic energy spectrum analysis based on the global GRAPES model[J]. Journal of Arid Meteorology, 2015, 33(2): 220−226. [20] Qiu Bo, Scott R B, Chen Shuiming. Length scales of eddy generation and nonlinear evolution of the seasonally modulated South Pacific subtropical countercurrent[J]. Journal of Physical Oceanography, 2008, 38(7): 1515−1528. doi: 10.1175/2007JPO3856.1 [21] Wang Shihong, Liu Zhiliang, Pang Chongguang. Geographical distribution and anisotropy of the inverse kinetic energy cascade, and its role in the eddy equilibrium processes[J]. Journal of Geophysical Research: Oceans, 2015, 120(7): 4891−4906. doi: 10.1002/2014JC010476 [22] Scott R B, Wang Faming. Direct evidence of an oceanic inverse kinetic energy cascade from satellite altimetry[J]. Journal of Physical Oceanography, 2005, 35(9): 1650−1666. doi: 10.1175/JPO2771.1 [23] Sasaki H, Klein P. SSH wavenumber spectra in the North Pacific from a high-resolution realistic simulation[J]. Journal of Physical Oceanography, 2012, 42(7): 1233−1241. doi: 10.1175/JPO-D-11-0180.1 [24] Tulloch R, Marshall J, Hill C, et al. Scales, growth rates, and spectral fluxes of baroclinic instability in the ocean[J]. Journal of Physical Oceanography, 2011, 41(6): 1057−1076. doi: 10.1175/2011JPO4404.1 [25] Tai C K, White W B. Eddy variability in the Kuroshio Extension as revealed by Geosat altimetry: energy propagation away from the jet, Reynolds stress, and seasonal cycle[J]. Journal of Physical Oceanography, 1990, 20(11): 1761−1777. doi: 10.1175/1520-0485(1990)020<1761:EVITKE>2.0.CO;2 [26] Chelton D B, Schlax M G, Samelson R M. Global observations of nonlinear mesoscale eddies[J]. Progress in Oceanography, 2011, 91(2): 167−216. doi: 10.1016/j.pocean.2011.01.002 [27] Fu L L, Chelton D B, Le Traon P Y, et al. Eddy dynamics from satellite altimetry[J]. Oceanography, 2010, 23(4): 14−25. doi: 10.5670/oceanog.2010.02 [28] Yang Yang, Liang X S. On the seasonal eddy variability in the Kuroshio Extension[J]. Journal of Physical Oceanography, 2018, 48(8): 1675−1689. doi: 10.1175/JPO-D-18-0058.1 -

 下载:
下载:


计量
- 文章访问数: 610
- HTML全文浏览量: 84
- PDF下载量: 148
- 被引次数: 0
