

Analysis on climate characteristics of sea surface temperature extremes in coastal China seas
-
摘要: 本文基于1982–2017年日再分析数据,分析了中国近海海表温度变化的极端特性、历史演变、空间格局及可能影响,并探讨了与全球变化和区域气候变率的关联性。近30多年来,中国近海海表总体升温明显,尤以春季长江口附近及以南的外部近岸海域升温最为显著,线性升温速率高达0.2°C/(10 a)。相比而言,沿岸海域对气候变暖暂缓的响应可能更为明显;极端高(低)温强度以显著增强(减弱)为主,尤以春(夏)季幅度最大。沿岸海域春季极值温差增强显著,易通过物候变化引起生物迁移和赤潮等生态灾害突发、频发;北部海域极端事件持续天数大于南部,其中,黄海、东海极端高温持续天数增加显著,可能对渔业资源产生较大影响。受气候变暖暂缓影响,极端低温持续天数亦显著增加;极端高温在长江口附近,台湾海峡和南海北部等海域累积频次上升显著,未来极端海洋热浪事件可能持续增加,将对南海珊瑚礁等产生较大影响。极端低温累积频次以显著降低为主。然而长江口及以南沿岸极端低温在冬春季增强明显,可能对红树林等产生一定影响;太平洋年代际振荡(PDO)暖位相期间,ENSO暖事件得到增强,易引起中国近海海表极端低温的频发。北极涛动(AO)正位相时,限制了极区冷空气向南扩展,中国近海海表极端高温频次趋于增加,其危险性增强。Abstract: Based on the daily reanalysis from 1982 to 2017, this paper focuses on the analysis of the extreme characteristics, historical evolution, spatial pattern and possible impactions of sea surface temperature (SST) in coastal China seas (CCS), and discusses the correlation with global change and regional climate variability. The SST in the CCS overall increased significantly in recent more than 30 years, especially in the spring near the Changjiang River Estuary and offshore areas south of it with the warming rate up to 0.2℃/(10 a). Nevertheless the response of nearshore waters to the global warming hiatus is likely to be more pronounced. The extreme high (low) temperature intensity is mainly enhanced (weakened), especially in spring (summer). The increase of extreme temperature difference in the nearshore area in spring can easily lead to frequent ecological disasters such as biological migration and red tide. The consecutive days of extreme events in the northern sea areas are longer than in the south. The consecutive days of extreme high temperature in the Yellow Sea and East China Sea increased significantly, which may have a potential impact on fishery resources. Mostly due to the global warming hiatus, the consecutive days of extreme low temperature is also increased significantly. The cumulative frequency of extreme high temperature near the Changjiang River Estuary, the Taiwan Strait and the northern part of the South China Sea (SCS) increased significantly. In the future, extreme marine heat waves are likely increase continuously, which will have a greater impact on the coral reefs in the SCS and so on. The cumulative frequency of extreme low temperature is mainly reduced. The extreme low temperature along the Changjiang River Estuary and the southern nearshore sea areas increased obviously in winter and spring, which may have some influence on mangrove. During the warm phase of the Pacific decadal oscillation (PDO), the ENSO warm event is enhanced, which is likely to cause the frequent occurrence of extreme low temperature in the CCS. In addition, as the Arctic oscillation (AO) is in positive phase, the cold air in the polar region is restricted to expand southward, and the frequency of extreme high temperature in the CCS surface tends to increase, which enhances the disaster risk.
-
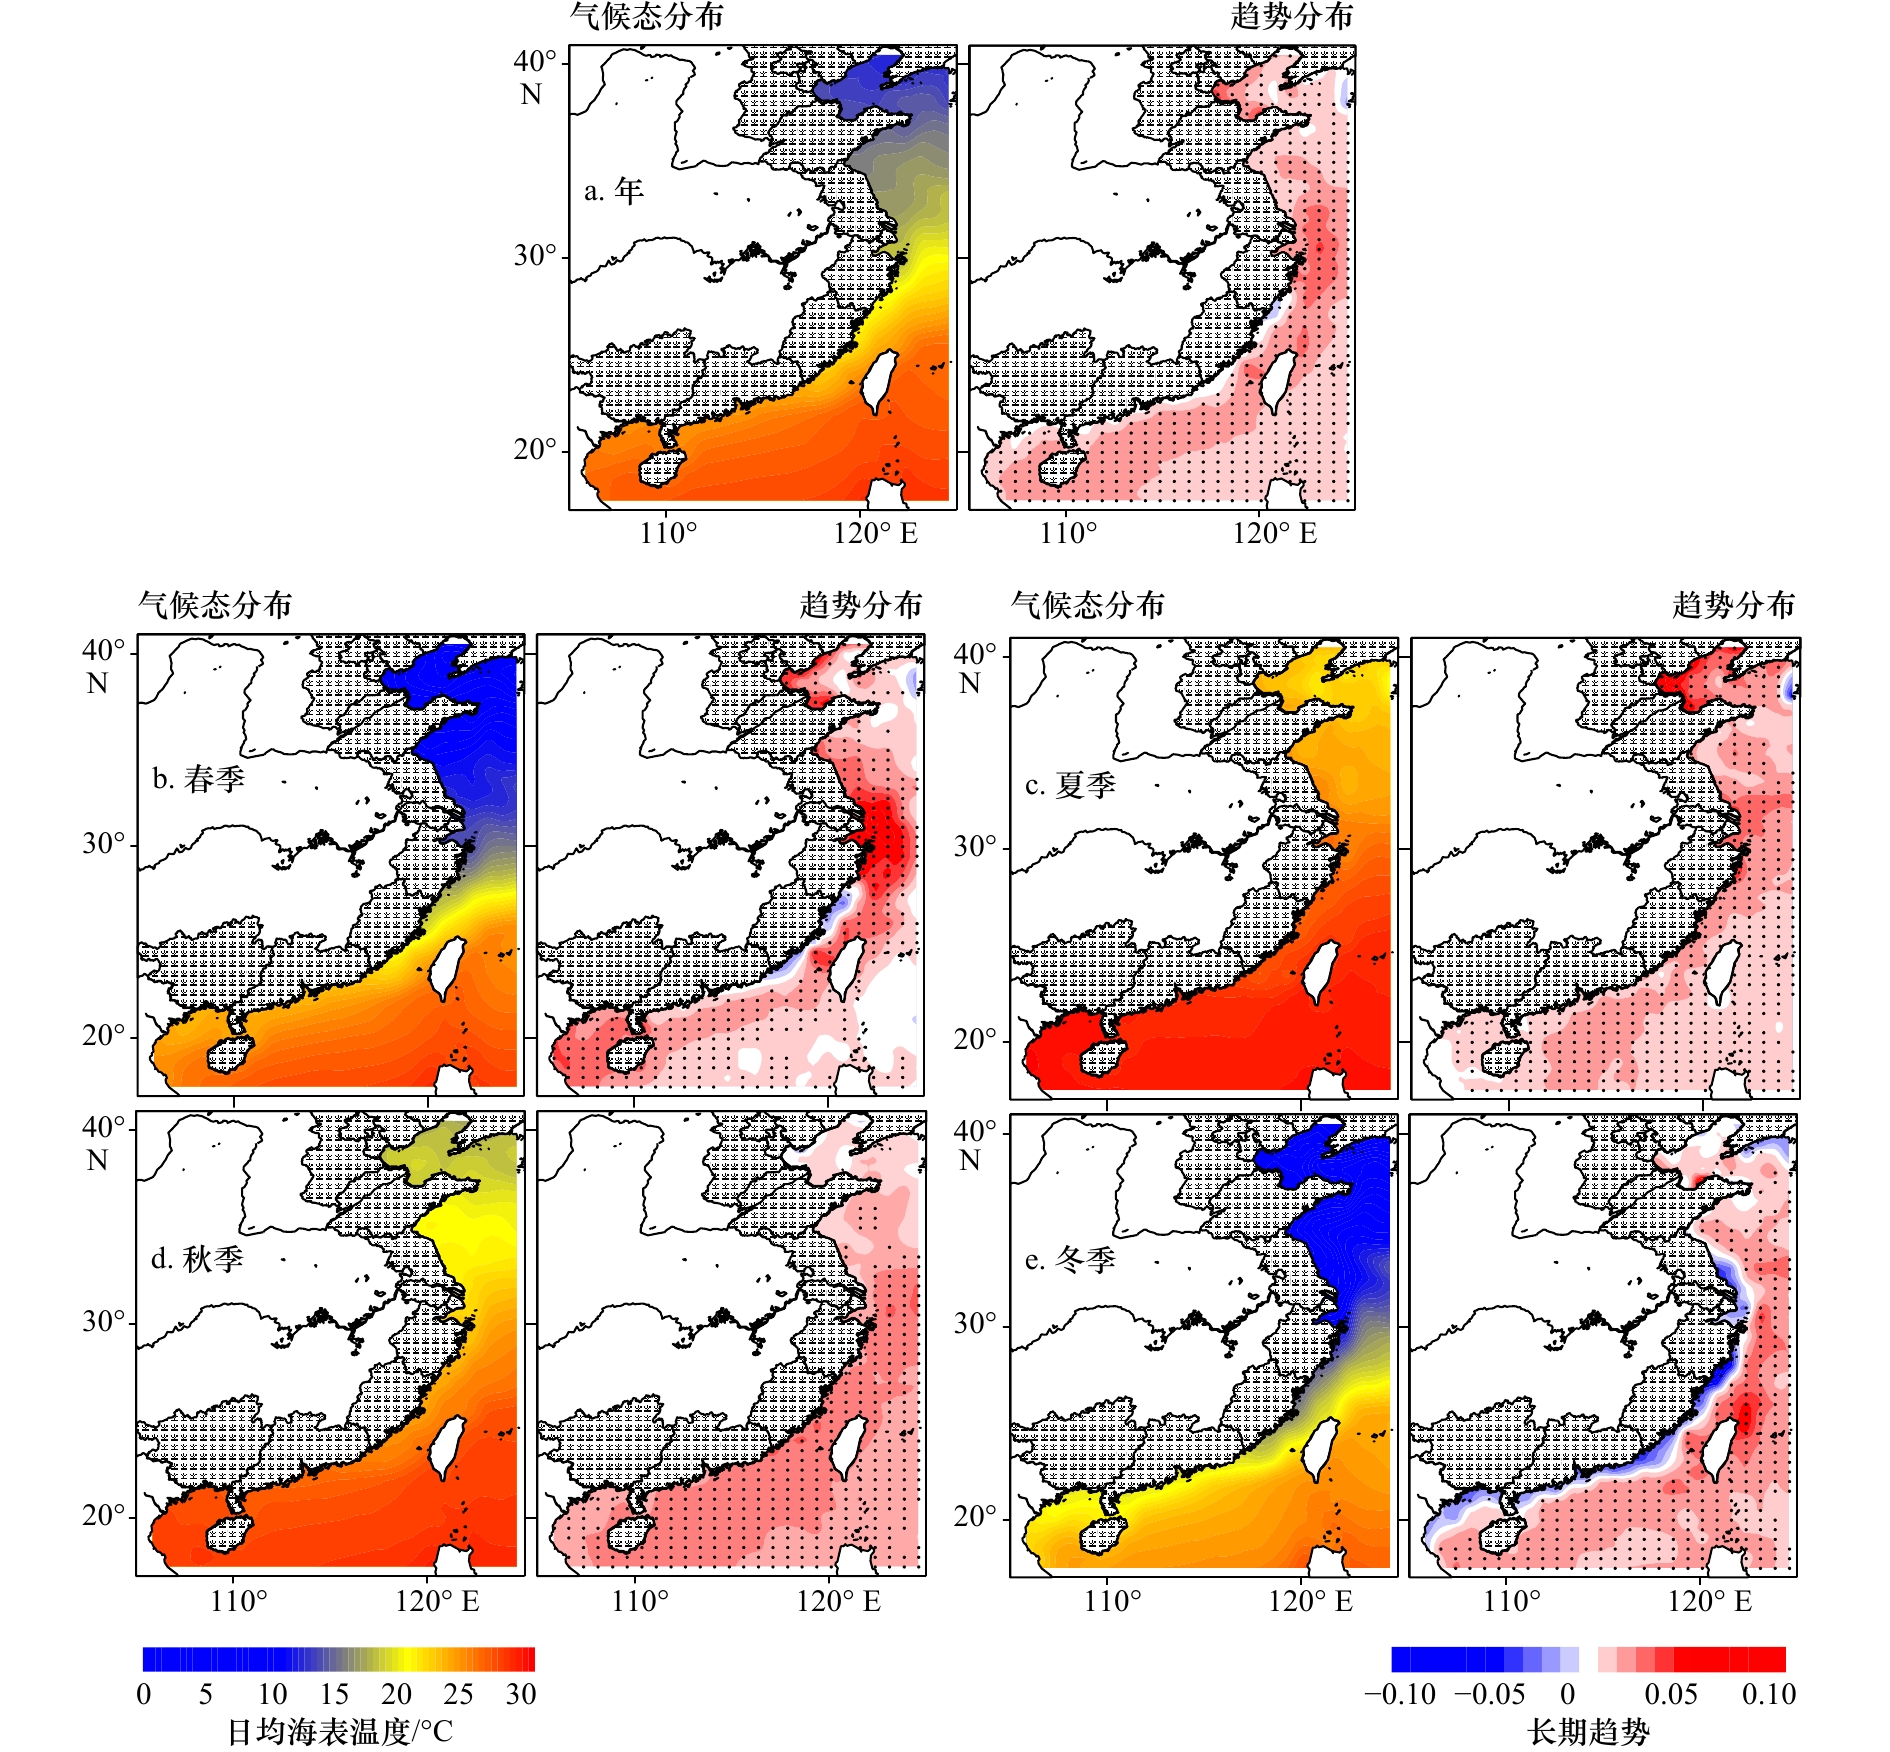
图 1 中国近海日平均海表温度气候态(1982–2011年)分布(左)及长期(1982–2017年)变化趋势 (右,圆点为超过90%显著性检验的区域)
Fig. 1 Climatic status (1982–2011) distribution (left) of daily mean sea surface temperature in coastal China seas and corresponding long-term (1982–2017) trends (right, the dots for stations with more than 90% significance)
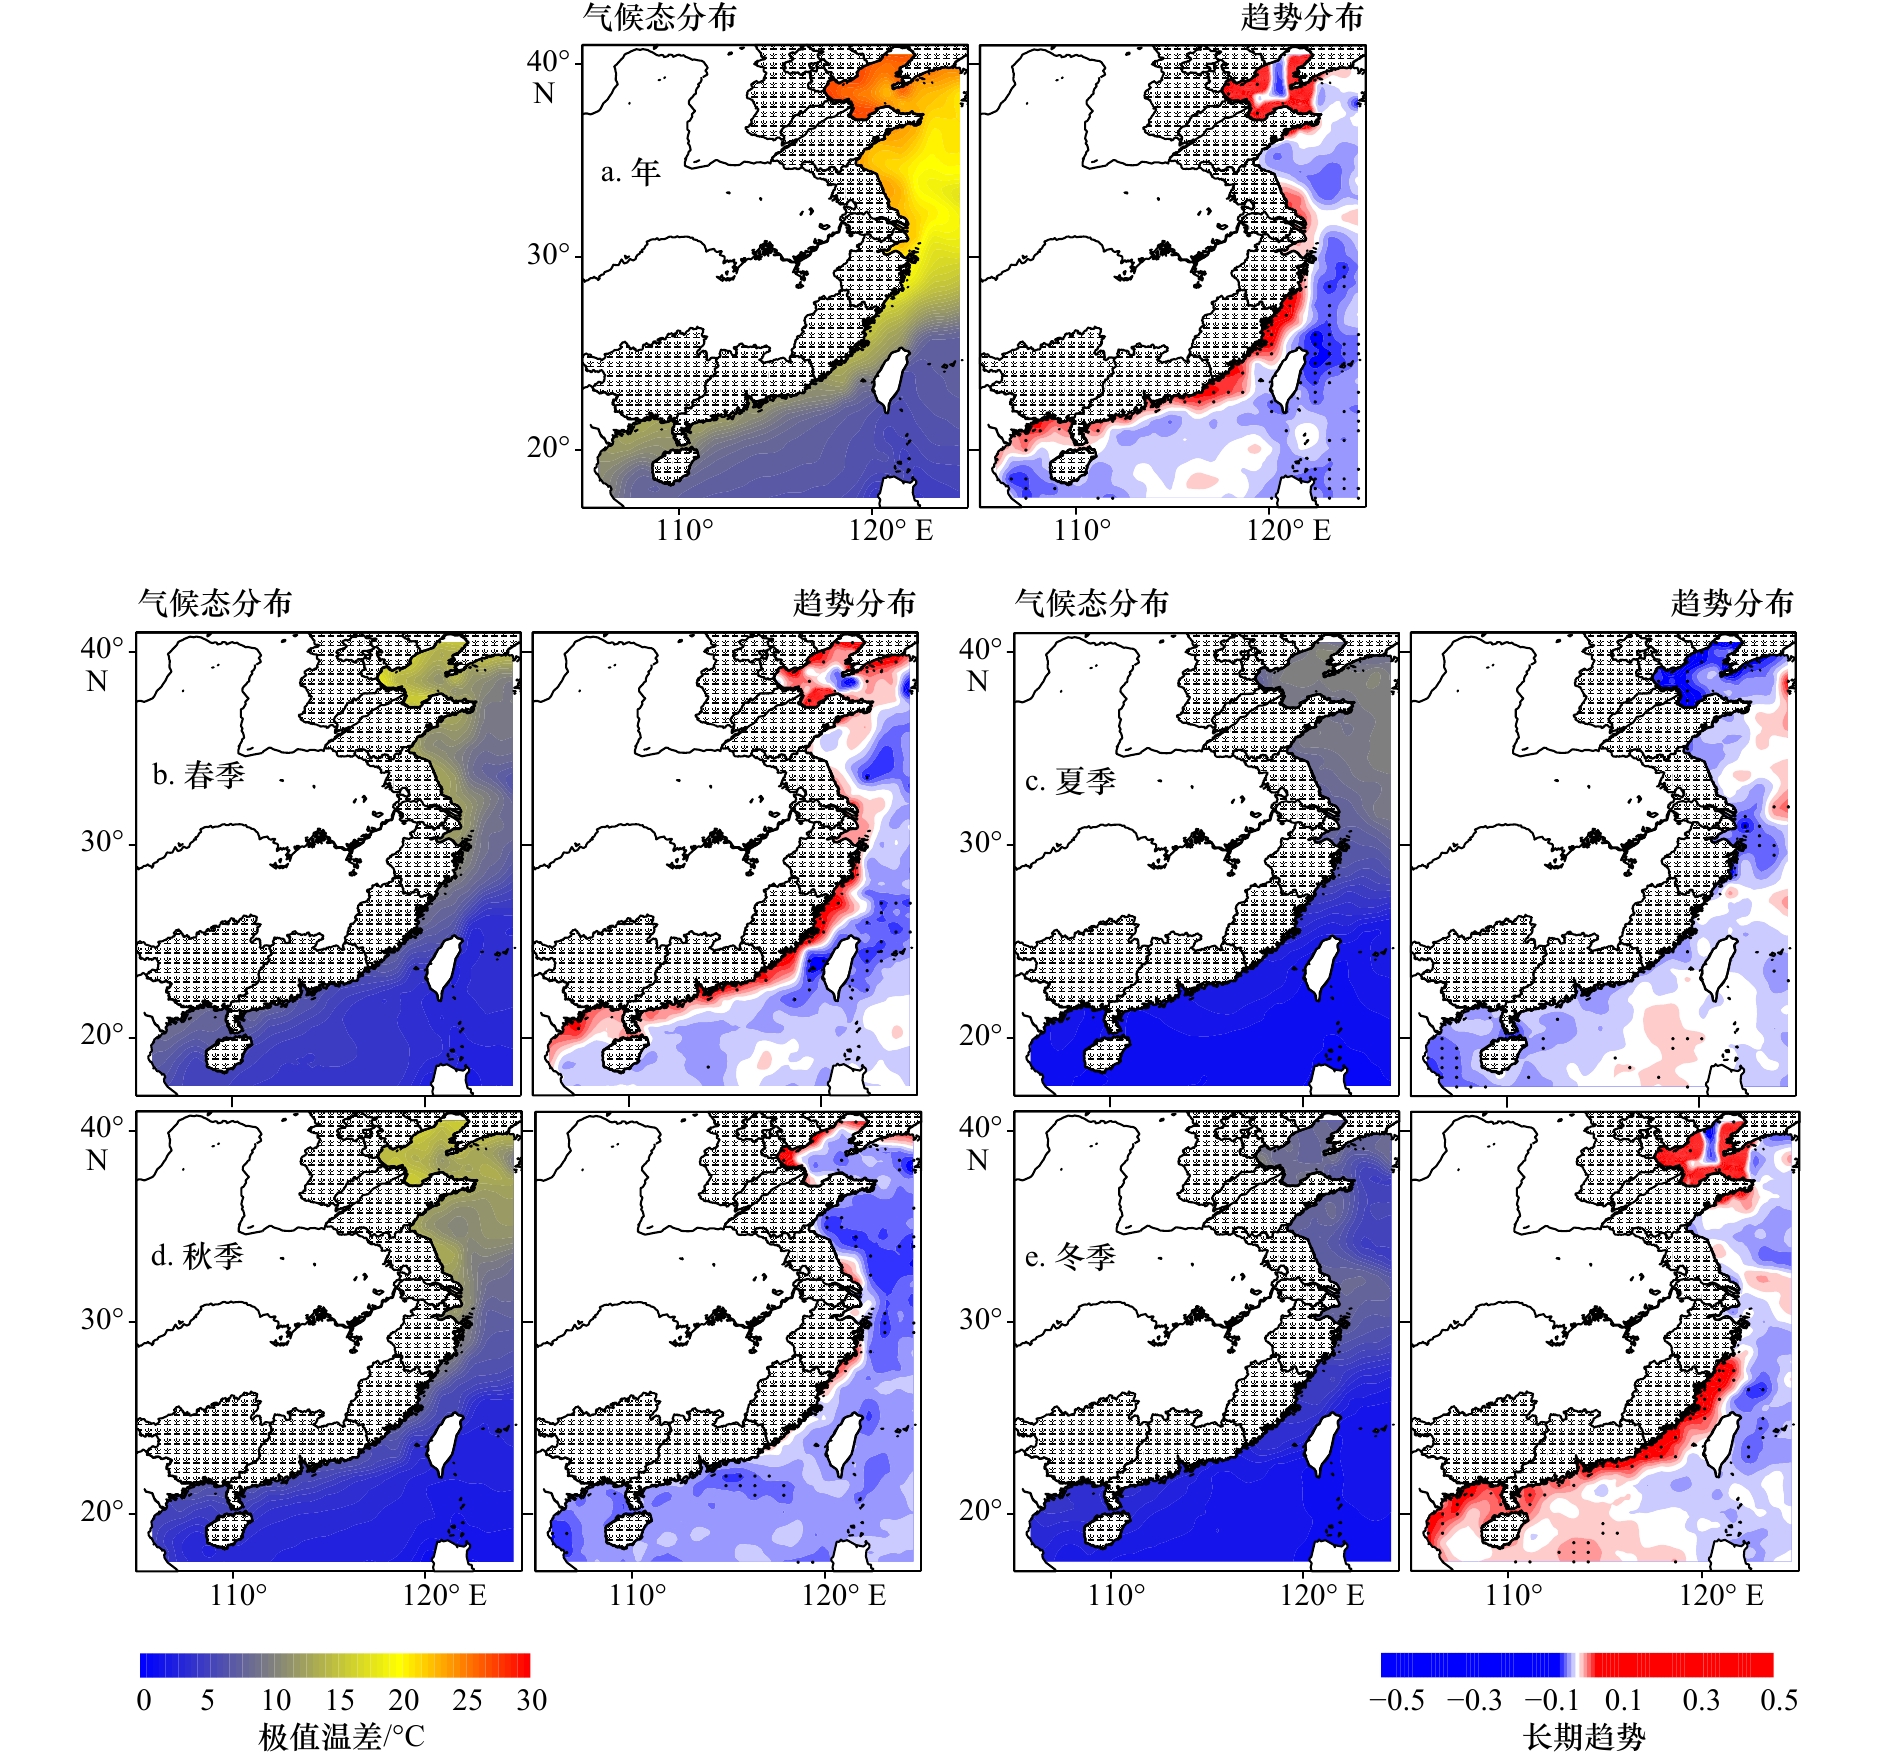
图 2 中国近海海表极值温差气候态(1982–2011年)分布(左)及长期(1982–2017年)变化趋势(右,圆点为超过90%显著性检验的区域)
Fig. 2 Climatic status (1982–2011) distribution (left) of sea surface extreme temperature difference in the coastal China seas and corresponding long-term (1982–2017) trends (right, the dots for stations with more than 90% significance)

图 3 中国近海海表极端高温阈值统计(基准期为1982–2011年)分布(左)及极端事件强度的长期(1982–2017年)变化趋势(右,圆点为超过90%显著性检验的站点)
Fig. 3 Threshold statistics of the extremes (base period: 1982–2011) distribution (left) of sea surface extreme high temperature in the coastal China seas and long-term (1982–2017) trends of the extremes intensity (right, the dots for stations with more than 90% significance)

图 4 中国近海海表极端低温阈值气候态(基准期为1982–2011年)分布(左)及极端事件强度的长期(1982–2017年)变化趋势(右,圆点为超过90%显著性检验的站点)
Fig. 4 Threshold statistics of the extremes (base period: 1982–2011) distribution (left) of sea surface extreme low temperature in the coastal China seas and long-term (1982–2017) trends of the extremes intensity (right, the dots for stations with more than 90% significance)
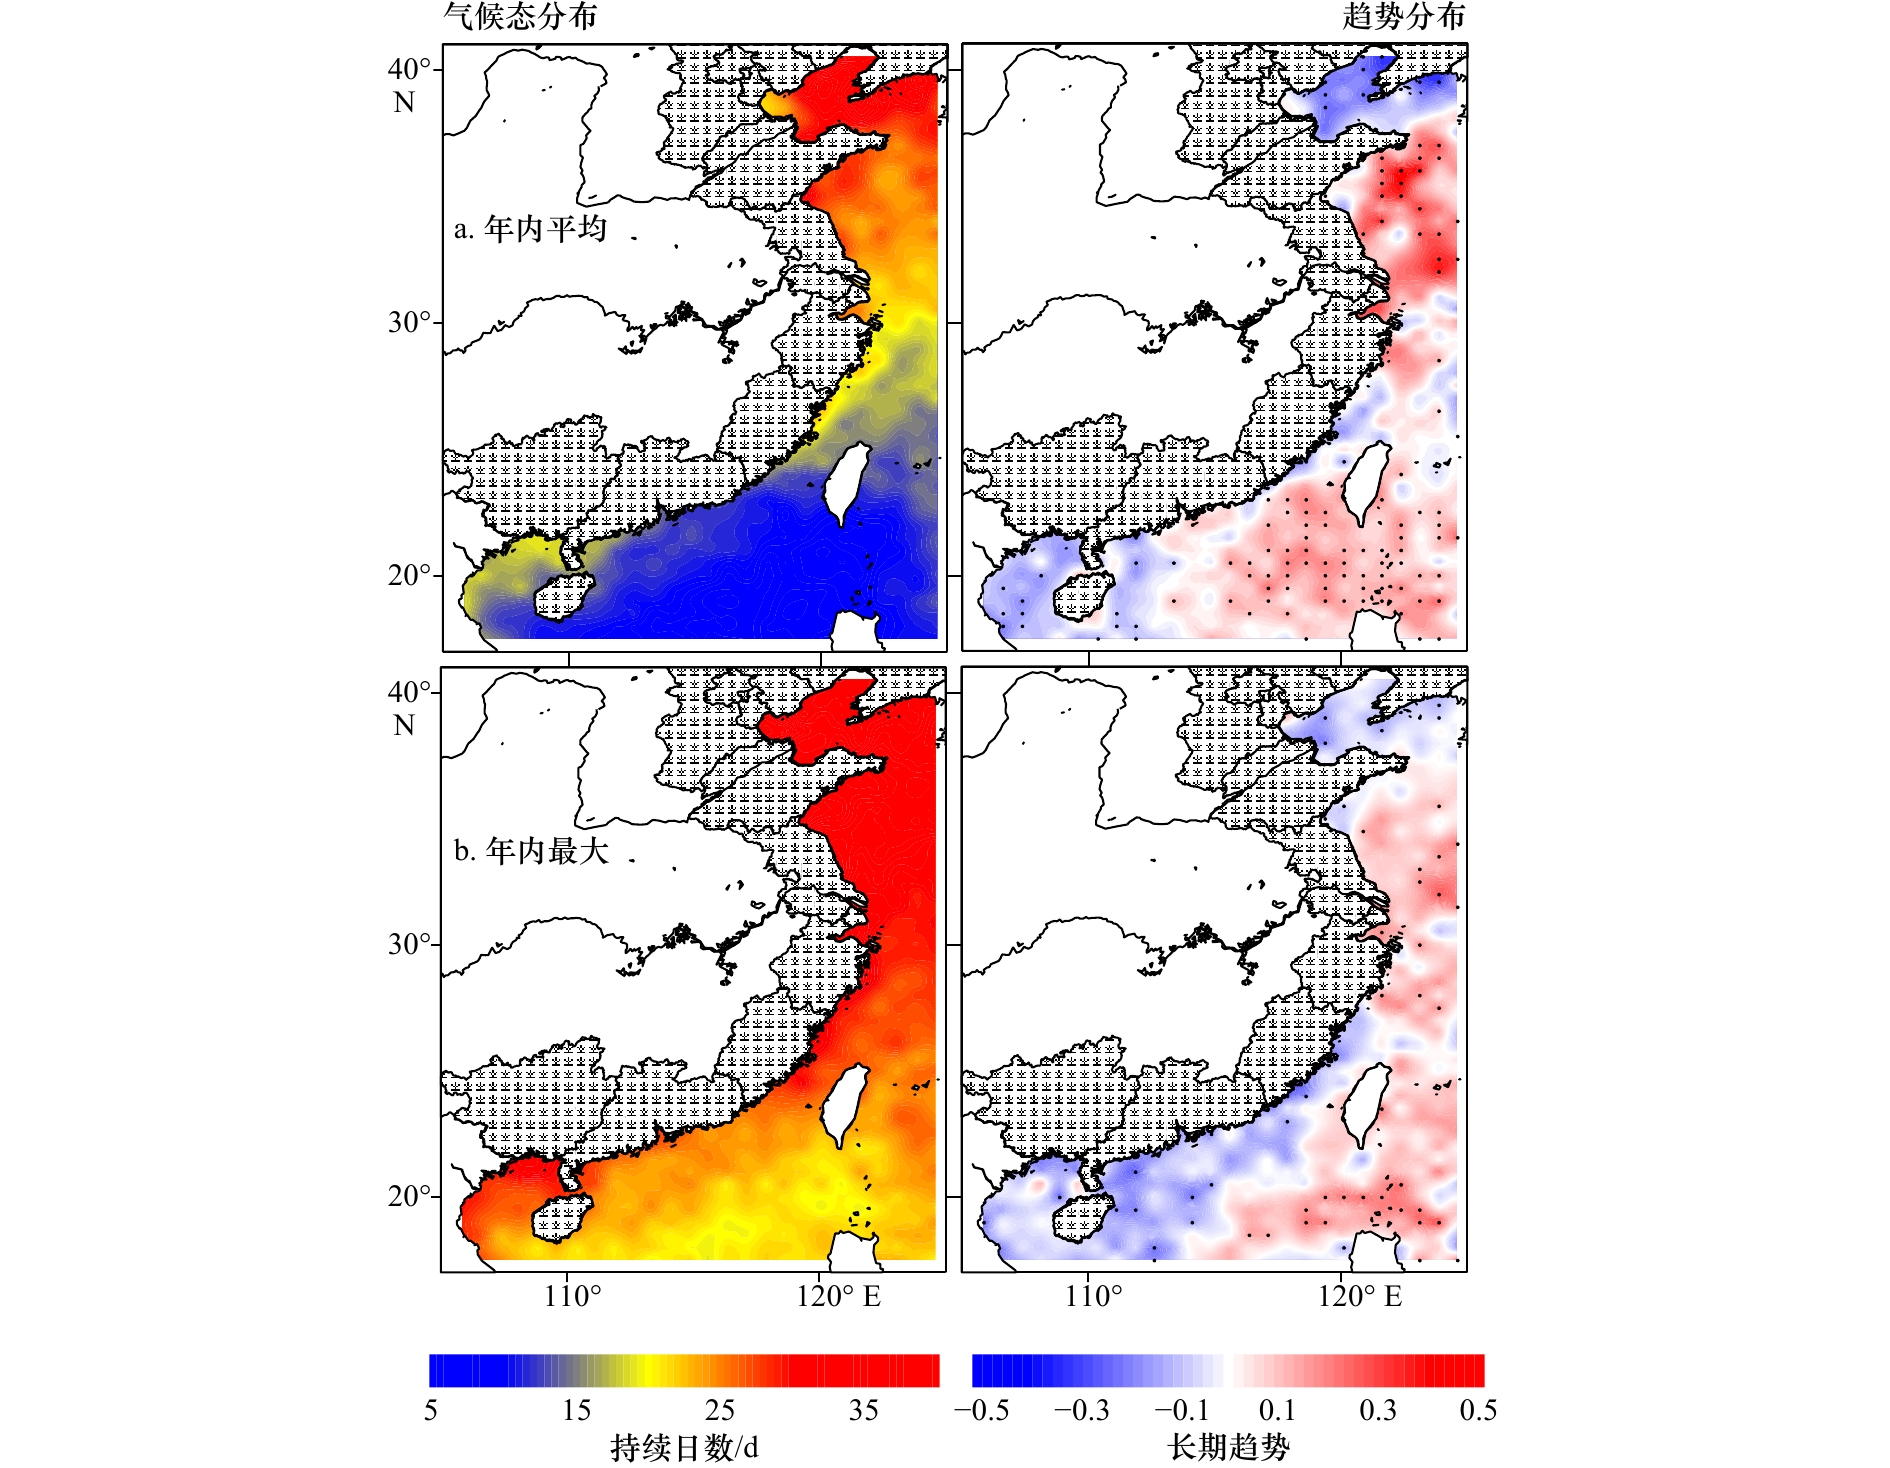
图 5 中国近海海表温度极端高值年内平均(a)和最大(b)持续日数气候态(1982–2011年)分布(左图)及长期(1982–2017年)变化趋势(右图,圆点为超过90%显著性检验的站点)
Fig. 5 Climatic status (1982–2011) distribution (left) of annual mean (a) and maximum (b) consecutive days of sea surface high temperature extremes in the coastal China seas and corresponding long-term (1982–2017) trends (right, the dots for stations with more than 90% significance)

图 6 中国近海海表温度极端低值年内平均(a)和最大(b)持续日数气候态(1982–2011年)分布(左图)及长期(1982–2017年)变化趋势(右图,圆点为超过90%显著性检验的站点)
Fig. 6 Climatic status (1982–2011) distribution (left) of annual mean (a) and maximum (b) consecutive days of sea surface low temperature extremes in the coastal China seas and corresponding long-term (1982–2017) trends (right, the dots for stations with more than 90% significance)
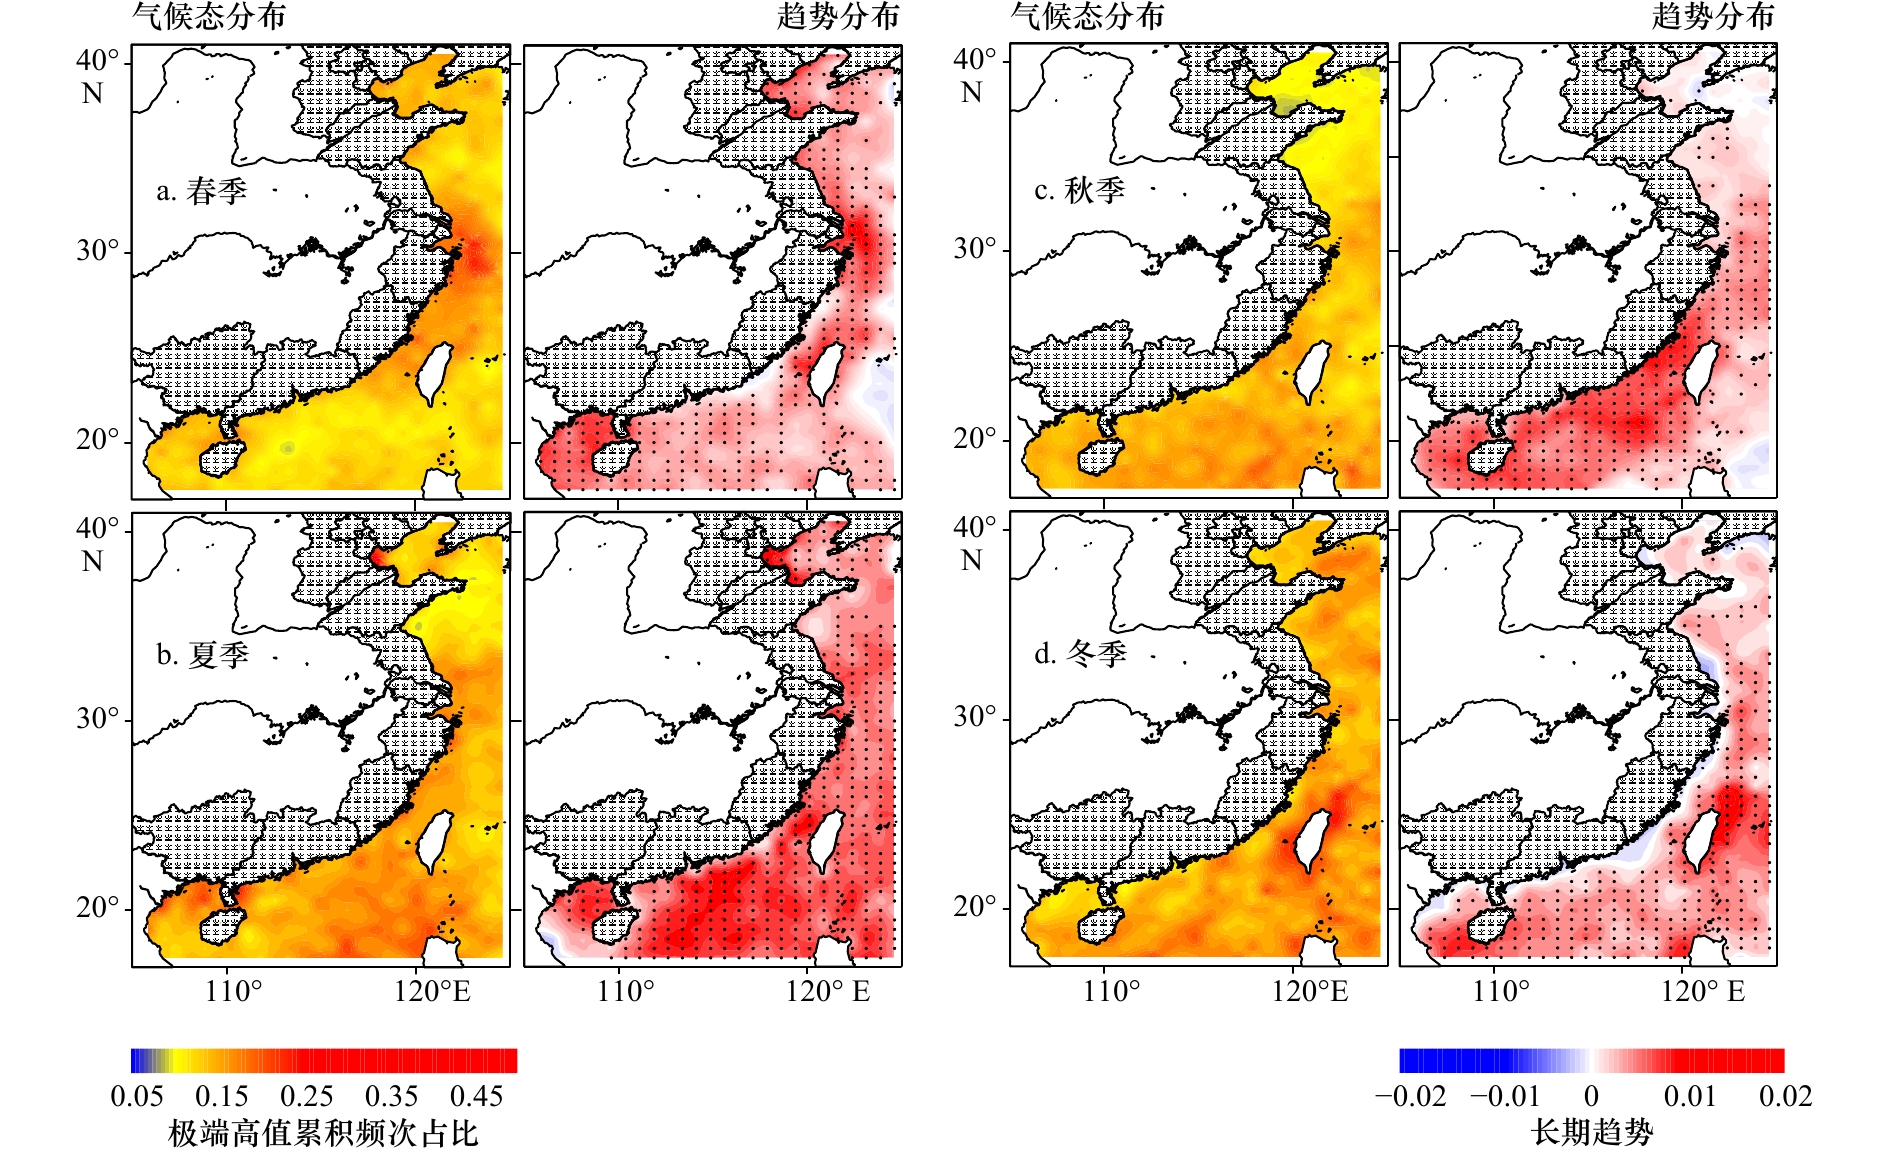
图 7 中国近海海表温度极端高值季节内累积频次占比气候态(1982–2011年)分布(左图)及长期(1982–2017年)变化趋势(右图,圆点为超过90%显著性检验的区域)
Fig. 7 Climatic status (1982–2011) distribution (left) of seasonal fraction above extreme high temperature in the coastal China seas and corresponding long-term (1982–2017) trends (right, the dots for stations with more than 90% significance)
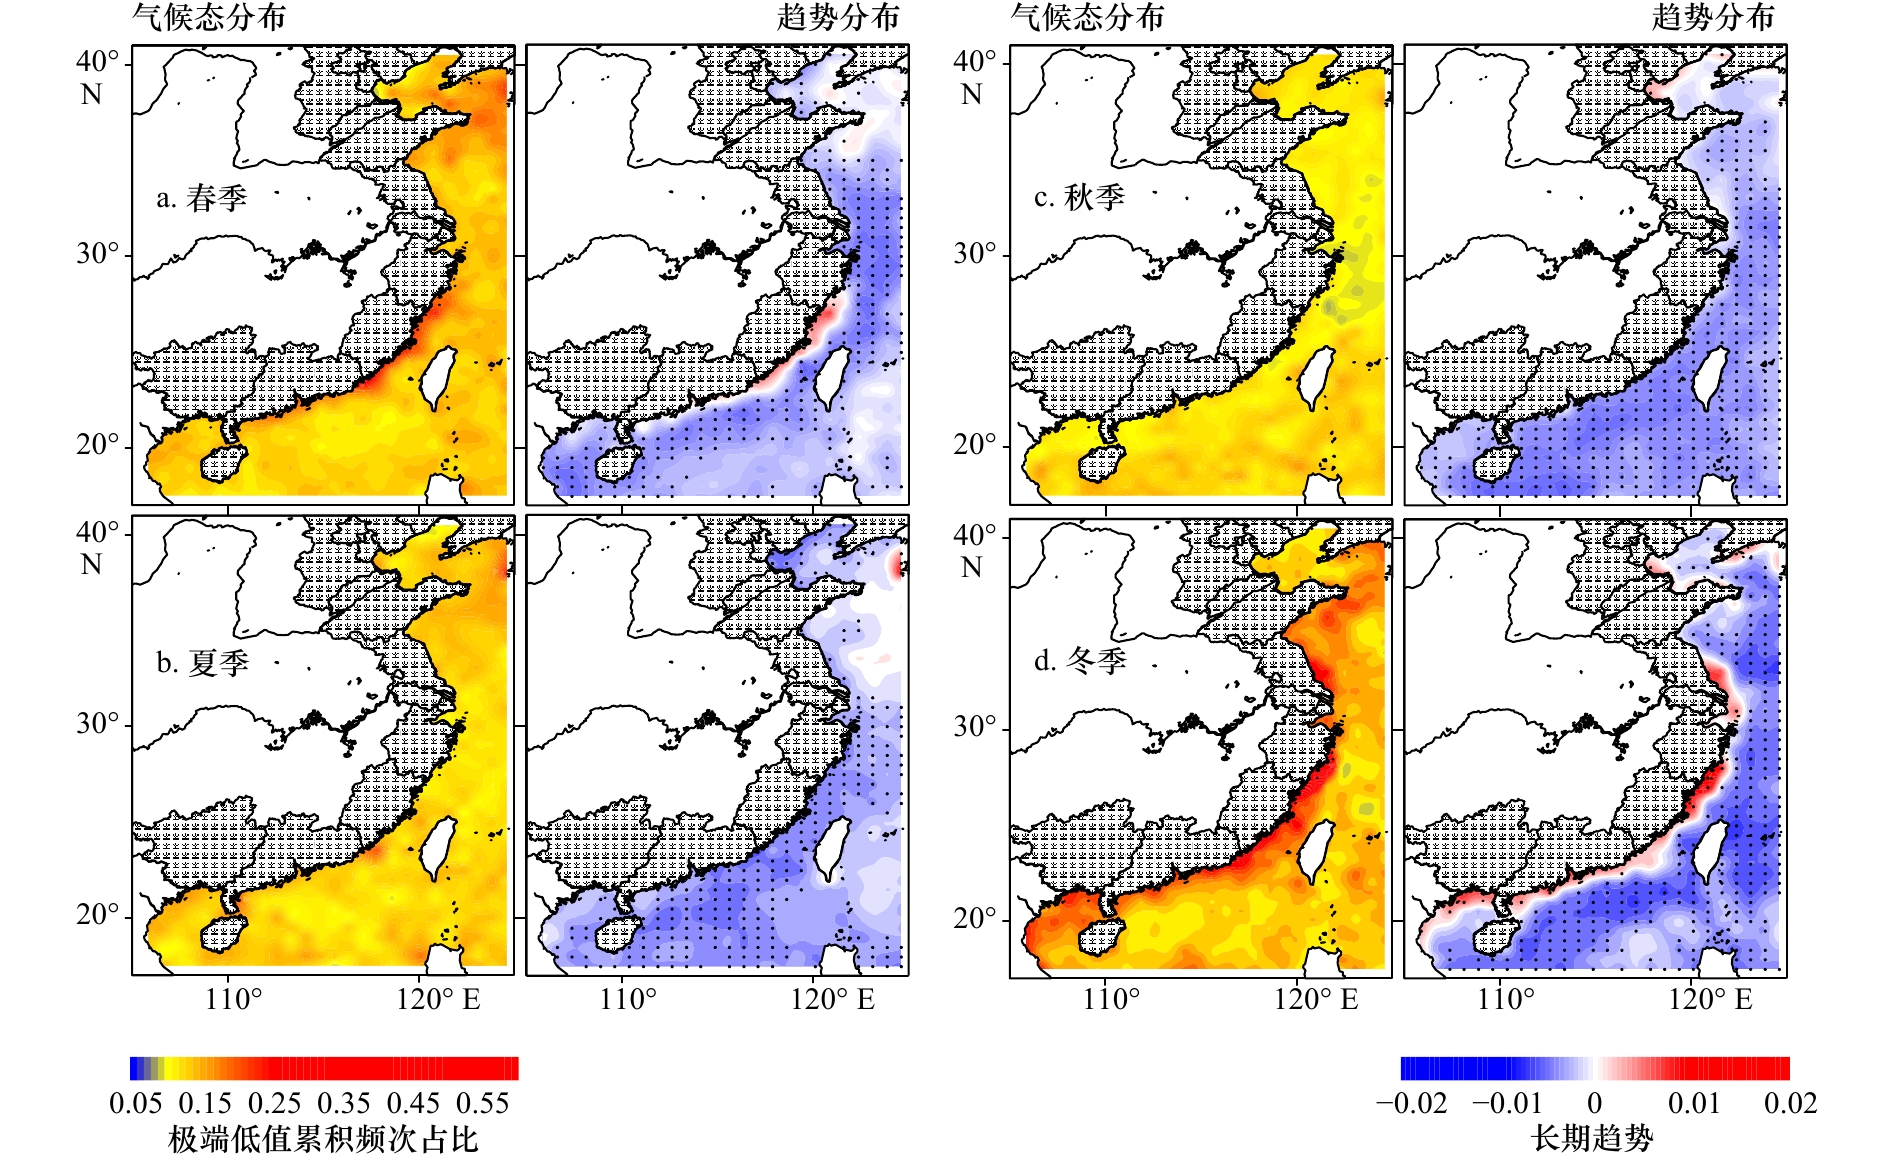
图 8 中国近海海表温度极端高值季节内累积频次占比气候态(1982–2011年)分布(左图)及长期(1982–2017年)变化趋势(右图,圆点为超过90%显著性检验的区域)
Fig. 8 Climatic status (1982–2011) distribution (left) of seasonal fraction above extreme low temperature in the coastal China seas and corresponding long-term (1982–2017) trends (right, the dots for stations with more than 90% significance)
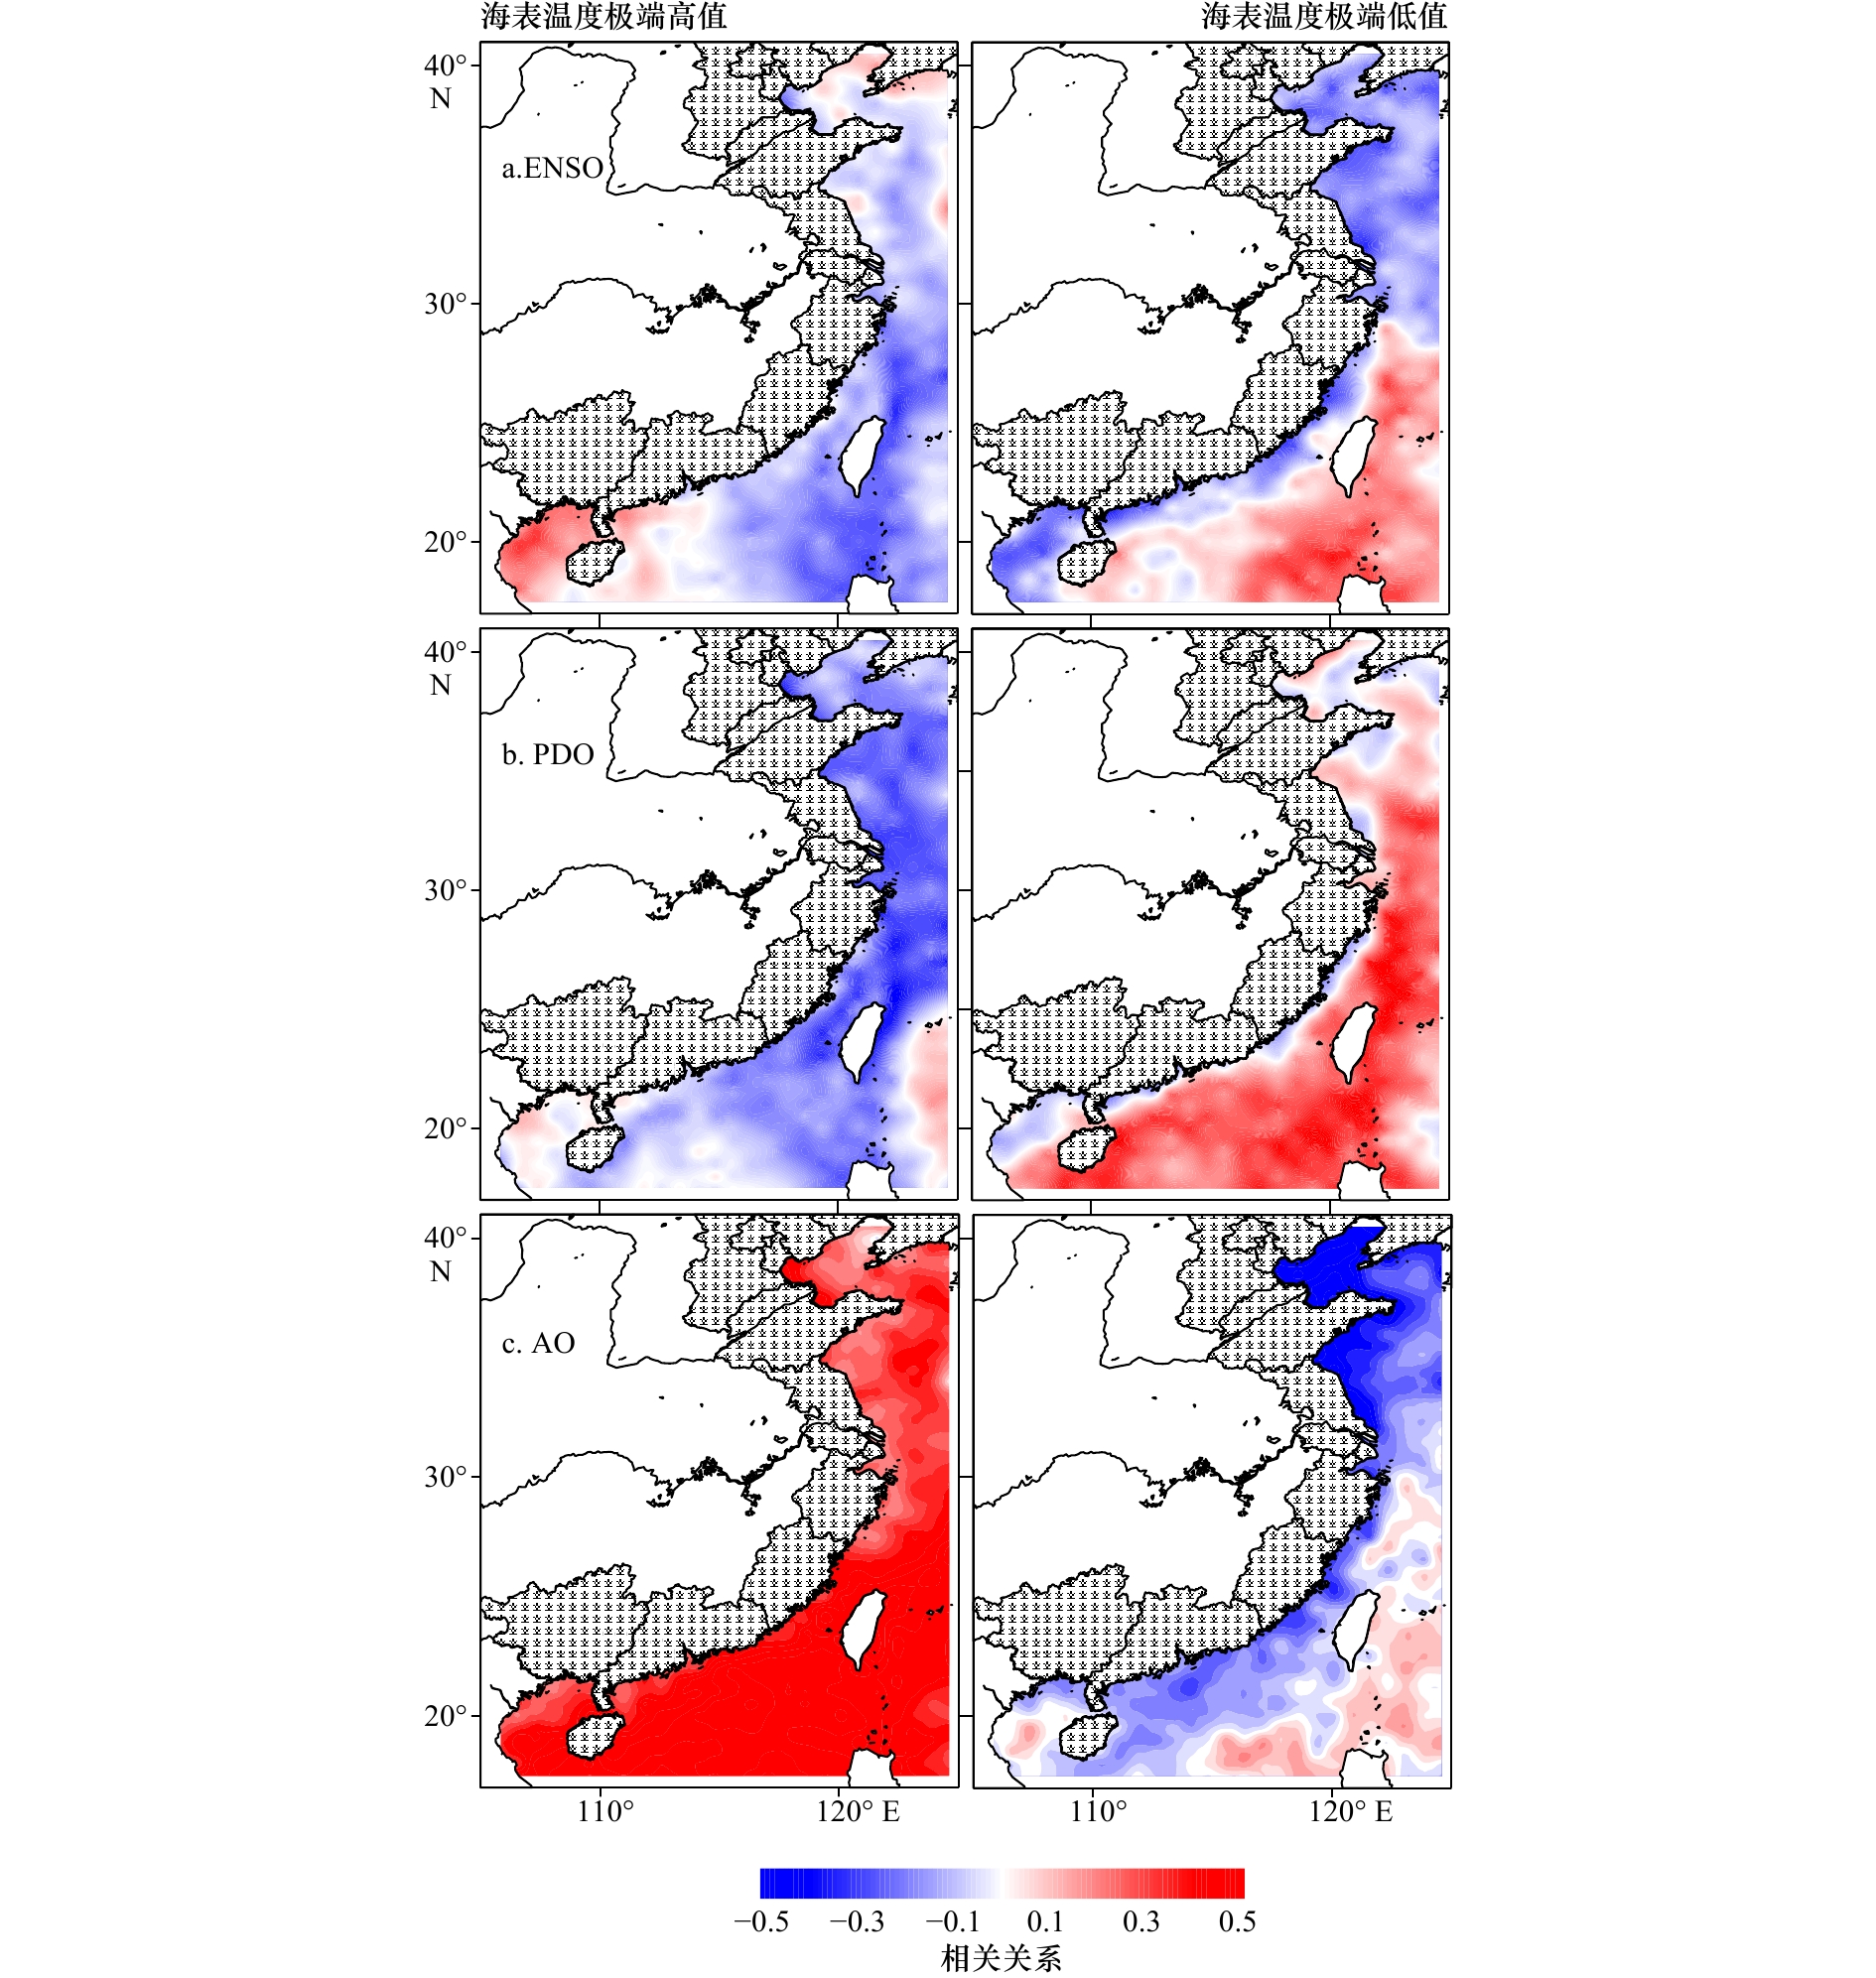
图 9 中国近海海表温度极端高值(左)和极端低值(右)年内日数占比与区域气候变率的相关性分布(彩色区域超过90%的显著性检验)
a.厄尔尼诺-南方涛动;b.太平洋年代际振荡;c.北极涛动
Fig. 9 Correlation matrix between annual fraction of cumulative frequency of sea surface extreme high (left) and low (right) temperature in the coastal China seas and regional climate variabilities with significance exceeding 90%
a. ENSO; b. PDO; c. AO
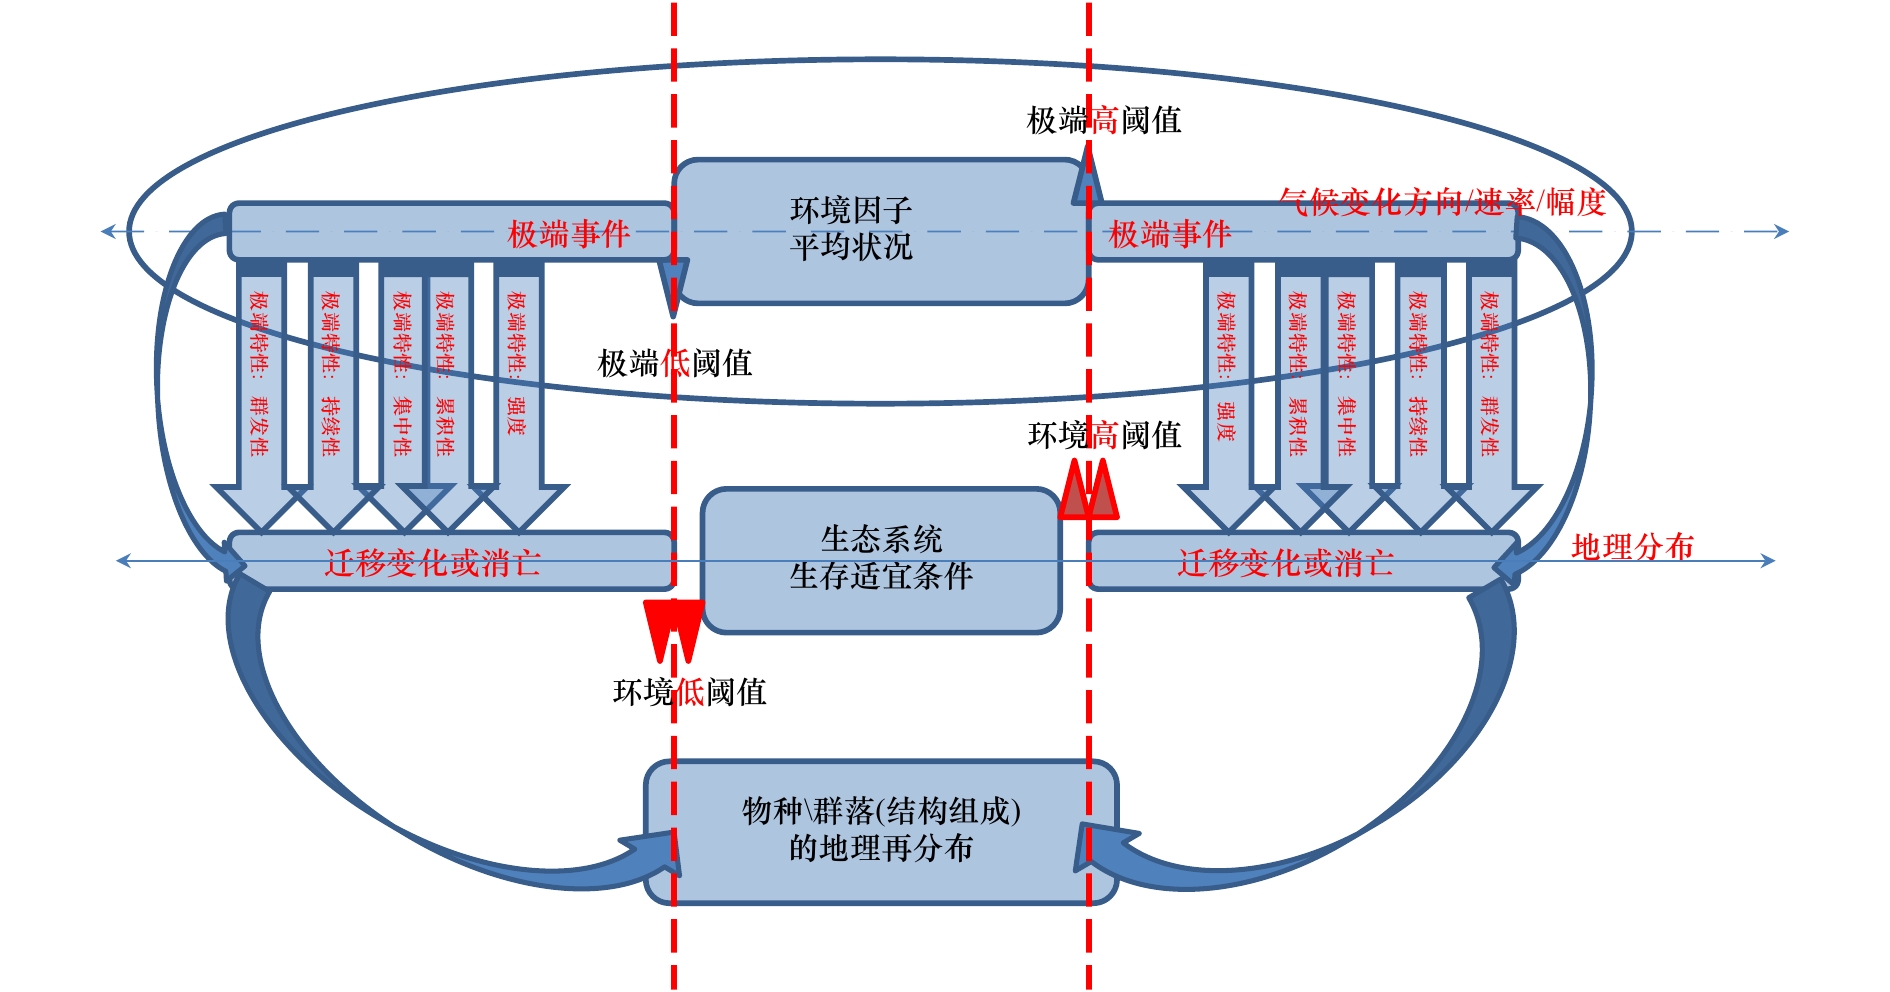
图 10 全球变化下区域海洋环境要素变化的极端特性及影响示意图
Fig. 10 Schematic diagram on the climatic extremes of regional marine environmental factors and its impactions under global change
表 1 海表温度极端特性的气候指数
Tab. 1 The climatic index of extremes for sea surface temperature
极端气候事件(指标) 指数类型 指数名称 单位 海表温度 平均状况 海表温度 ℃ 海表温度较差(极值温差) 极端特性(强度) 第90%百分位海表温度(极端高阈值) 高于第90%百分位海表温度均值(强度) 第10%百分位为海表温度(极端低阈值) 低于第10%百分位海表温度均值(强度) 极端特性(持续性) 高于极端高阈值的平均持续日数 日数 高于极端高阈值的最大持续日数 低于极端低阈值的平均持续日数 低于极端低阈值的最大持续日数 极端特性(累计频次) 极端高海温日数的占比 % 极端低海温日数的占比  下载: 导出CSV
-
[1] Hartmann D L, Klein Tank A M G, Rusticucci M, et al. IPCC, Climate Change 2013: the Physical Science Basis, Contribution of Working Group I to the Fifth Assessment Report of the Intergovernmental Panel on Climate Change[M]. Cambridge, United Kingdom, New York, USA: Cambridge University Press, 2013. [2] Field C B, Barros V, Stocker T F, et al. IPCC, 2012: Managing the Risks of Extreme Events and Disasters to Advance Climate Change Adaptation[M]. Cambridge, UK, New York, NY, USA: Cambridge University Press, 2012. [3] 齐庆华, 蔡榕硕, 张启龙. 台湾以东黑潮经向热输送变异及可能的气候效应[J]. 海洋学报, 2012, 34(5): 31−38.Qi Qinghua, Cai Rongshuo, Zhang Qilong. Heat transport variability of the Kuroshio east of Taiwan and its possible climatic effect[J]. Haiyang Xuebao, 2012, 34(5): 31−38. [4] 齐庆华, 蔡榕硕. 西太平洋暖池水体振荡与赤道中东太平洋海表温度异常的关联性初探[J]. 海洋科学, 2015, 39(9): 77−85.Qi Qinghua, Cai Rongshuo. The relationship between the oscillation of western Pacific warm pool and sea surface temperature anomalies in equatorial central and eastern Pacific[J]. Marine Sciences, 2015, 39(9): 77−85. [5] 齐庆华, 蔡榕硕. 南海海表温时空演变与南海夏季风爆发早晚相关性初探[J]. 海洋学报, 2014, 36(3): 94−103. doi: 10.3969/j.issn.0253-4193.2014.03.010Qi Qinghua, Cai Rongshuo. The relation between the spatial-temporal evolution of SST in the South China Sea and the earlier or later onset of the South China Sea summer monsoon[J]. Haiyang Xuebao, 2014, 36(3): 94−103. doi: 10.3969/j.issn.0253-4193.2014.03.010 [6] 齐庆华, 蔡榕硕. 21世纪海上丝绸之路海表温度异常与气候变率的相关性初探[J]. 海洋开发与管理, 2017, 34(4): 41−49. doi: 10.3969/j.issn.1005-9857.2017.04.007Qi Qinghua, Cai Rongshuo. Spatio-temporal change of sea surface temperature anomalies in seas of 21st century maritime silk road and its net correlation to climate variability[J]. Ocean Development and Management, 2017, 34(4): 41−49. doi: 10.3969/j.issn.1005-9857.2017.04.007 [7] 齐庆华, 蔡榕硕. 中国大陆东部相对湿度变化与海陆热力差异的关联性初探[J]. 高原气象, 2017, 36(6): 1587−1594.Qi Qinghua, Cai Rongshuo. The variation of relative humidity in the east of Chinese mainland and its association with sea-land thermal contrast[J]. Plateau Meteorology, 2017, 36(6): 1587−1594. [8] Cai Rongshuo, Tan Hongjian, Qi Qinghua. Impacts of and adaptation to inter-decadal marine climate change in coastal China seas[J]. International Journal of Climatology, 2016, 36(11): 3770−3780. doi: 10.1002/joc.2016.36.issue-11 [9] Wu Lixin, Cai Wenju, Zhang Liping, et al. Enhanced warming over the global subtropical western boundary currents[J]. Nature Climate Change, 2012, 2(3): 161−166. doi: 10.1038/nclimate1353 [10] 谭红建, 蔡榕硕, 黄荣辉. 中国近海海表温度对气候变暖及暂缓的显著响应[J]. 气候变化研究进展, 2016, 12(6): 500−507.Tan Hongjian, Cai Rongshuo, Huang Ronghui. Enhanced responses of sea surface temperature over offshore China to global warming and hiatus[J]. Climate Change Research, 2016, 12(6): 500−507. [11] 秦大河. 中国极端天气气候事件和灾害风险管理与适应国家评估报告[M]. 北京: 科学出版社, 2015.Qin Dahe. China National Assessment Report on Risk Management and Adaptation of Climate Extremes and Disasters[M]. Beijing: Science Press, 2015. [12] Hobday A J, Alexander L V, Perkins S E, et al. A hierarchical approach to defining marine heatwaves[J]. Progress in Oceanography, 2016, 141: 227−238. doi: 10.1016/j.pocean.2015.12.014 [13] Zinke J, Hoell A, Lough J M, et al. Coral record of southeast Indian Ocean marine heatwaves with intensified Western Pacific temperature gradient[J]. Nature Communications, 2015, 6: 8562. doi: 10.1038/ncomms9562 [14] Oliver E C J, Donat M G, Burrows M T, et al. Longer and more frequent marine heatwaves over the past century[J]. Nature Communications, 2018, 9(1): 1324. doi: 10.1038/s41467-018-03732-9 [15] Benthuysen J A, Oliver E C J, Feng Ming, et al. Extreme marine warming across tropical Australia during Austral summer 2015-2016[J]. Journal of Geophysical Research, 2018, 123(2): 1301−1326. [16] Short J, Foster T, Falter J, et al. Crustose coralline algal growth, calcification and mortality following a marine heatwave in Western Australia[J]. Continental Shelf Research, 2015, 106: 38−44. doi: 10.1016/j.csr.2015.07.003 [17] Peck L S, Webb K E, Bailey D M. Extreme sensitivity of biological function to temperature in Antarctic marine species[J]. Functional Ecology, 2004, 18(5): 625−630. doi: 10.1111/fec.2004.18.issue-5 [18] Caputi N, Kangas M, Denham A, et al. Management adaptation of invertebrate fisheries to an extreme marine heat wave event at a global warming hot spot[J]. Ecology and Evolution, 2016, 6(11): 3583−3593. doi: 10.1002/ece3.2016.6.issue-11 [19] Tuckett C A, de Bettignies T, Fromont J, et al. Expansion of corals on temperate reefs: direct and indirect effects of marine heatwaves[J]. Coral Reefs, 2017, 36(3): 947−956. doi: 10.1007/s00338-017-1586-5 [20] Schlegel R W, Oliver E C J, Wernberg T, et al. Nearshore and offshore co-occurrence of marine heatwaves and cold-spells[J]. Progress in Oceanography, 2017, 151: 189−205. doi: 10.1016/j.pocean.2017.01.004 [21] Kurihara Y, Sakurai T, Kuragano T. Global daily sea surface temperature analysis using data from satellite microwave radiometer, satellite infrared radiometer and in-situ observations[J]. Weather Service Bulletin, 2006, 73(S): S1−S18. [22] 范海燕, 滕军, 管磊, 等. NOAA/AVHRR卫星海表温度在西北太平洋的印证及分析[J]. 海洋预报, 2009, 26(2): 7−14. doi: 10.3969/j.issn.1003-0239.2009.02.002Fan Haiyan, Teng Jun, Guan Lei, et al. Validation of sea surface temperature from NOAA/AVHRR in the Northwest Pacific[J]. Marine Forecasts, 2009, 26(2): 7−14. doi: 10.3969/j.issn.1003-0239.2009.02.002 [23] 丁裕国, 江志红. 极端气候研究方法导论(诊断及模拟与预测)[M]. 北京: 气象出版社, 2009.Ding Yuguo, Jiang Zhihong. Introduction to Extreme Climate Research Methods (Diagnosis and Simulation and Prediction)[M]. Beijing: Meteorological Press, 2009. [24] Yan Z, Jones P D, Davies T D, et al. Trends of extreme temperatures in Europe and China based on daily observations[J]. Climatic Change, 2002, 53(1/3): 355−392. doi: 10.1023/A:1014939413284 [25] Karl T R, Nicholls N, Ghazi A. Clivar/GCOS/WMO workshop on indices and indicators for climate extremes workshop summary[J]. Climatic Change, 1999, 42(1): 3−7. doi: 10.1023/A:1005491526870 [26] Peterson T C. Climate change indices[J]. WMO Bulletin, 2005, 54(2): 83−86. [27] Jones P D, Horton E B, Folland C K, et al. The use of indices to identify changes in climatic extremes[J]. Climatic Change, 1999, 42(1): 131−149. doi: 10.1023/A:1005468316392 [28] 钱维宏, 符娇兰, 张玮玮, 等. 近40年中国平均气候与极值气候变化的概述[J]. 地球科学进展, 2007, 22(7): 673−684. doi: 10.3321/j.issn:1001-8166.2007.07.003Qian Weihong, Fu Jiaolan, Zhang Weiwei, et al. Changes in mean climate and extreme cliamte in China during the last 40 years[J]. Advances in Earth Science, 2007, 22(7): 673−684. doi: 10.3321/j.issn:1001-8166.2007.07.003 [29] 李琰, 范文静, 骆敬新, 等. 2017年中国近海海温和气温气候特征分析[J]. 海洋通报, 2018, 37(3): 296−302.Li Yan, Fan Wenjing, Luo Jingxin, et al. Climatic characteristics of sea surface temperature and air temperature over the China seas in 2017[J]. Marine Science Bulletin, 2018, 37(3): 296−302. [30] 蔡榕硕, 付迪. 全球变暖背景下中国东部气候变迁及其对物候的影响[J]. 大气科学, 2018, 42(4): 729−740.Cai Rongshuo, Fu Di. The pace of climate change and its impacts on phenology in eastern China[J]. Chinese Journal of Atmospheric Sciences, 2018, 42(4): 729−740. [31] 齐庆华. 基于国家海洋治理和全球气候变化的我国海洋灾害防治[J]. 海洋开发与管理, 2019, 36(2): 17−23.Qi Qinghua. Marine disaster prevention in China based on national marine governance and global climate change[J]. Ocean Development and Management, 2019, 36(2): 17−23. -

计量
- 文章访问数: 1467
- HTML全文浏览量: 293
- PDF下载量: 526
- 被引次数: 0
