

Automatic extraction of green tide in areas with clouds or solar flares in HY-1C/D CZI multispectral images
-
摘要: 针对多光谱影像受云、雾、太阳耀斑等因素的影响,难以实现高精度的绿潮自动提取的问题,本文以我国的HY-1C/D卫星CZI载荷多光谱影像为数据源,采用数据挖掘技术,通过探索绿潮区域与非绿潮区域的光谱分布差异,提出一种适用于HY-1C/D CZI影像的高精度、全自动绿潮提取方法。首先,分析有云区域和无云区域样本的光谱差异,给出厚云去除规则;其次,选取绿潮和非绿潮区域的样本,采用决策树算法生成绿潮提取规则;然后,针对薄云和厚云边界区域常常会出现误检绿潮的问题,设计了5种错误类别修正策略。为验证方法的有效性,收集2021年黄海区域绿潮暴发周期内的25景HY-1C/D CZI影像,开展绿潮自动检测实验。结果表明,与传统的NDVI方法、VB-FAH方法等指数方法以及ResNet50、U-Net等深度学习方法相比,本文方法在准确度、Kappa系数、F1-Score和MIoU等指标上均优于其他方法,而且能够实现在厚云、薄云、无云、云斑和耀斑区域复杂情况下的绿潮的高精度自动提取。Abstract: Multispectral images are greatly affected by factors such as clouds, fog, and solar flares, which makes it difficult to automatically extract high-precision green tides under complex weather conditions. Based on the multi-spectral images of my country’s HY-1C/D satellite CZI payload, using data mining technology to explore the difference in data distribution between green tide areas and non-green tide areas, we propose a high-precision and fully automatic green tide extraction method , which can be applied to HY-1C/D CZI sensor data. First of all, the thick cloud area is removed by preliminary extraction rules to achieve preliminary classification. Then, the correctly classified green tide samples and non-green tide samples were used as positive and negative samples respectively, and these samples were used as experimental data to train the decision tree model, and the automatic extraction rules of green tide were obtained according to the model. Finally, 5 strategies for correcting misclassifications were designed to achieve fully automatic extraction of green tides. In order to verify the effectiveness of the method, we collected 25 images of the green tide outbreak period in the Yellow Sea in 2021 for automatic detection experiments, and compared the experimental results with traditional index methods (NDVI, VB-FAH) and deep learning methods (ResNet50, U-Net). The results showed that the method outperformed other methods in terms of accuracy, Kappa coefficient, F1-Score, and MIoU. The accuracy of green tide extraction was higher in areas with thick clouds, thin clouds, cloudless clouds, cloud spots, and flares.
-
Key words:
- HY-1C/D satellite /
- green tide extraction /
- decision tree /
- solar flare /
- cloud cover
-
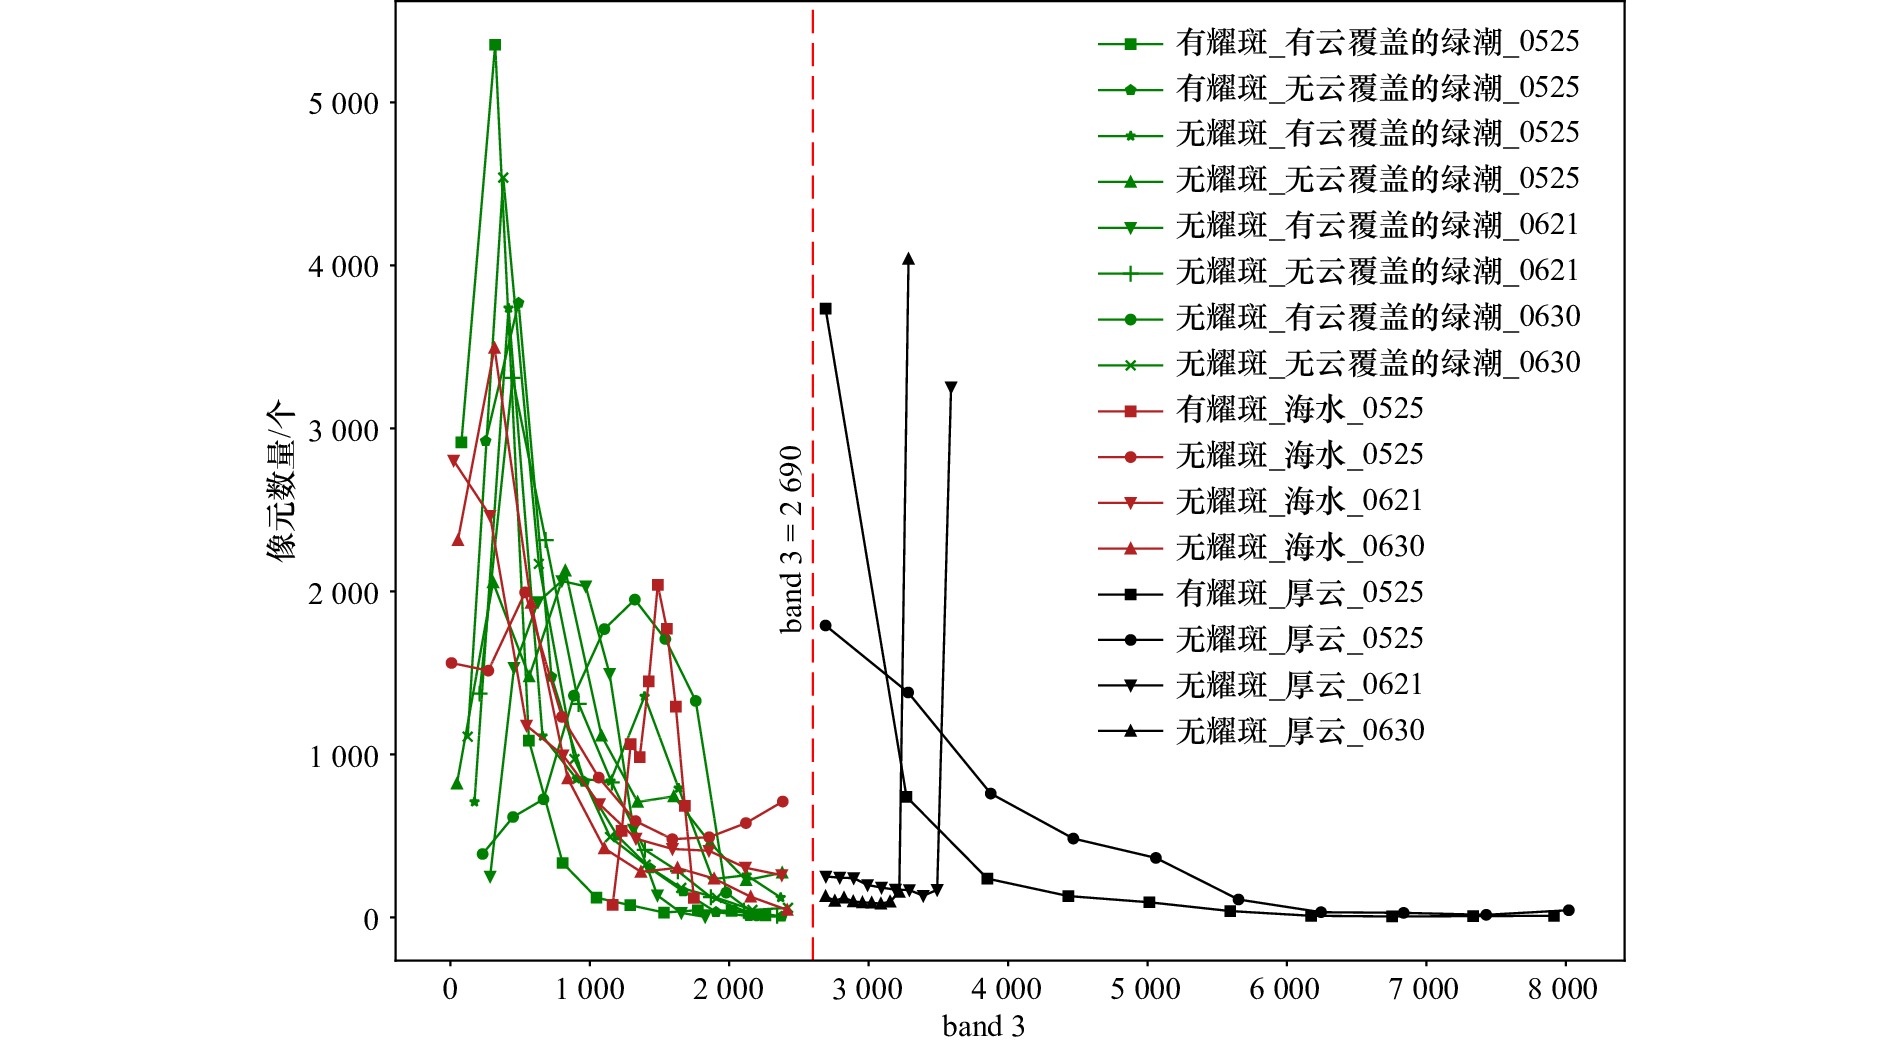
图 1 绿潮、海水、厚云band 3波段的数据分布
数据随机取样自2021年5月25日、6月21日、6月30日HY-1C/D卫星CZI传感器影像;绿潮和海水样本点数量约为10 000个;厚云样本点band 3数据分布过于集中,为便于展示,其数量约为5 000个
Fig. 1 Data distribution of band 3 of green tide, sea water and thick cloud
Data is randomly sampled from the HY-1C/D satellite CZI sensor images on May 25, June 21, and June 30, 2001. The number of green tides and seawater samples is about 10 000. The band 3 data distribution of thick cloud sample points is too centralized to be easily displayed. The number of band 3 is about 5 000
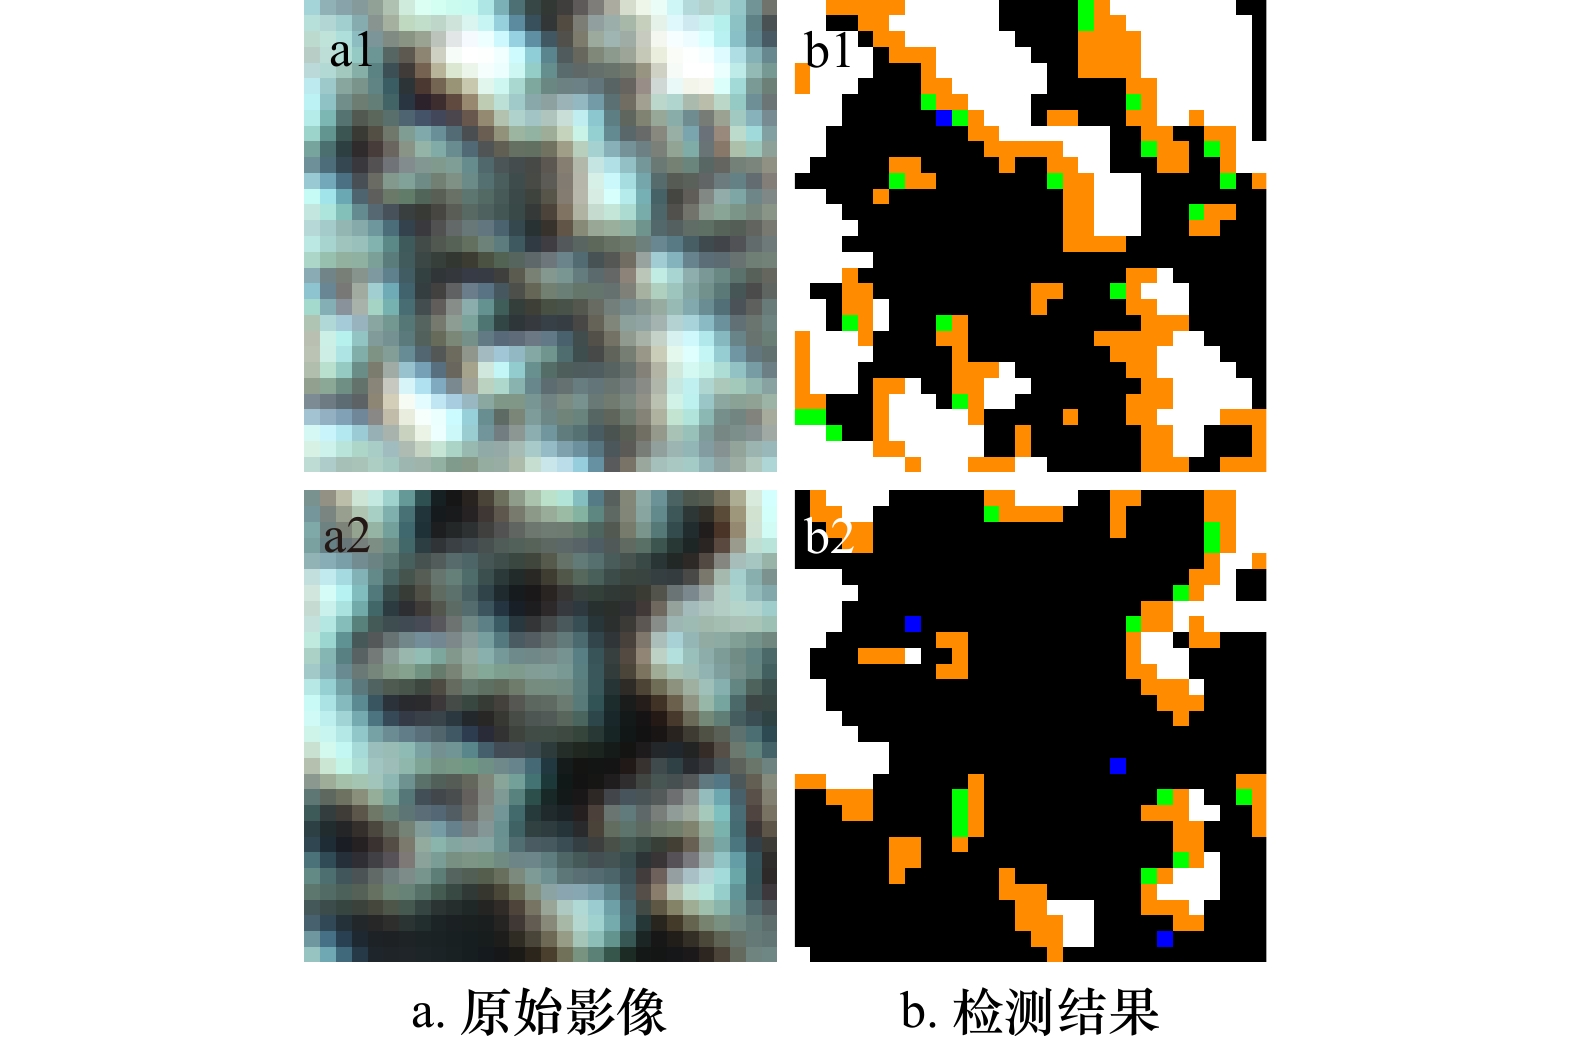
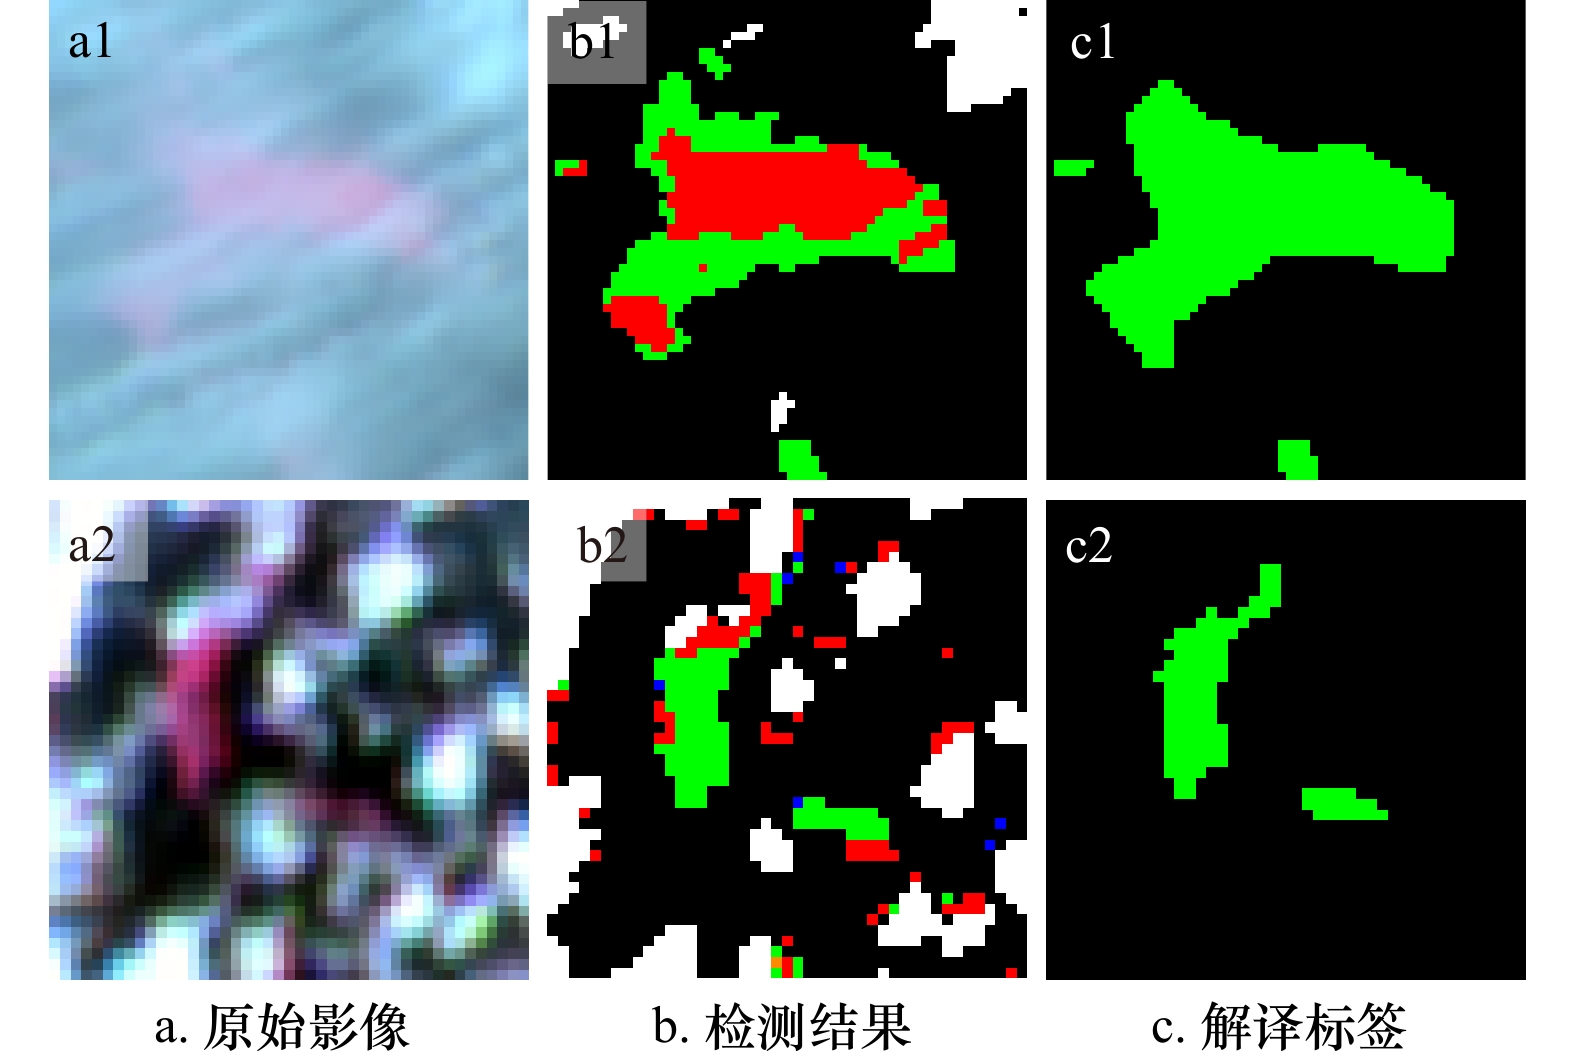
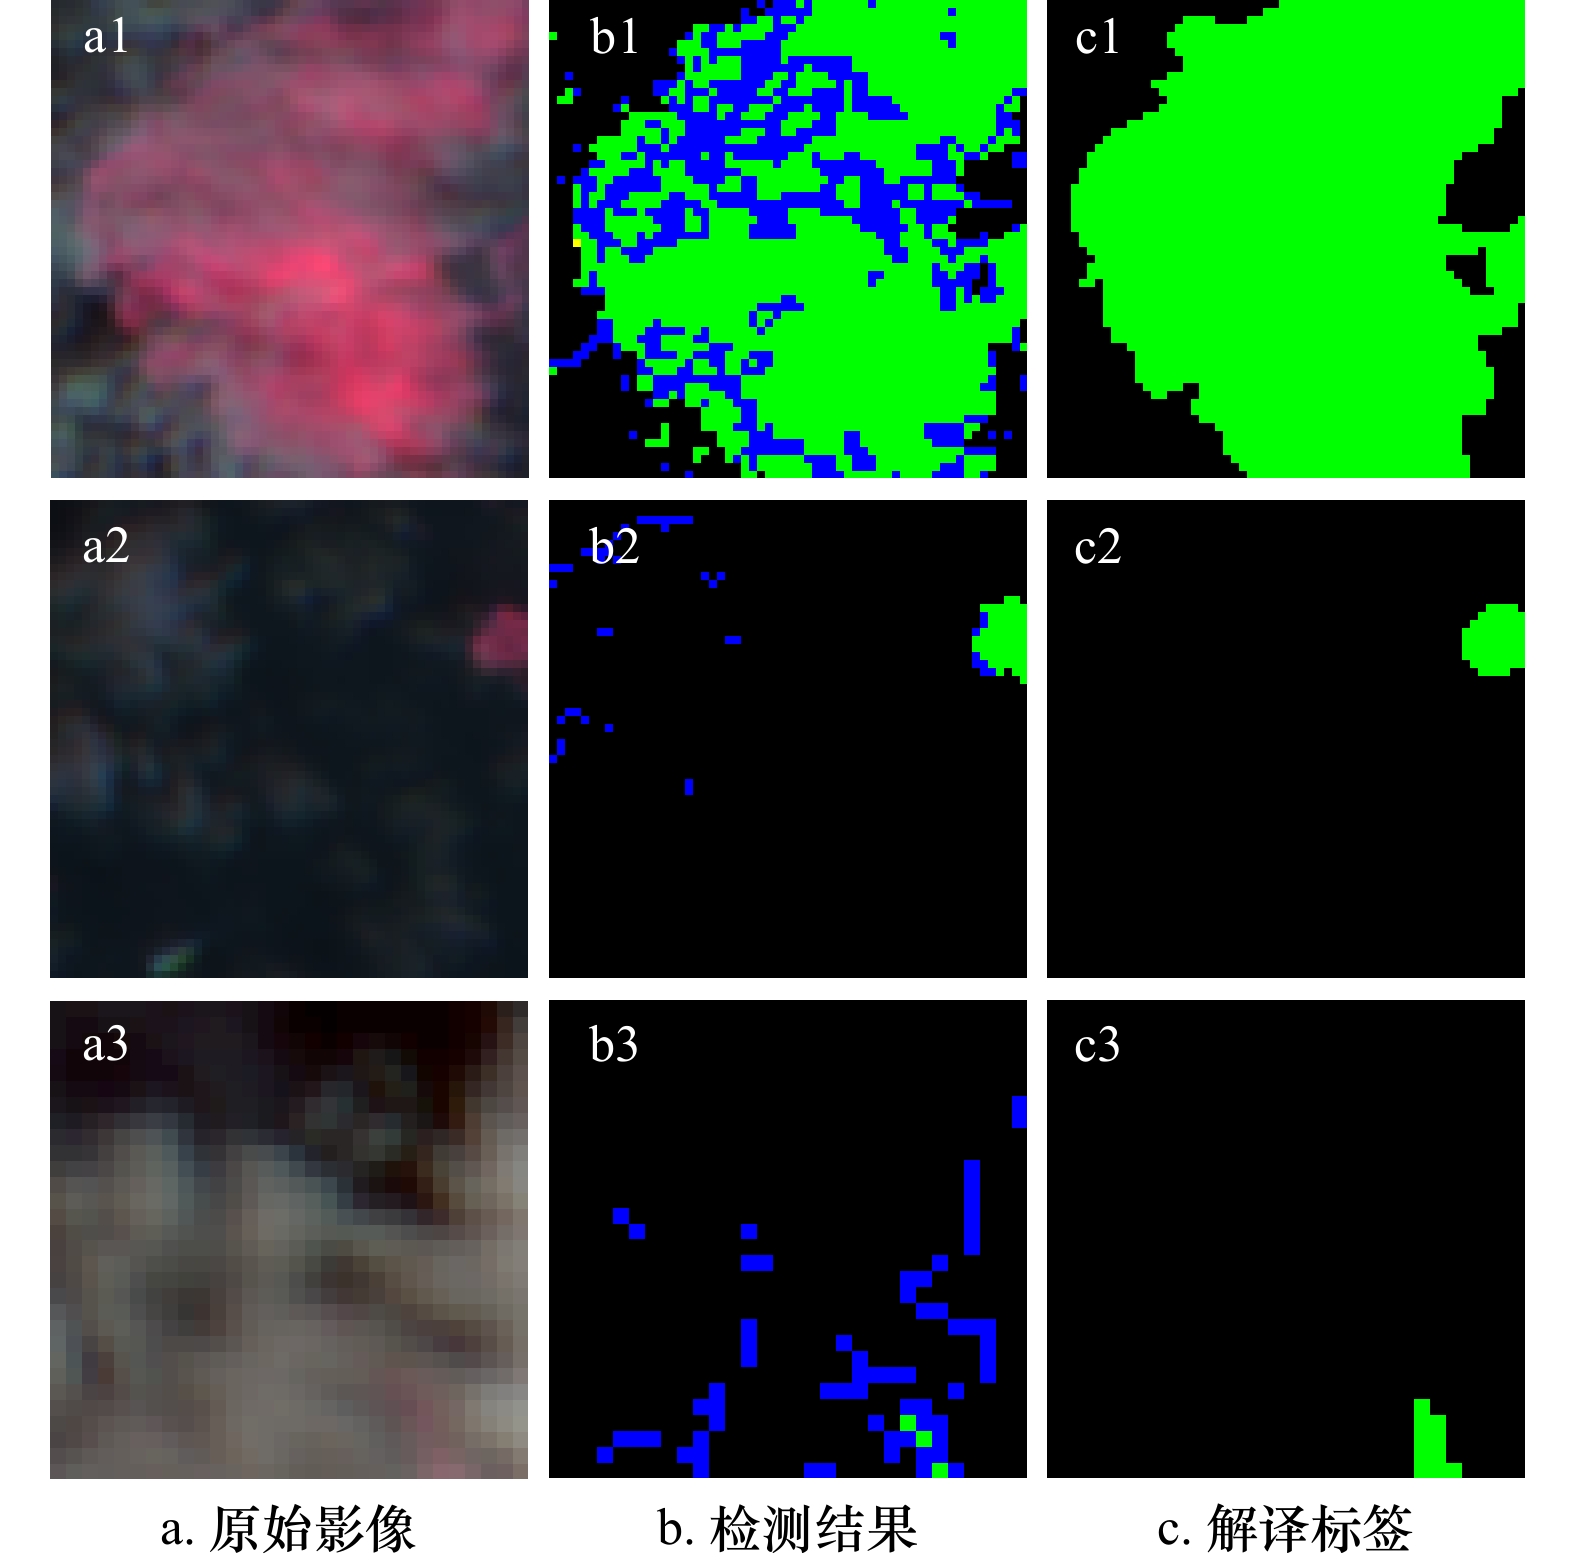
图 5 规则E提取结果(橙色部分)
该区域不存在正确检测的绿潮像元,故未给出人工解译标签
Fig. 5 Rule E extraction results (orange)
There are no properly detected green tide cells in this area, so no artificial interpretation labels are given
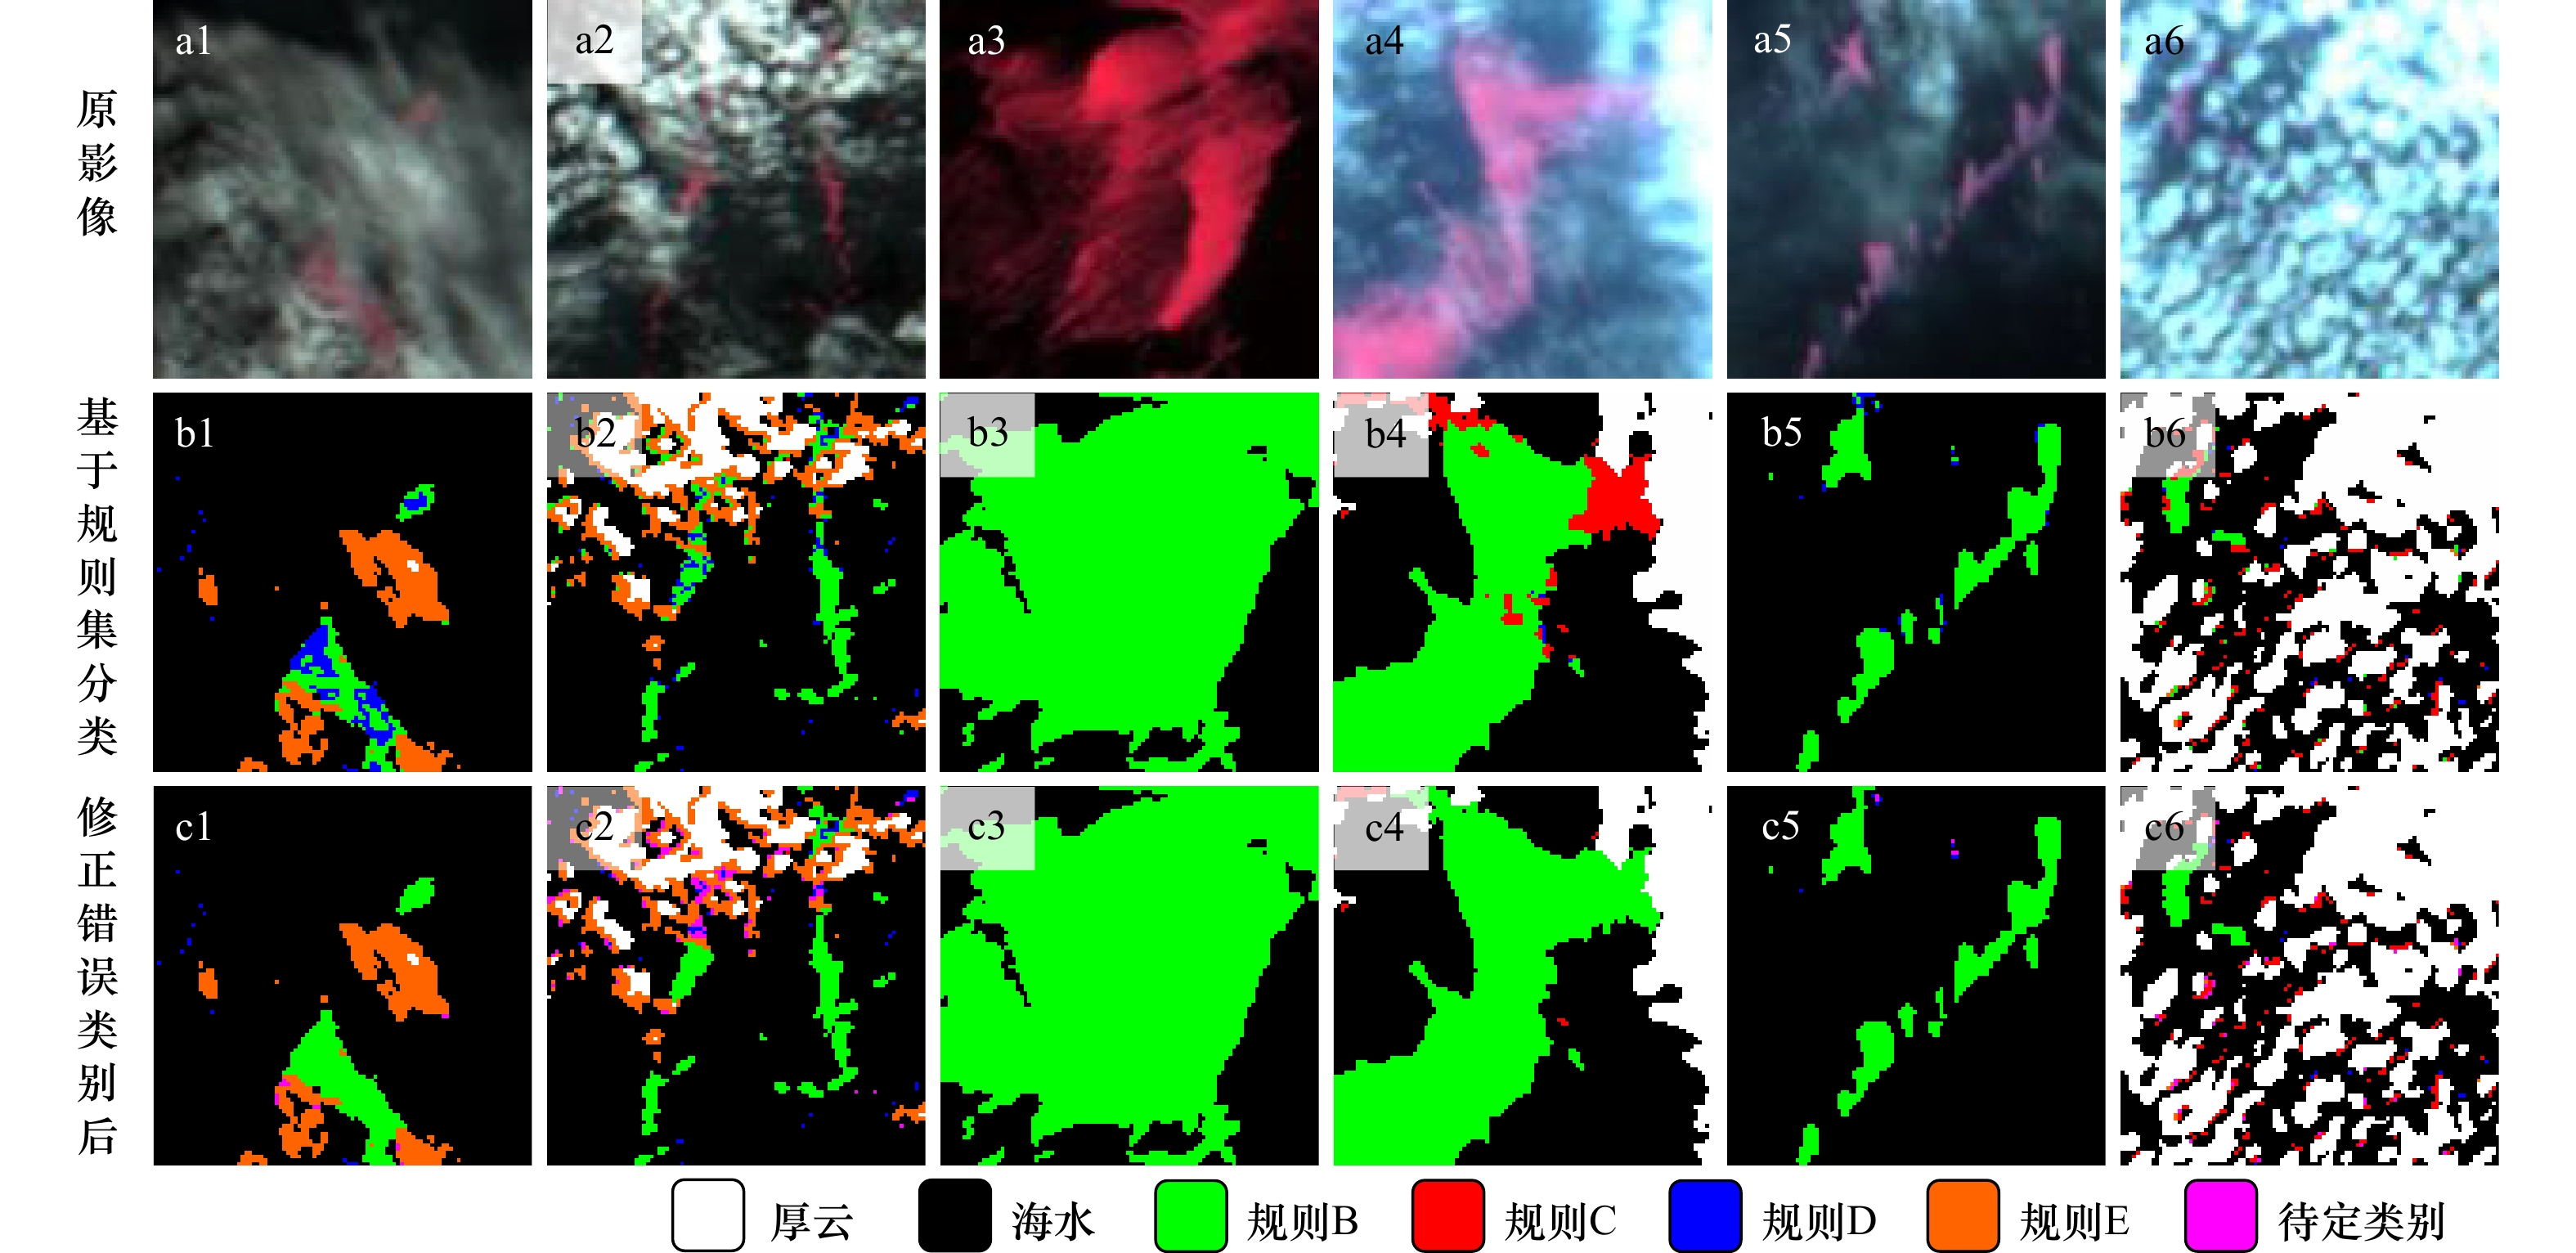
图 7 分类结果对比
a. HY-1C/D卫星CZI传感器RGB合成影像(R:825 nm,G:650 nm,B:560 nm);b. 基于规则集的分类结果;c. 修正错误类别后的分类结果
Fig. 7 Comparison of classification results
a. HY-1C/D satellite CZI sensor RGB synthetic images (R: 825 nm, G: 650 nm, B: 560 nm); b. classification results based on rule sets;c. classification results after correcting error categories

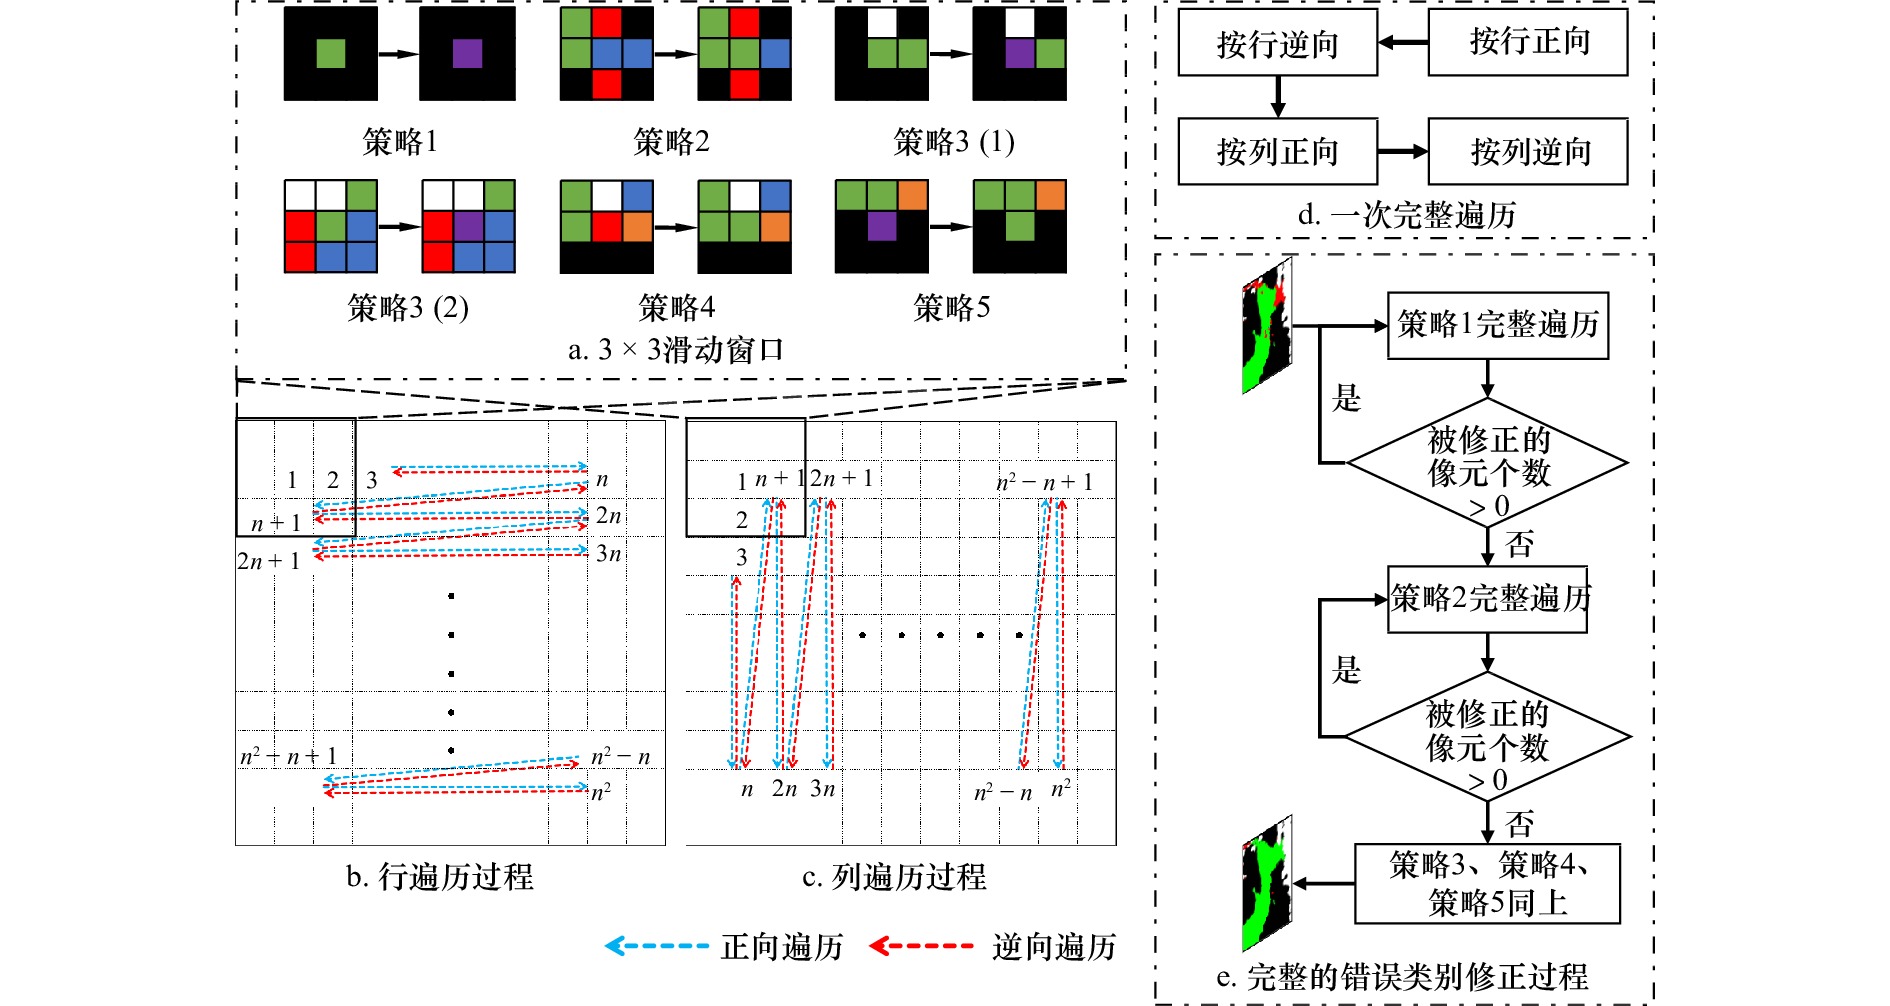
图 8 HY-1C/D CZI影像绿潮全自动提取方法
Fig. 8 Full-automatic extraction method of green tide from HY-1C/D CZI images
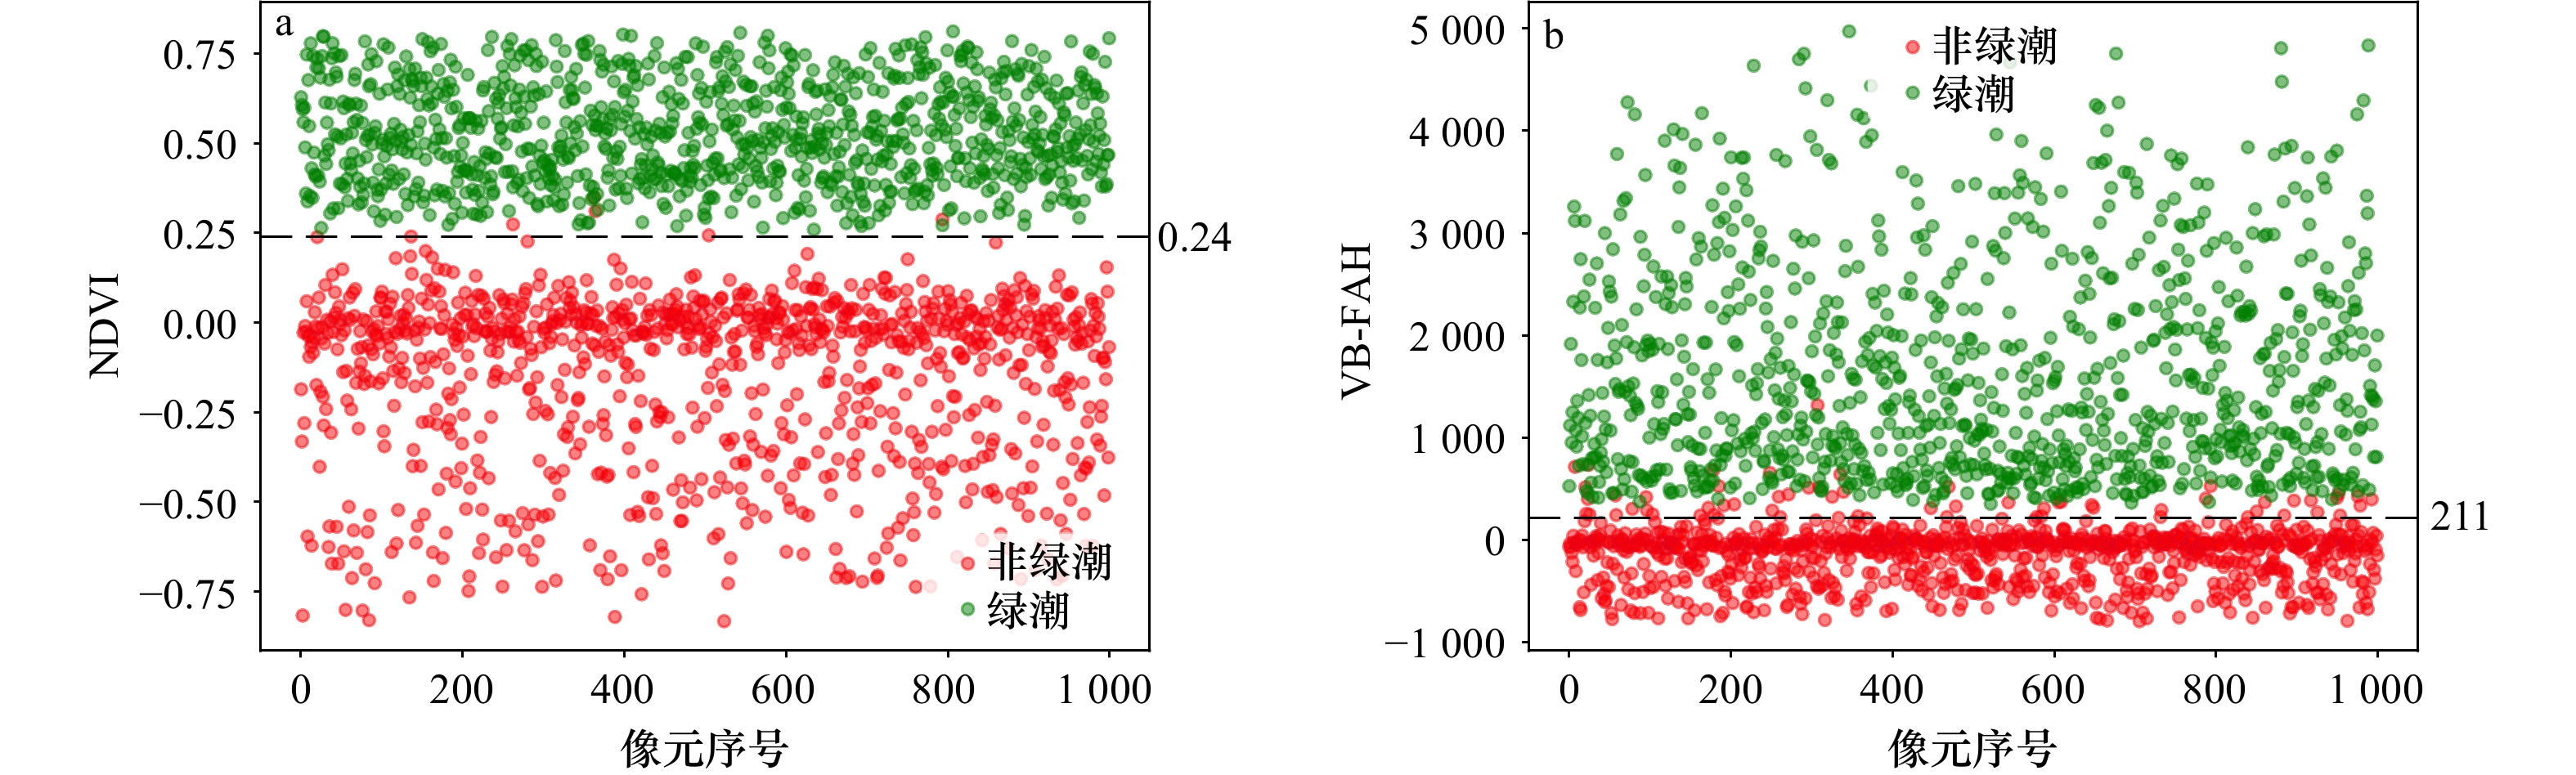
图 9 NDVI和VB-FAH数据散点图
绿潮与非绿潮数据均为随机取样,数量为1 000个
Fig. 9 Scatter plot of NDVI and VB-FAH data
Both green tide and non green tide data are randomly sampled, with a quantity of 1 000
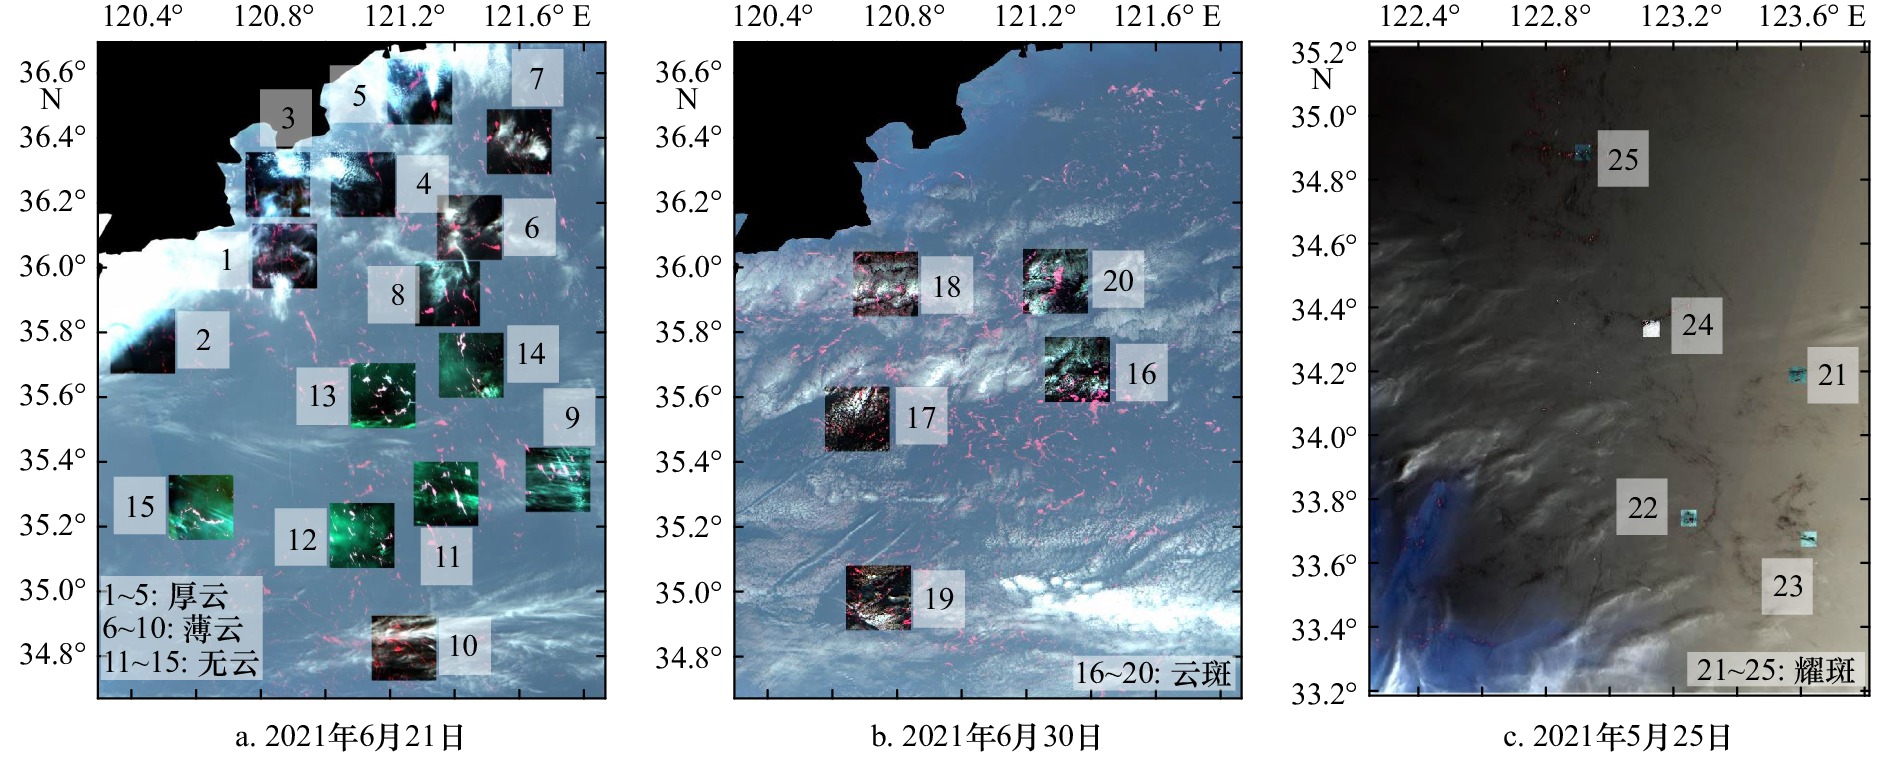
图 10 精度评估区域
a、b、c. HY-1C/D卫星CZI传感器RGB合成影像(R:825 nm,G:650 nm,B:560 nm);区域1至区域20尺寸为400像素 × 400像素;由于耀斑区域中绿潮斑块较零碎,故将区域21至区域25尺寸设定为100像素 × 100像素;每个像素尺寸为50 m × 50 m
Fig. 10 Accuracy evaluation area
a, b, c. HY-1C/D satellite CZI sensor RGB synthetic image (R: 825 nm, G: 650 nm, B: 560 nm); area 1–20 with dimensions of 400 pixels × 400 pixels; due to the fragmented green tide patches in the flare area, the size of the area 21–25 is set to 100 pixels × 100 pixels; each pixel size is 50 m × 50 m

图 11 厚云区域绿潮提取效果对比
a. HY-1C/D卫星CZI传感器RGB合成影像(R:825 nm,G:650 nm,B:560 nm);b、c、d、e、f、g分别为人工解译、NDVI、VB-FAH、ResNet50、U-Net、本文方法的绿潮提取结果
Fig. 11 Comparison of green tide extraction effects in thick cloud region
a. RGB composite image (R: 825 nm, G: 650 nm, B: 560 nm) of HY-1C/D satellite CZI sensor; b, c, d, e, f, g show the green tide extraction results of manual interpretation, NDVI, VB-FAH, ResNet50, U-Net, and the method proposed in this paper, respectively
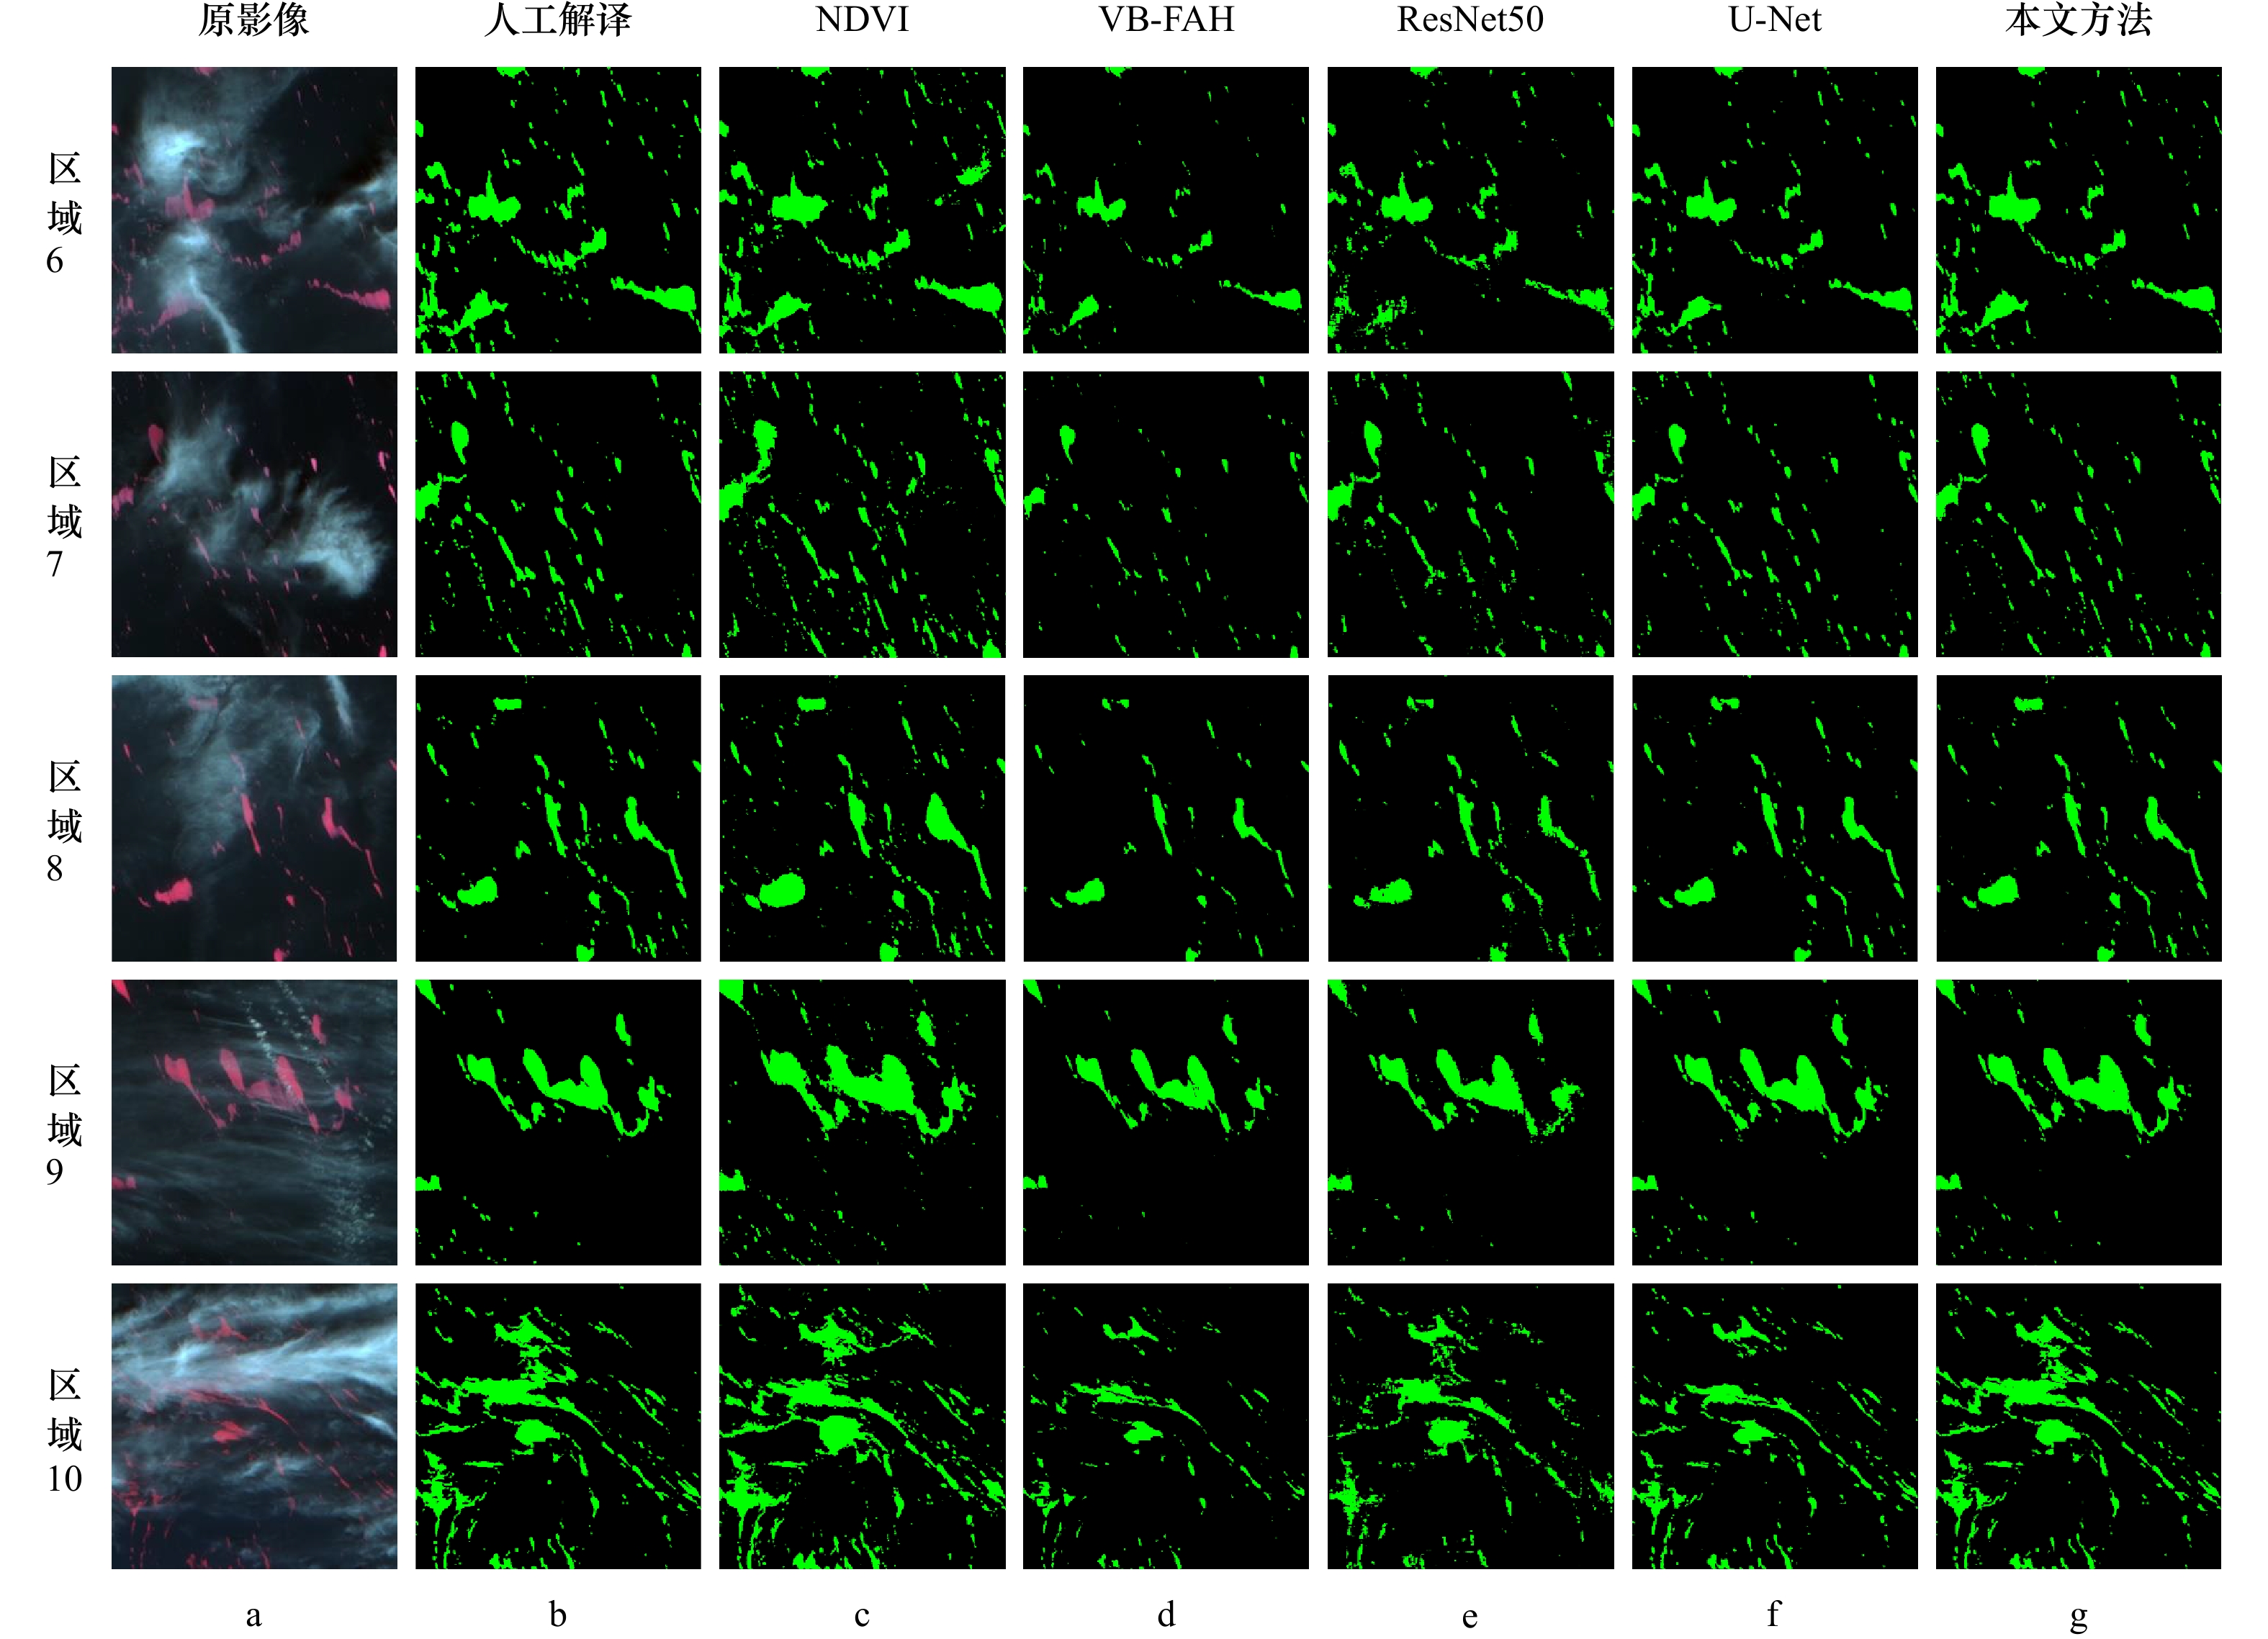
图 12 薄云区域绿潮提取效果对比
a. HY-1C/D卫星CZI传感器RGB合成影像(R:825 nm,G:650 nm,B:560 nm);b、c、d、e、f、g分别为人工解译、NDVI、VB-FAH、ResNet50、U-Net、本文方法的绿潮提取结果
Fig. 12 Comparison of green tide extraction effects in thin cloud region
a. RGB composite image (R: 825 nm, G: 650 nm, B: 560 nm) of HY-1C/D satellite CZI sensor; b, c, d, e, f, g show the green tide extraction results of manual interpretation, NDVI, VB-FAH, ResNet50, U-Net, and the method proposed in this paper, respectively

图 13 无云区域绿潮提取效果对比
a. HY-1C/D卫星CZI传感器RGB合成影像(R:825 nm,G:650 nm,B:560 nm);b、c、d、e、f、g分别为人工解译、NDVI、VB-FAH、ResNet50、U-Net、本文方法的绿潮提取结果
Fig. 13 Comparison of green tide extraction effects in cloud-free region
a. RGB composite image (R: 825 nm, G: 650 nm, B: 560 nm) of HY-1C/D satellite CZI sensor; b, c, d, e, f, g show the green tide extraction results of manual interpretation, NDVI, VB-FAH, ResNet50, U-Net, and the method proposed in this paper, respectively

图 14 云斑区域绿潮提取效果对比
a. HY-1C/D卫星CZI传感器RGB合成影像(R:825 nm,G:650 nm,B:560 nm);b、c、d、e、f、g分别为人工解译、NDVI、VB-FAH、ResNet50、U-Net、本文方法的绿潮提取结果
Fig. 14 Comparison of green tide extraction effects in cloud spot region
a. RGB composite image (R: 825 nm, G: 650 nm, B: 560 nm) of HY-1C/D satellite CZI sensor; b, c, d, e, f, g show the green tide extraction results of manual interpretation, NDVI, VB-FAH, ResNet50, U-Net, and the method proposed in this paper, respectively
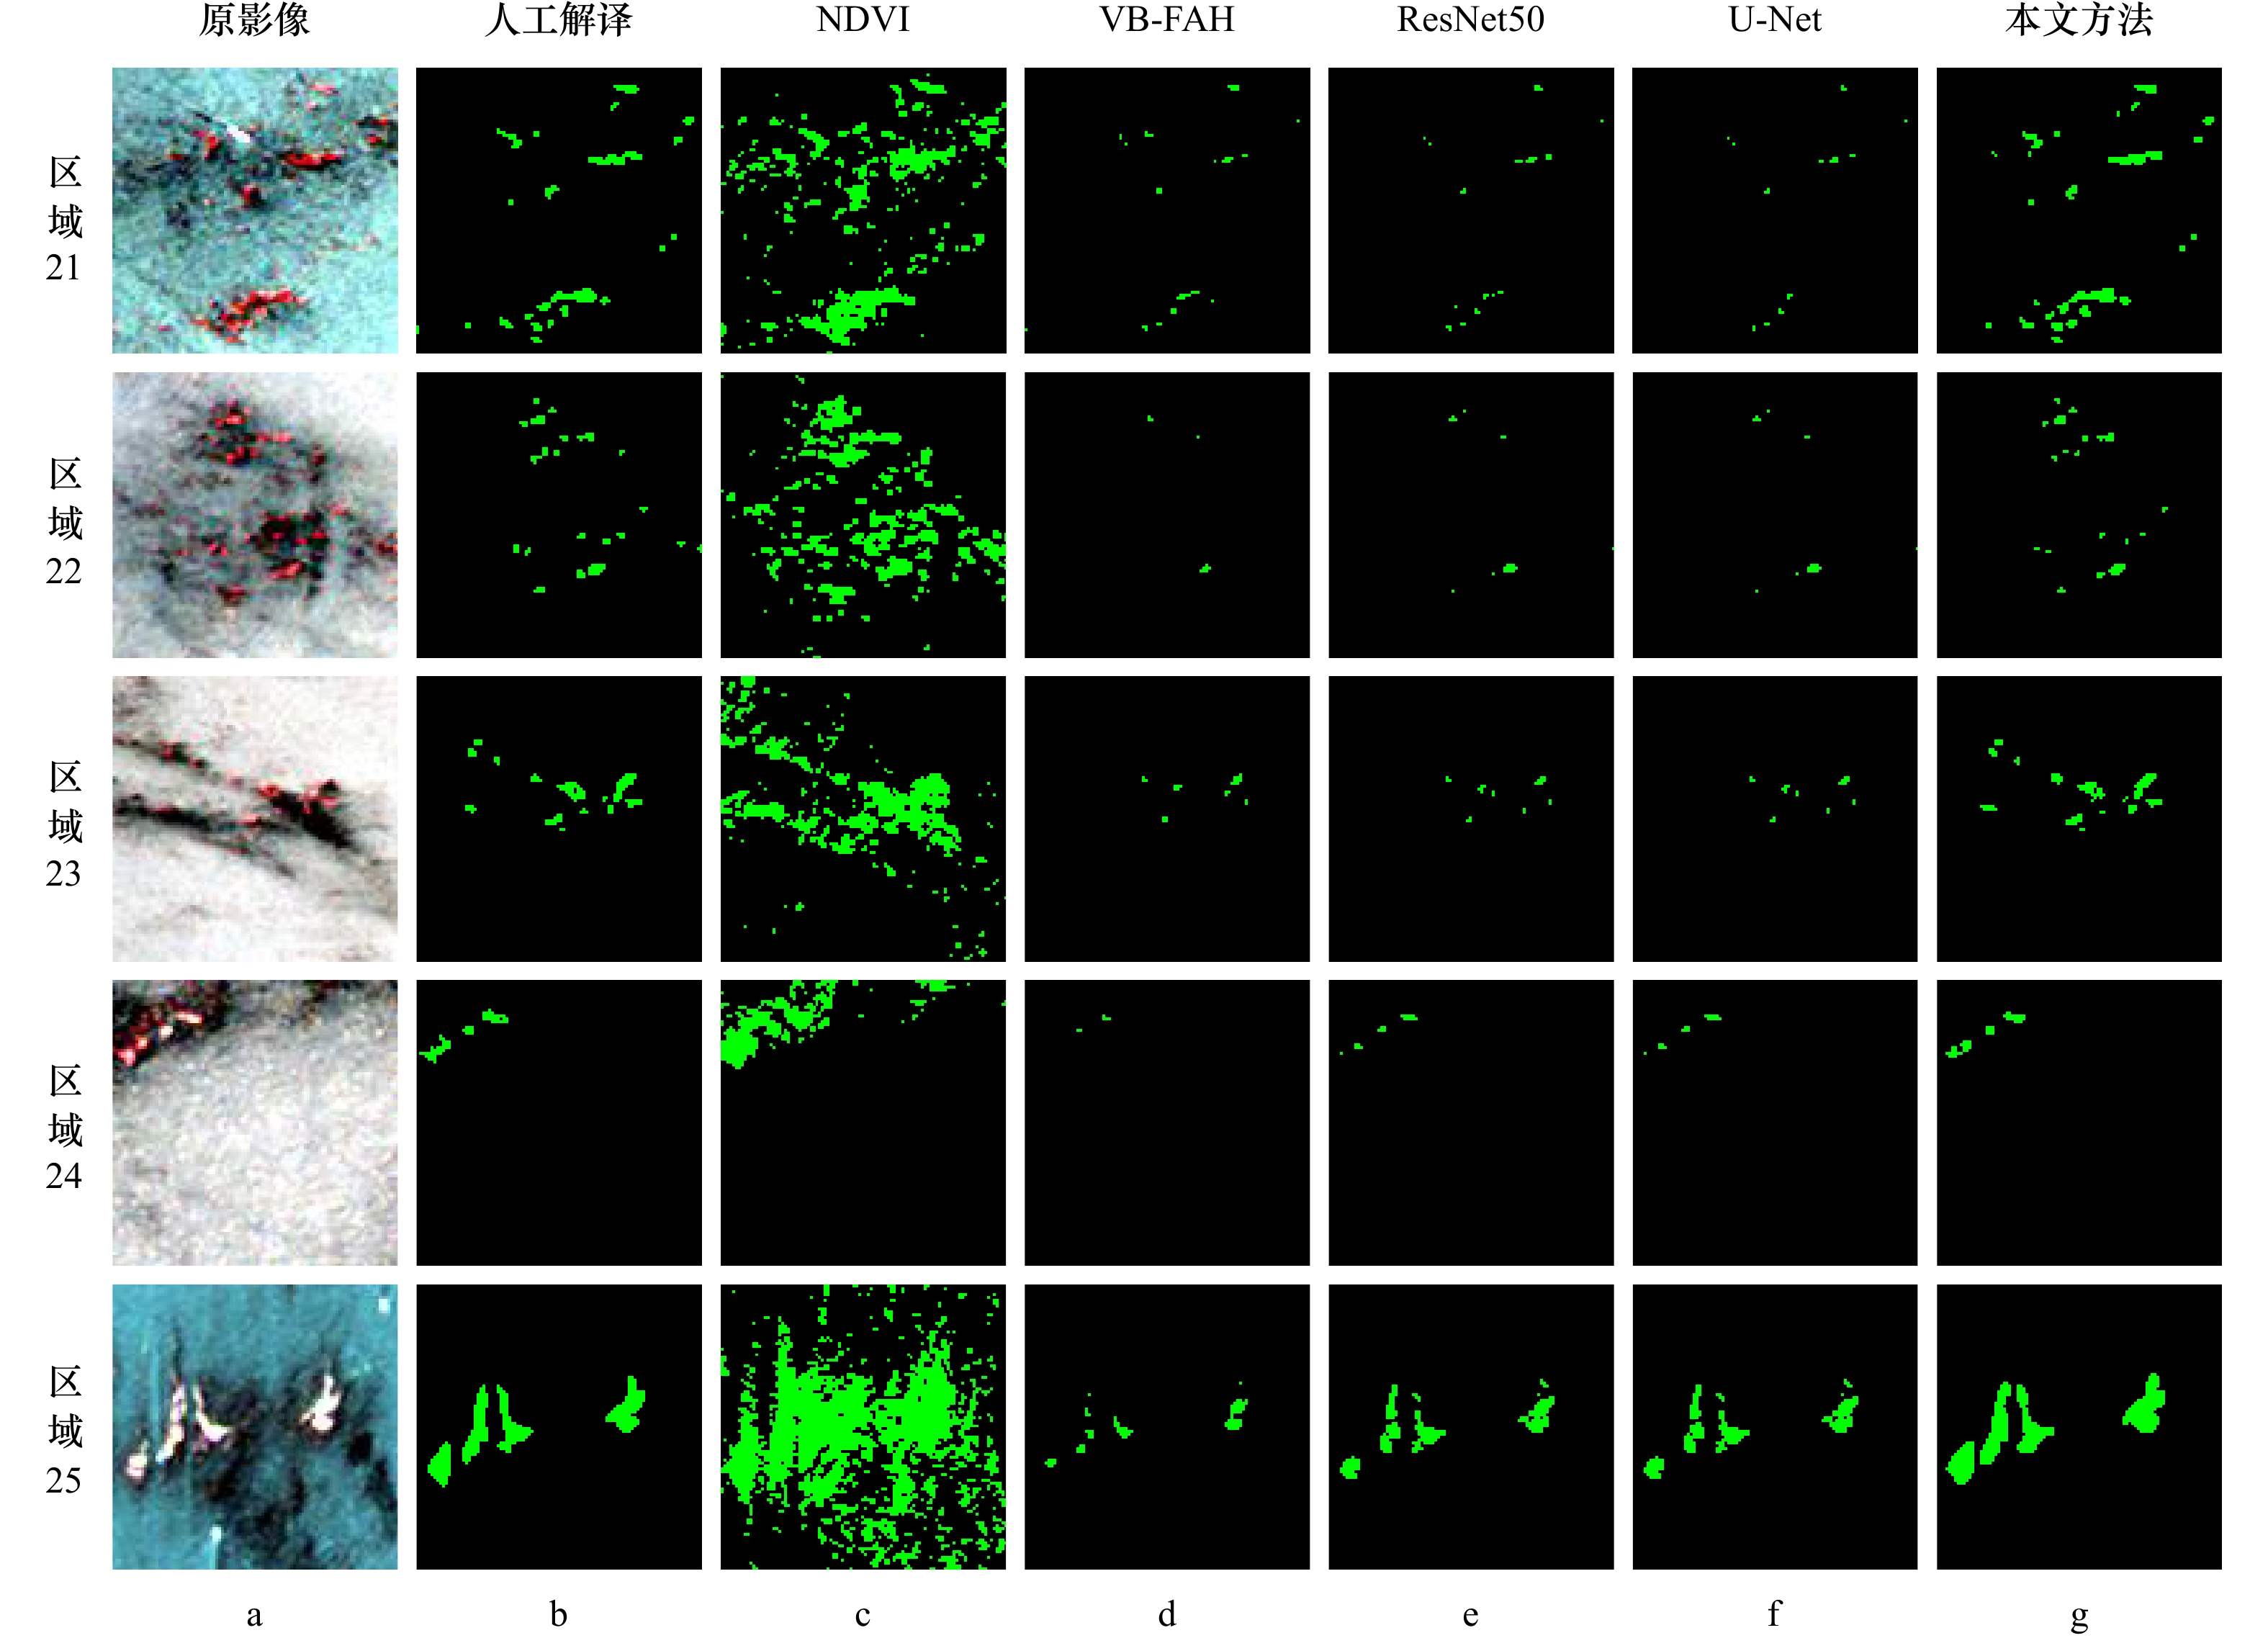
图 15 耀斑区域绿潮提取效果对比
a. HY-1C/D卫星CZI传感器RGB合成影像(R:825 nm,G:650 nm,B:560 nm);b、c、d、e、f、g分别为人工解译、NDVI、VB-FAH、ResNet50、U-Net、本文方法的绿潮提取结果
Fig. 15 Comparison of green tide extraction effect in flare region
a. RGB composite image (R: 825 nm, G: 650 nm, B: 560 nm) of HY-1C/D satellite CZI sensor; b, c, d, e, f, g show the green tide extraction results of manual interpretation, NDVI, VB-FAH, ResNet50, U-Net, and the method proposed in this paper, respectively
表 1 HY-1C/D 卫星 CZI 传感器的波段信息
Tab. 1 Band information of HY-1C/D satellite CZI sensor
波段 波宽/nm 空间分辨率/m band 1 420~500 50 band 2 520~600 50 band 3 610~690 50 band 4 760~890 50  下载: 导出CSV
表 2 绿潮提取规则集
Tab. 2 Green tide extraction rule set
编号 决策规则 颜色 A b3 – b4 ≤ –389.5且b3 – b4 ≤ –328.5且b1 ≤ 448.5 若不满足A,则颜色为黑色 b3 – b4 > –389.5且b2 – b3 > –84.5且b3 – b4 >863 b3 – b4 > –389.5且b2 – b3 > –84.5且b3 – b4 > –523.5 b3 – b4 > –389.5且b2 – b3 > –84.5且b3 – b4 ≤ –523.5且b3 ≤ –484.5 B A且b2 – b3 ≤ –140.5 且 b1 ≤ 1558且b2 – b3 > –4.5 绿色 A且b2 – b3 ≤ –140.5且b2 – b3 > –321.5 A 且b2 – b3 ≤ –140.5且b1 ≤ 1558且b2 – b3 ≤ –4.5且b3 – b4 ≤ –681.5且
b2 – b3 > –42.5C A 且 b2 – b3 ≤ –140.5且b1 > 1558 红色 D A且b2 – b3 ≤ –140.5且b1 ≤ 1558且b2 – b3 ≤ –4.5且b3 – b4 ≤ –681.5且
b2 – b3 ≤ –42.5蓝色 A且b2 – b3 ≤ –140.5且b1 ≤ 1558且b2 – b3 ≤ –4.5且b3 – b4 > –681.5 E A且b2 – b3 ≤ –140.5且b2 – b3 ≤ –321.5 橙色
下载: 导出CSV
表 3 ACC和Kappa精度评估结果
Tab. 3 Accuracy evaluation results of ACC and Kappa
区域/类型 ACC Kappa NDVI VB-FAH ResNet50 U-Net 本文方法 NDVI VB-FAH ResNet50 U-Net 本文方法 1/厚云 0.959 2 0.912 7 0.930 1 0.959 5 0.992 3 0.814 8 0.508 0 0.614 4 0.791 9 0.964 5 2/厚云 0.803 7 0.791 4 0.980 7 0.988 2 0.994 1 0.156 9 0.065 4 0.589 8 0.761 0 0.891 6 3/厚云 0.901 2 0.875 1 0.962 4 0.976 1 0.993 2 0.400 5 0.096 5 0.550 3 0.748 2 0.935 2 4/厚云 0.927 4 0.929 4 0.984 3 0.990 2 0.992 5 0.462 0 0.381 0 0.766 3 0.600 3 0.894 1 5/厚云 0.872 2 0.869 0 0.976 1 0.982 6 0.990 1 0.389 9 0.334 3 0.771 9 0.643 4 0.842 4 6/薄云 0.969 4 0.947 2 0.957 9 0.970 0 0.970 9 0.824 5 0.583 2 0.710 7 0.694 5 0.849 2 7/薄云 0.966 7 0.968 3 0.976 1 0.982 0 0.989 4 0.719 1 0.558 4 0.744 2 0.698 0 0.885 4 8/薄云 0.977 5 0.973 7 0.976 4 0.983 9 0.985 5 0.815 2 0.691 1 0.767 7 0.837 8 0.859 6 9/薄云 0.965 1 0.984 6 0.984 8 0.970 1 0.987 1 0.775 5 0.864 3 0.879 0 0.922 5 0.982 5 10/薄云 0.948 7 0.927 1 0.924 6 0.945 2 0.994 5 0.774 7 0.523 5 0.587 6 0.691 3 0.973 1 11/无云 0.904 9 0.980 9 0.978 5 0.969 1 0.990 4 0.576 8 0.853 6 0.852 6 0.825 0 0.921 3 12/无云 0.949 2 0.971 5 0.966 7 0.967 2 0.979 6 0.673 1 0.688 7 0.707 2 0.783 3 0.828 2 13/无云 0.923 4 0.957 4 0.963 1 0.968 5 0.970 4 0.682 4 0.726 9 0.801 0 0.678 2 0.847 3 14/无云 0.975 0 0.975 5 0.973 5 0.985 7 0.998 2 0.769 7 0.621 3 0.683 5 0.820 6 0.978 5 15/无云 0.985 0 0.977 4 0.980 8 0.986 9 0.989 0 0.830 7 0.627 0 0.732 6 0.815 9 0.850 1 16/云斑 0.905 6 0.955 6 0.940 4 0.971 8 0.982 3 0.606 8 0.660 4 0.612 7 0.832 9 0.896 5 17/云斑 0.914 1 0.969 8 0.962 2 0.974 2 0.994 1 0.470 0 0.483 8 0.500 9 0.676 1 0.927 7 18/云斑 0.868 0 0.957 5 0.944 9 0.955 7 0.985 1 0.454 3 0.549 8 0.572 5 0.698 5 0.887 9 19/云斑 0.924 0 0.981 1 0.976 1 0.977 7 0.984 0 0.478 8 0.682 7 0.683 8 0.856 7 0.906 0 20/云斑 0.904 2 0.955 4 0.944 7 0.967 8 0.984 1 0.603 1 0.661 5 0.682 5 0.817 4 0.907 8 21/耀斑 0.907 5 0.978 1 0.977 5 0.976 4 0.995 6 0.334 6 0.294 5 0.252 3 0.187 7 0.919 1 22/耀斑 0.896 6 0.987 5 0.988 6 0.988 6 0.995 1 0.188 5 0.147 9 0.275 7 0.275 7 0.819 0 23/耀斑 0.903 9 0.987 6 0.987 3 0.987 3 0.996 7 0.219 4 0.664 6 0.279 4 0.279 4 0.890 9 24/耀斑 0.959 3 0.993 1 0.994 6 0.994 6 0.997 2 0.254 6 0.125 6 0.423 7 0.423 7 0.816 0 25/耀斑 0.711 9 0.966 1 0.981 5 0.981 5 0.987 1 0.167 8 0.353 7 0.730 7 0.730 7 0.860 4
下载: 导出CSV
表 4 F1-Score和MIoU精度评估结果
Tab. 4 Accuracy evaluation results of F1-Score and MIoU
区域/类型 F1-Score MIoU NDVI VB-FAH ResNet50 U-Net 本文方法 NDVI VB-FAH ResNet50 U-Net 本文方法 1/厚云 0.967 0 0.945 5 0.958 2 0.977 0 0.993 7 0.837 9 0.644 6 0.703 7 0.821 0 0.965 5 2/厚云 0.803 4 0.796 6 0.988 3 0.993 4 0.996 4 0.455 3 0.424 6 0.704 0 0.802 4 0.901 6 3/厚云 0.907 4 0.885 7 0.978 3 0.985 7 0.995 6 0.592 6 0.476 1 0.679 0 0.794 4 0.938 7 4/厚云 0.926 5 0.933 8 0.988 5 0.990 1 0.993 7 0.625 0 0.593 6 0.807 8 0.908 7 0.963 6 5/厚云 0.874 0 0.875 4 0.975 6 0.968 6 0.982 2 0.576 0 0.554 1 0.810 1 0.862 4 0.961 3 6/薄云 0.974 7 0.972 9 0.975 3 0.964 6 0.983 2 0.846 5 0.690 3 0.766 7 0.824 5 0.935 3 7/薄云 0.969 0 0.983 8 0.983 6 0.969 5 0.987 5 0.773 9 0.684 0 0.791 9 0.829 1 0.920 1 8/薄云 0.978 8 0.986 6 0.984 1 0.970 6 0.990 3 0.840 6 0.757 8 0.807 4 0.858 3 0.875 2 9/薄云 0.964 0.931 9 0.928 2 0.961 6 0.988 0.810 3 0.878 7 0.890 5 0.927 4 0.950 1 10/薄云 0.952 6 0.962 1 0.949 9 0.968 2 0.997 1 0.807 4 0.653 8 0.688 7 0.751 9 0.973 7 11/无云 0.901 1 0.970 1 0.973 4 0.951 5 0.980 7 0.674 5 0.869 9 0.869 0 0.929 5 0.944 0 12/无云 0.949 2 0.975 4 0.975 1 0.961 9 0.983 5 0.741 5 0.755 8 0.766 9 0.894 2 0.950 6 13/无云 0.921 8 0.978 1 0.972 5 0.967 5 0.985 2 0.741 1 0.776 4 0.828 4 0.889 2 0.963 9 14/无云 0.974 8 0.987 6 0.980 7 0.971 1 0.999 0 0.808 2 0.718 6 0.754 0 0.845 8 0.978 9 15/无云 0.986 6 0.988 6 0.988 0 0.992 8 0.994 0 0.853 2 0.722 2 0.785 3 0.842 6 0.868 3 16/云斑 0.901 8 0.976 9 0.957 3 0.976 9 0.984 4 0.691 4 0.735 4 0.706 5 0.853 1 0.904 6 17/云斑 0.912 6 0.984 7 0.974 1 0.982 1 0.996 5 0.624 1 0.649 3 0.656 4 0.749 8 0.932 2 18/云斑 0.863 6 0.978 1 0.957 9 0.960 8 0.987 6 0.600 6 0.676 5 0.686 6 0.759 1 0.897 8 19/云斑 0.922 6 0.950 2 0.982 0 0.968 0 0.986 1 0.631 4 0.754 6 0.754 7 0.773 1 0.895 1 20/云斑 0.900 4 0.976 5 0.954 4 0.971 8 0.985 7 0.689 0 0.736 0 0.747 3 0.840 9 0.914 3 21/耀斑 0.906 2 0.988 8 0.988 6 0.988 1 0.996 3 0.563 5 0.577 3 0.562 6 0.541 2 0.924 8 22/耀斑 0.895 9 0.993 7 0.994 3 0.994 3 0.997 5 0.505 7 0.534 2 0.575 2 0.575 2 0.818 1 23/耀斑 0.903 2 0.993 8 0.993 6 0.993 6 0.997 6 0.519 5 0.745 7 0.575 9 0.575 9 0.901 3 24/耀斑 0.959 2 0.996 5 0.997 2 0.997 2 0.998 4 0.555 5 0.530 3 0.632 4 0.632 4 0.823 3 25/耀斑 0.705 3 0.982 8 0.974 4 0.957 8 0.987 6 0.415 0 0.594 1 0.784 0 0.784 0 0.876 0
下载: 导出CSV
-
[1] Hiraoka M, Ohno M, Kawaguchi S, et al. Crossing test among floating Ulva thalli forming ‘green tide’ in Japan[J]. Hydrobiologia, 2004, 512(1): 239−245. [2] 衣立, 张苏平, 殷玉齐. 2009年黄海绿潮浒苔爆发与漂移的水文气象环境[J]. 中国海洋大学学报, 2010, 40(10): 15−23.Yi Li, Zhang Suping, Yin Yuqi. Influnce of environmental hydro-meteorological conditions to Enteromorpha prolifera blooms in Yellow Sea, 2009[J]. Periodical of Ocean University of China, 2010, 40(10): 15−23. [3] Liu Dongyan, Keesing J K, He Peimin, et al. The world’s largest macroalgal bloom in the Yellow Sea, China: formation and implications[J]. Estuarine, Coastal and Shelf Science, 2013, 129: 2−10. doi: 10.1016/j.ecss.2013.05.021 [4] Hu Lianbo, Zeng Kan, Hu Chuanmin, et al. On the remote estimation of Ulva prolifera areal coverage and biomass[J]. Remote Sensing of Environment, 2019, 223: 194−207. doi: 10.1016/j.rse.2019.01.014 [5] Qi Lin, Hu Chuanmin, Xing Qianguo, et al. Long-term trend of Ulva prolifera blooms in the western Yellow Sea[J]. Harmful Algae, 2016, 58: 35−44. doi: 10.1016/j.hal.2016.07.004 [6] Qi Lin, Hu Chuanmin. To what extent can Ulva and Sargassum be detected and separated in satellite imagery?[J]. Harmful Algae, 2021, 103: 102001. doi: 10.1016/j.hal.2021.102001 [7] Hu Lianbo, Hu Chuanmin, He Mingxia. Remote estimation of biomass of Ulva prolifera macroalgae in the Yellow Sea[J]. Remote Sensing of Environment, 2017, 192: 217−227. doi: 10.1016/j.rse.2017.01.037 [8] Hu Chuanmin, Li Daqiu, Chen Changsheng, et al. On the recurrent Ulva prolifera blooms in the Yellow Sea and East China Sea[J]. Journal of Geophysical Research: Oceans, 2010, 115(C5): C05017. [9] Xing Qianguo, Hu Chuanmin, Tang Danling, et al. World’s largest macroalgal blooms altered phytoplankton biomass in summer in the Yellow Sea: satellite observations[J]. Remote Sensing, 2015, 7(9): 12297−12313. doi: 10.3390/rs70912297 [10] Nelson T A, Haberlin K, Nelson A V, et al. Ecological and physiological controls of species composition in green macroalgal blooms[J]. Ecology, 2008, 89(5): 1287−1298. doi: 10.1890/07-0494.1 [11] Hu Chuanmin, He Mingxia. Origin and offshore extent of floating algae in Olympic sailing area[J]. Eos, Transactions American Geophysical Union, 2008, 89(33): 302−303. doi: 10.1029/2008EO330002 [12] 施英妮, 石立坚, 夏明, 等. HJ-1A/1B星CCD传感器数据在黄东海浒苔监测中的应用[J]. 遥感信息, 2012, 27(2): 47−50.Shi Yingni, Shi Lijian, Xia Ming, et al. The application of HJ-1A/1B’s CCD data to entermorpha prolifera monitoring over the Yellow Sea and East Sea[J]. Remote Sensing Information, 2012, 27(2): 47−50. [13] Hu Chuanmin. A novel ocean color index to detect floating algae in the global oceans[J]. Remote Sensing of Environment, 2009, 113(10): 2118−2129. doi: 10.1016/j.rse.2009.05.012 [14] Son Y B, Min J E, Ryu J H. Detecting massive green algae ( Ulva prolifera) blooms in the Yellow Sea and East China Sea using geostationary ocean color imager (GOCI) data[J]. Ocean Science Journal, 2012, 47(3): 359−375. doi: 10.1007/s12601-012-0034-2 [15] Xing Qianguo, Hu Chuanmin. Mapping macroalgal blooms in the Yellow Sea and East China Sea using HJ-1 and Landsat data: Application of a virtual baseline reflectance height technique[J]. Remote Sensing of Environment, 2016, 178: 113−126. doi: 10.1016/j.rse.2016.02.065 [16] 薛瑞, 吴孟泉, 刘杨, 等. 基于HJ-1A/1B的2014年黄海海域浒苔灾害时空分布[J]. 海洋科学, 2016, 40(7): 115−123.Xue Rui, Wu Mengquan, Liu Yang, et al. Spatial and temporal variability of Ulva prolifera in the Yellow Sea, China in 2014[J]. Marine Sciences, 2016, 40(7): 115−123. [17] 曾韬, 刘建强. “北京一号”小卫星在青岛近海浒苔灾害监测中的应用[J]. 遥感信息, 2009, 24(3): 34−37.Zeng Tao, Liu Jianqiang. The application of Beijing-1 micro satellite data to algae disaster monitoring in the sea of Qingdao[J]. Remote Sensing Information, 2009, 24(3): 34−37. [18] 刘锦超, 刘建强, 丁静, 等. HY-1C卫星CZI载荷的黄海绿潮提取研究[J]. 海洋学报, 2022, 44(5): 1−11.Liu Jinchao, Liu Jianqiang, Ding Jing, et al. A refined imagery algorithm to extract green tide in the Yellow Sea from HY-1C satellite CZI measurements[J]. Haiyang Xuebao, 2022, 44(5): 1−11. [19] He Kaiming, Zhang Xiangyu, Ren Shaoqing, et al. Deep residual learning for image recognition[C]//2016 IEEE Conference on Computer Vision and Pattern Recognition. Las Vegas, NV, USA: IEEE, 2016: 770−778. [20] Badrinarayanan V, Kendall A, Cipolla R. SegNet: a deep convolutional encoder-decoder architecture for image segmentation[J]. IEEE Transactions on Pattern Analysis and Machine Intelligence, 2017, 39(12): 2481−2495. doi: 10.1109/TPAMI.2016.2644615 [21] Ronneberger O, Fischer P, Brox T. U-Net: convolutional networks for biomedical image segmentation[C]//18th International Conference on Medical Image Computing and Computer-Assisted Intervention. Munich: Springer, 2015: 234−241. [22] Cui Binge, Zhang Haoqing, Jing Wei, et al. SRSe-net: super-resolution-based semantic segmentation network for green tide extraction[J]. Remote Sensing, 2022, 14(3): 710. doi: 10.3390/rs14030710 [23] Yu Haifei, Wang Changying, Li Jinhua, et al. Automatic extraction of green tide from GF-3 SAR images based on feature selection and deep learning[J]. IEEE Journal of Selected Topics in Applied Earth Observations and Remote Sensing, 2021, 14: 10598−10613. doi: 10.1109/JSTARS.2021.3118374 [24] Wang Zhongyuan, Fang Zhixiang, Liang Jianfeng, et al. Estimating Ulva prolifera green tides of the Yellow Sea through ConvLSTM data fusion[J]. Environmental Pollution, 2023, 324: 121350. doi: 10.1016/j.envpol.2023.121350 [25] Shang Weitao, Gao Zhiqiang, Gao Meng, et al. Monitoring green tide in the Yellow Sea using high-resolution imagery and deep learning[J]. Remote Sensing, 2023, 15(4): 1101. doi: 10.3390/rs15041101 [26] Shi Wei, Wang Menghua. Green macroalgae blooms in the Yellow Sea during the spring and summer of 2008[J]. Journal of Geophysical Research: Oceans, 2009, 114(C12): C12010. [27] Wang Mengqiu, Hu Chuanmin. Mapping and quantifying Sargassum distribution and coverage in the Central West Atlantic using MODIS observations[J]. Remote Sensing of Environment, 2016, 183: 350−367. doi: 10.1016/j.rse.2016.04.019 [28] 苗珊珊. “长征”二号C运载火箭成功发射“海洋”一号C卫星[J]. 中国航天, 2018(9): 26.Miao Shanshan. The CZ-2C carrier rocket successfully launched the HY-1C satellite[J]. Aerospace China, 2018(9): 26. [29] 刘建强, 蒋兴伟, 王丽丽, 等. 海洋一号C、D卫星组网观测与应用[J]. 卫星应用, 2021(9): 19−26. doi: 10.3969/j.issn.1674-9030.2021.09.007Liu Jianqiang, Jiang Xingwei, Wang Lili, et al. Monitoring and application of the HY-1C and D satellites constellation[J]. Satellite Application, 2021(9): 19−26. doi: 10.3969/j.issn.1674-9030.2021.09.007 [30] 李岩松, 赵慧洁, 李娜, 等. 基于中红外偏振的海面太阳耀光背景下的目标探测[J]. 中国激光, 2022, 49(19): 1910004. doi: 10.3788/CJL202249.1910004Li Yansong, Zhao Huijie, Li Na, et al. Detection of marine targets covered in sun glint based on mid-infrared polarization[J]. Chinese Journal of Lasers, 2022, 49(19): 1910004. doi: 10.3788/CJL202249.1910004 [31] Wang Chen, Zhang Huaguo, Xu Qing, et al. Inversion of the refractive index of marine spilled oil using multi-angle sun glitter images acquired by the ASTER sensor[J]. Remote Sensing of Environment, 2022, 275: 113019. doi: 10.1016/j.rse.2022.113019 [32] 刘建强, 曾韬, 梁超, 等. 海洋一号C卫星在自然灾害监测中的应用[J]. 卫星应用, 2020(6): 26−34.Liu Jianqiang, Zeng Tao, Liang Chao, et al. Application of HY-1C satellite in natural disaster monitoring[J]. Satellite Application, 2020(6): 26−34. -

计量
- 文章访问数: 292
- HTML全文浏览量: 122
- PDF下载量: 26
- 被引次数: 0
