

A study on the extraction of Red Beach Suaeda salsa and its change trends in recent 5 years based on HY-1C data
-
摘要: 为掌握红海滩翅碱蓬(Suaeda salsa)群落分布现状及修复情况,本文采用2018−2022年HY-1C卫星海岸带成像仪(CZI)数据,基于现场实测光谱特征分析,构建翅碱蓬遥感提取模型,获得了5期翅碱蓬群落空间分布数据,提取精度优于87%;基于提取结果,开展了红海滩翅碱蓬群落时空分布及类型水平上景观格局的变化分析,结果显示:近5年来,翅碱蓬群落分布面积总体呈显著增加趋势,斑块类型面积(CA)、斑块所占景观面积比例(PLAND)、最大斑块指数(LPI)、有效网格大小(MESH)、平均斑块面积(AREA_MN)等指标呈先减小后上升趋势,破碎化指数(SPLIT)先增大后减小、聚集指数(AI)总体呈上升趋势,可见翅碱蓬群落在红海滩景观构成中占比逐年增大,景观形状复杂度提升,破碎化势头得到逆转,聚集性分布趋势较为明显,这说明自2019年开始实施的翅碱蓬规模化修复工程成效显著;另一方面,翅碱蓬群落生境在总体持续向好的同时又表现出恢复水平空间不均衡的特点,大致为中、东部好于西部,南部好于北部。本文结果可为修复工程的效果评估工作提供基础数据,并为今后修复施工的空间布局规划提供决策参考。Abstract: In order to master the current distribution and the restoration status of Suaeda salsa in the Red Beach, a remote sensing extraction model was constructed based on the HY-1C satellite CZI data and on-site measured spectral. Five periods of spatial distribution data of S. salsa were obtained in 2018−2022, with the extraction accuracy better than 87%; based on the extracted results, a change analysis on the spatio-temporal distribution and the class-level landscape pattern of S. salsa was conducted. The results show that: in the past 5 years, the overall distribution area of the S. salsa community has shown a significant increase trend, with indicators such as class area (CA), percentage of landscape (PLAND), largest patch index (LPI), effective mesh size (MESH), and mean patch size (AREA_MN) showing a first decreasing and then increasing trend, splitting index (SPLIT) first increasing and then decreasing, and aggregation index (AI) overall showing an upward trend. It can be seen that the proportion of S. salsa community in the landscape composition of Red Beach has been increasing year by year, the complexity of landscape shape has increased, the fragmentation trend has been reversed, and the trend of aggregation distribution is more obvious. This all indicates that the large-scale restoration project of S. salsa implemented since 2019 has achieved a significant result. The biotope of the Red Beach S. salsa continues to improve, but at the same time, it shows a spatial imbalance of the recovery level, which is generally better in the middle and east than in the west, and better in the south than in the north. The results of this paper can provide basic data for the evaluation of the effectiveness of the restoration project, and provide decision-making reference for the spatial planning in the future restoration work.
-
Key words:
- Red Beach /
- HY-1C /
- Suaeda salsa /
- space distribution /
- landscape indices
-

图 3 红海滩典型地物实测光谱曲线(a)与CZI波段等效光谱曲线(b)
Fig. 3 Measured spectral curve of typical features on Red Beach (a) and equivalent spectral curve in CZI band (b)
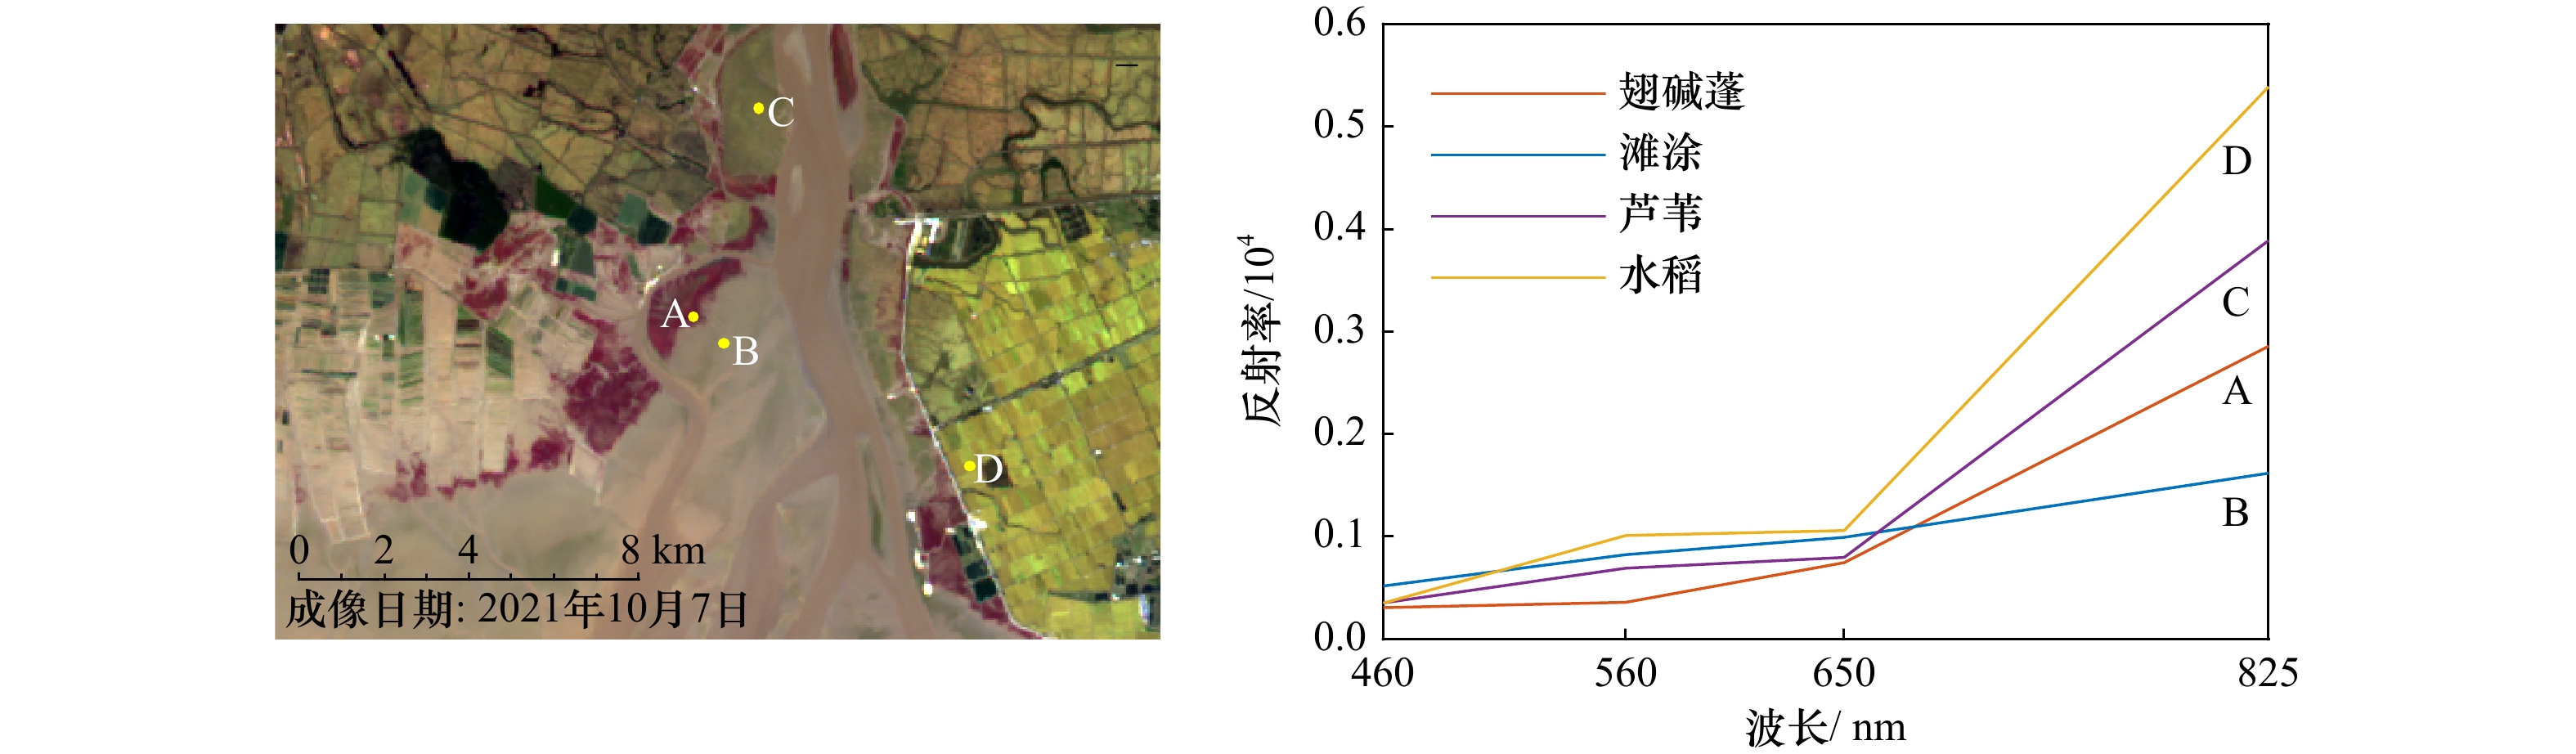
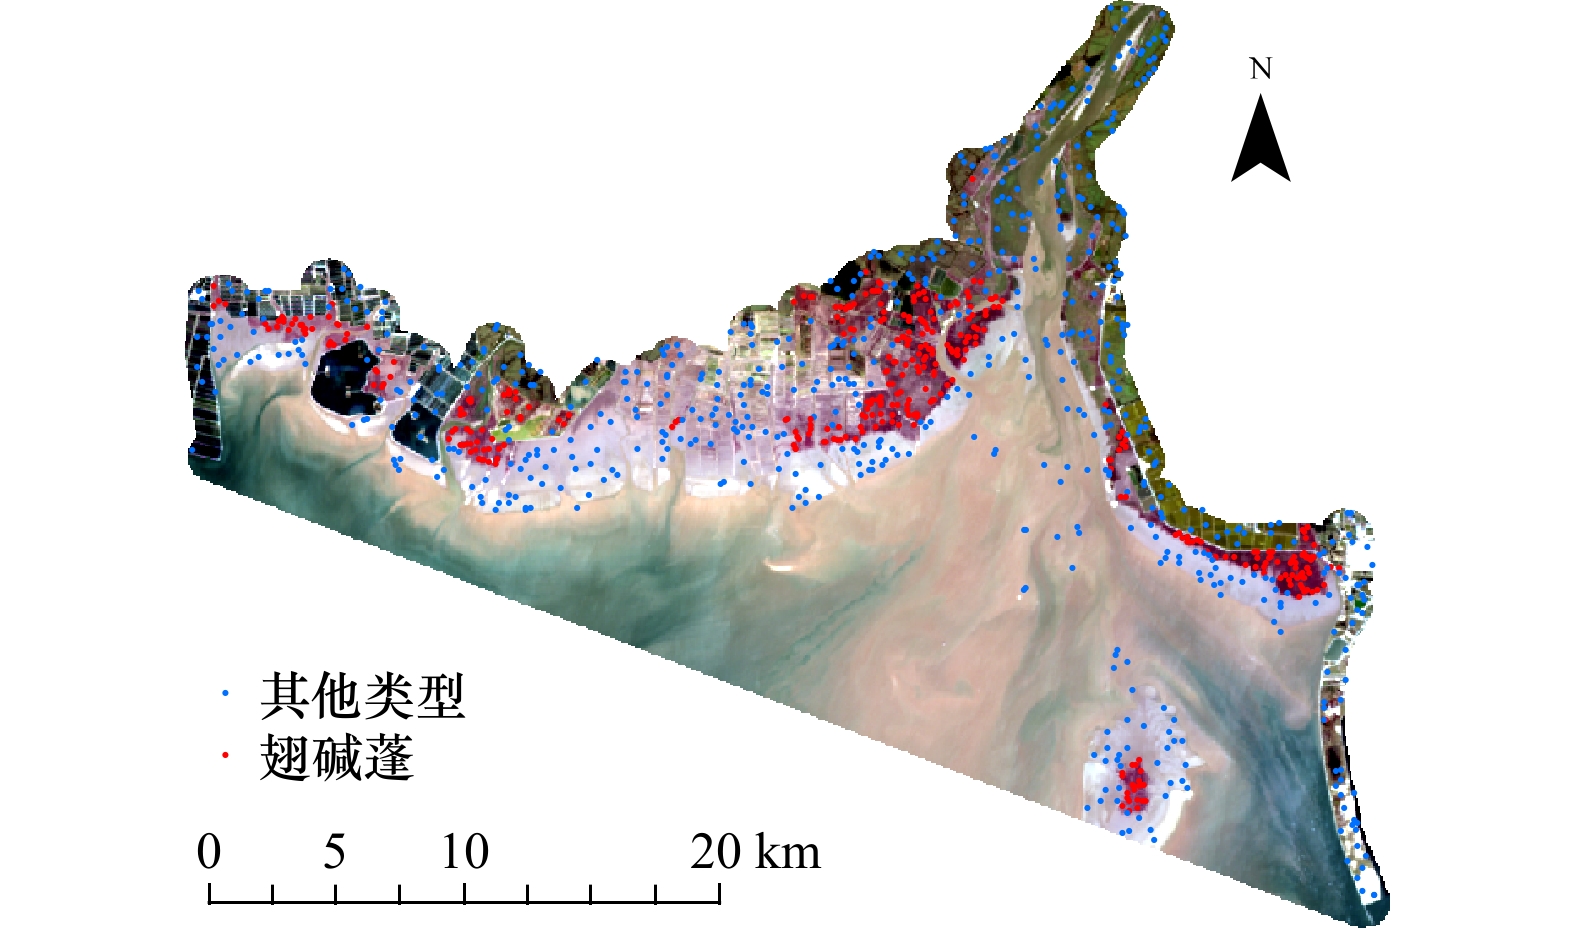
图 4 HY-1C影像上典型样本点及其光谱曲线
Fig. 4 Typical sample points on HY-1C images and their spectral curves
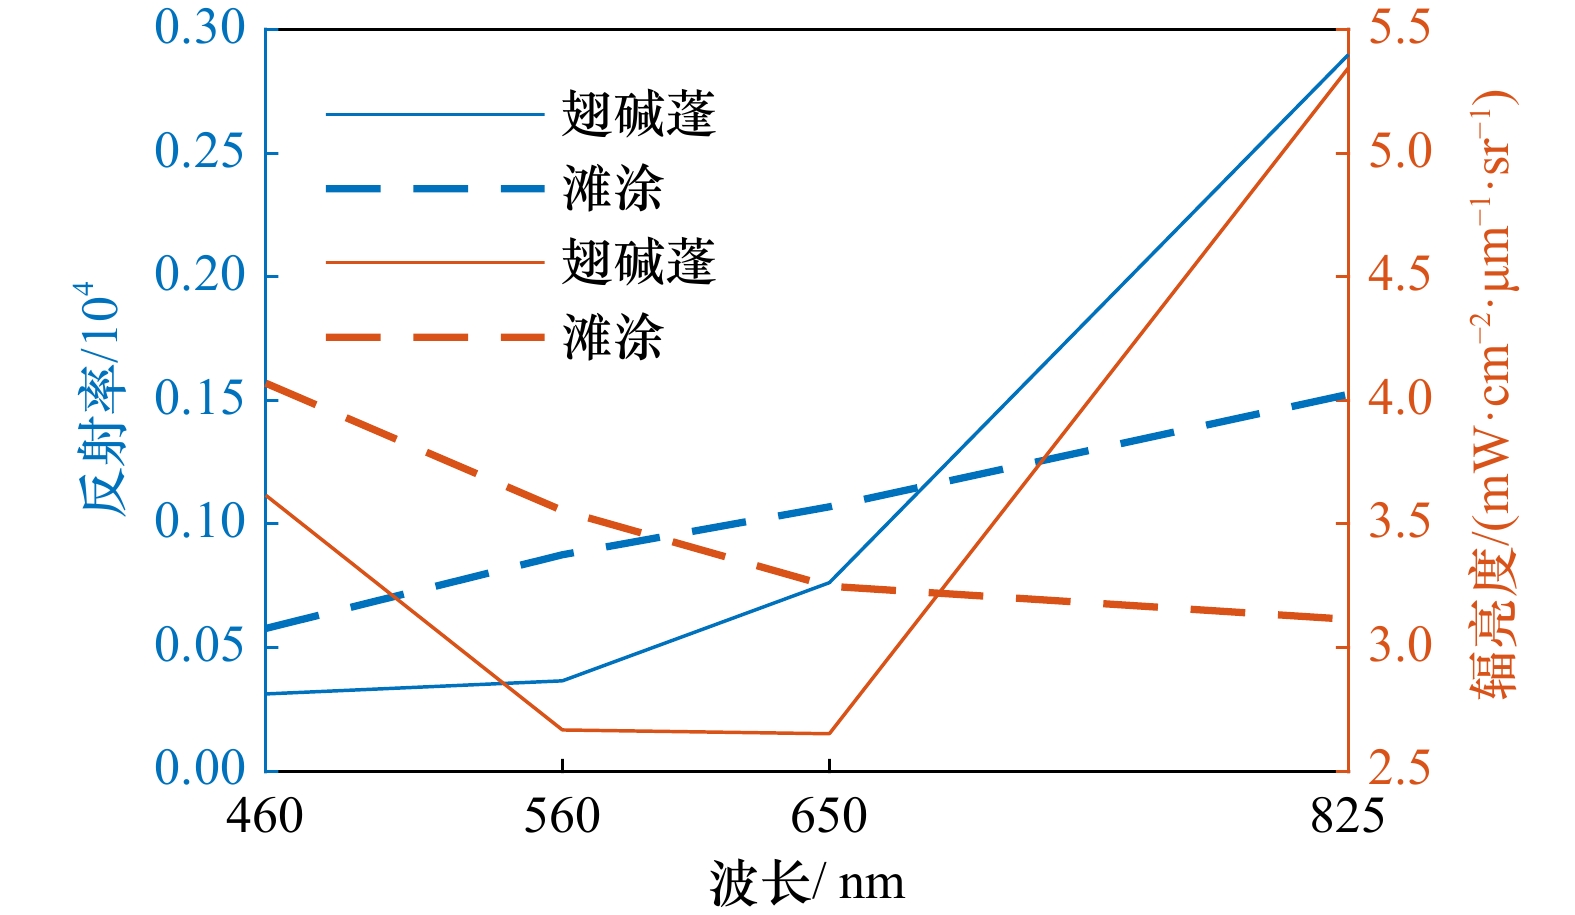
图 5 CZI影像上翅碱蓬与滩涂像元的反射率及辐亮度
Fig. 5 Reflectance and radiance of Suaeda salsa and tidal flat pixels on the CZI image
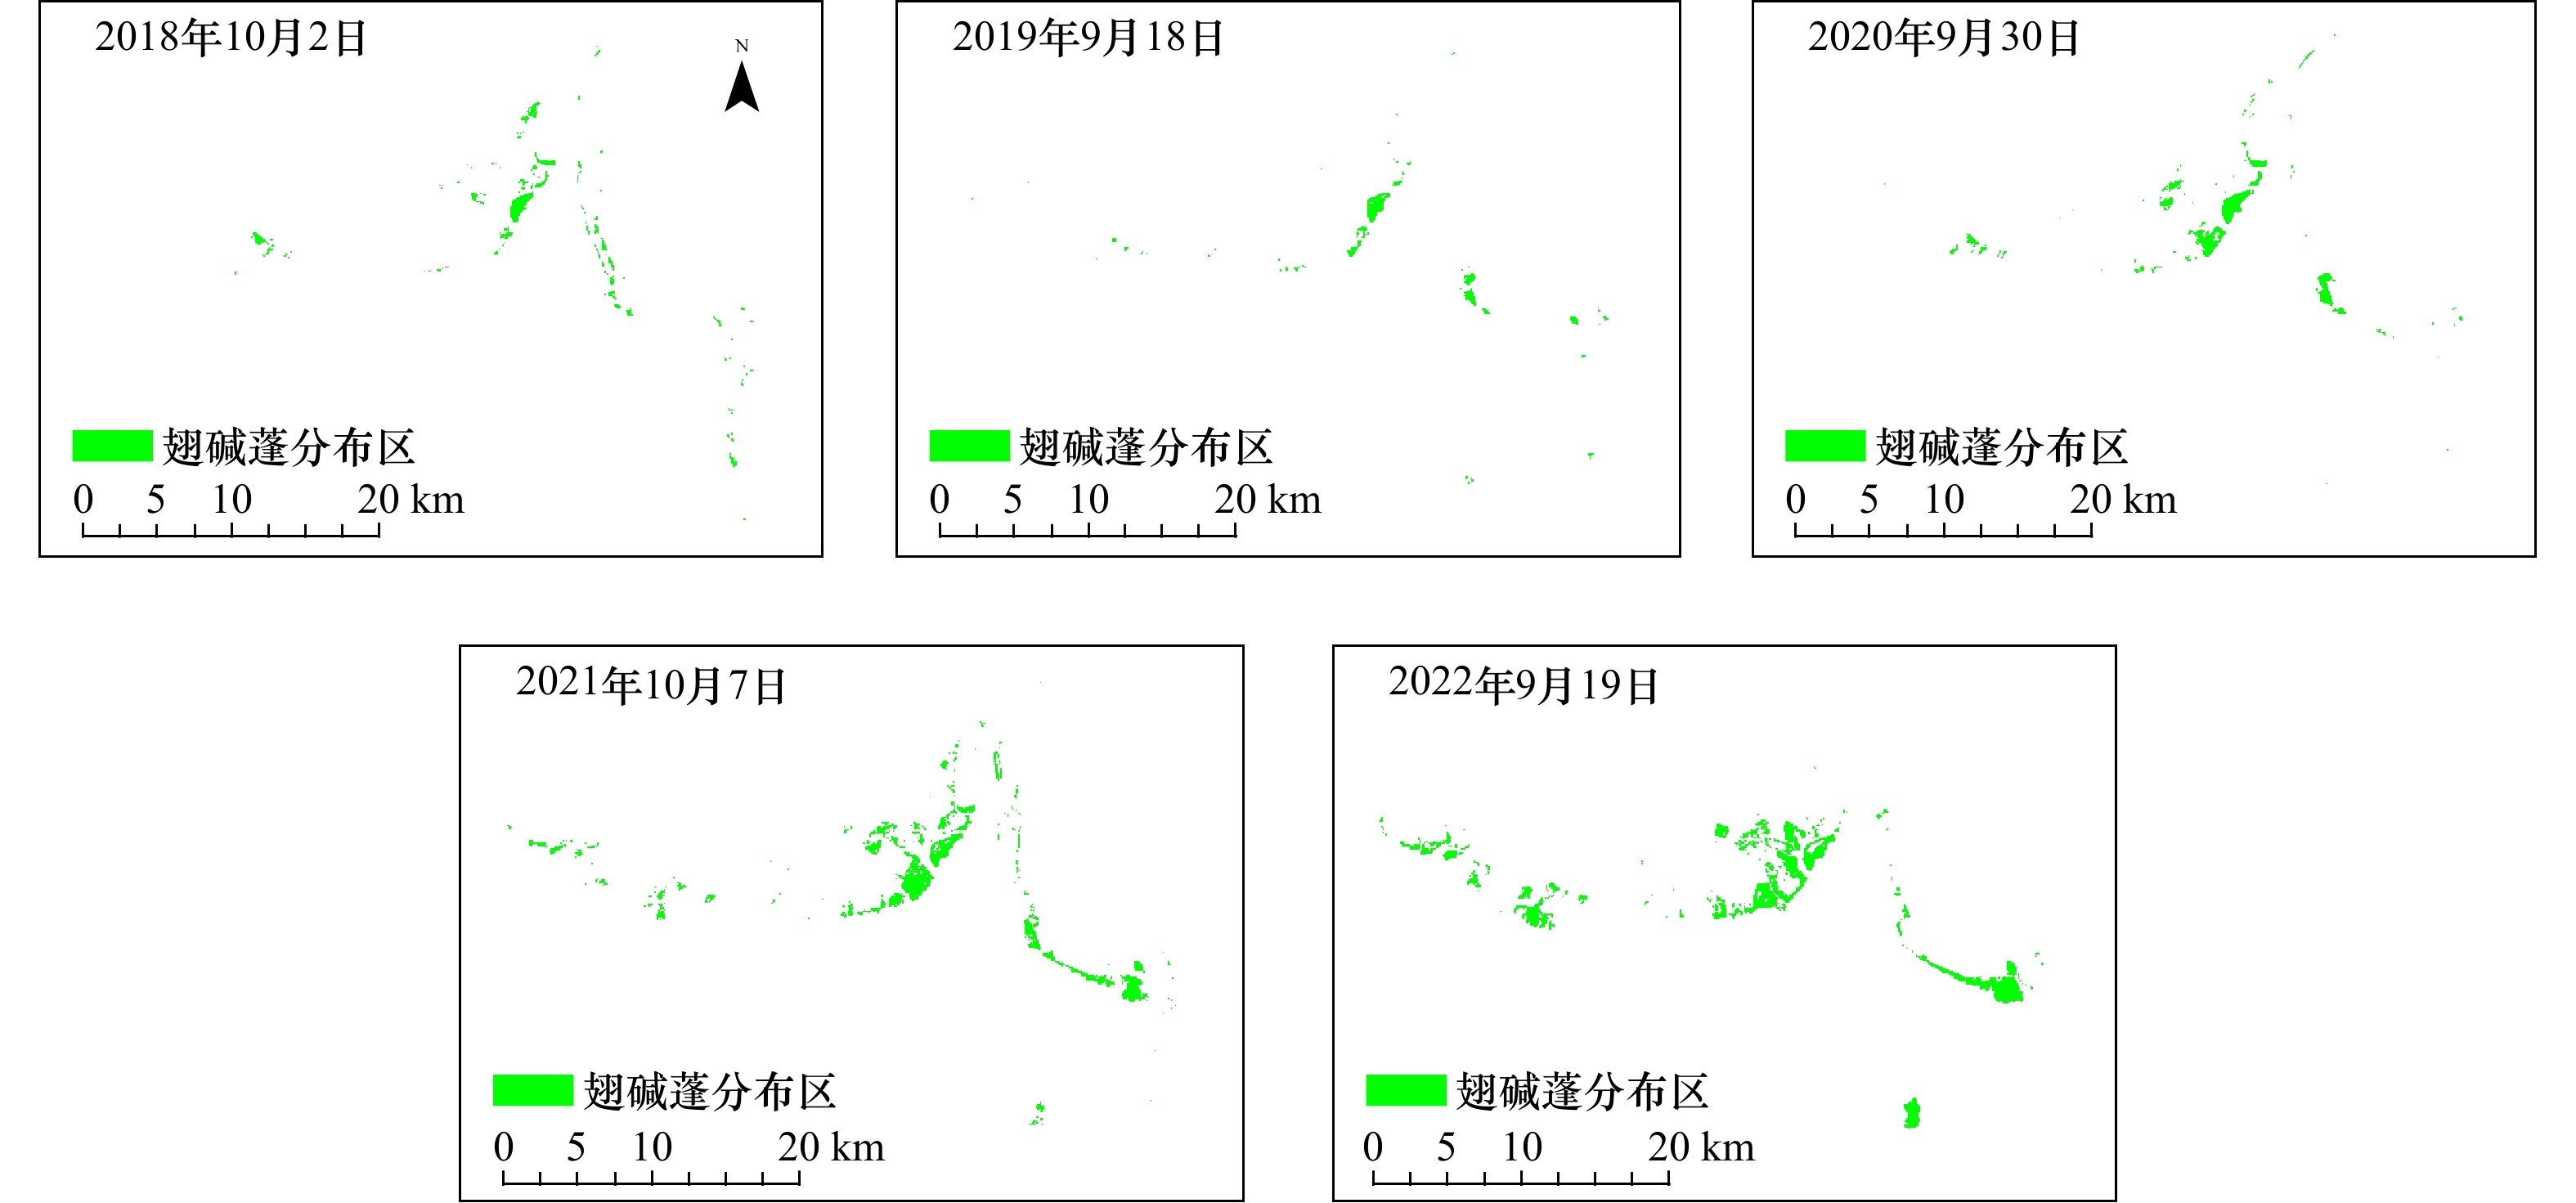
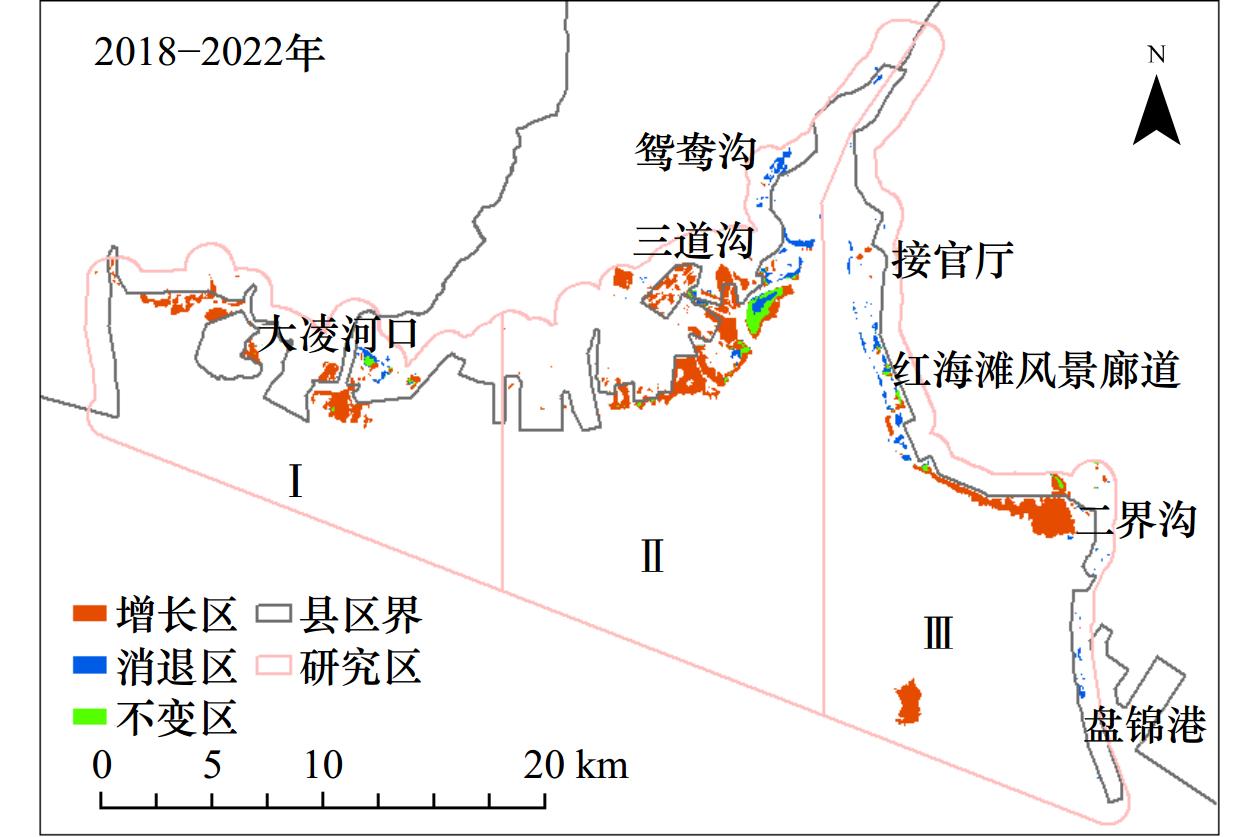
图 7 红海滩翅碱蓬分布遥感提取结果
Fig. 7 Remote sensing extraction results of Red Beach Suaeda salsa distribution
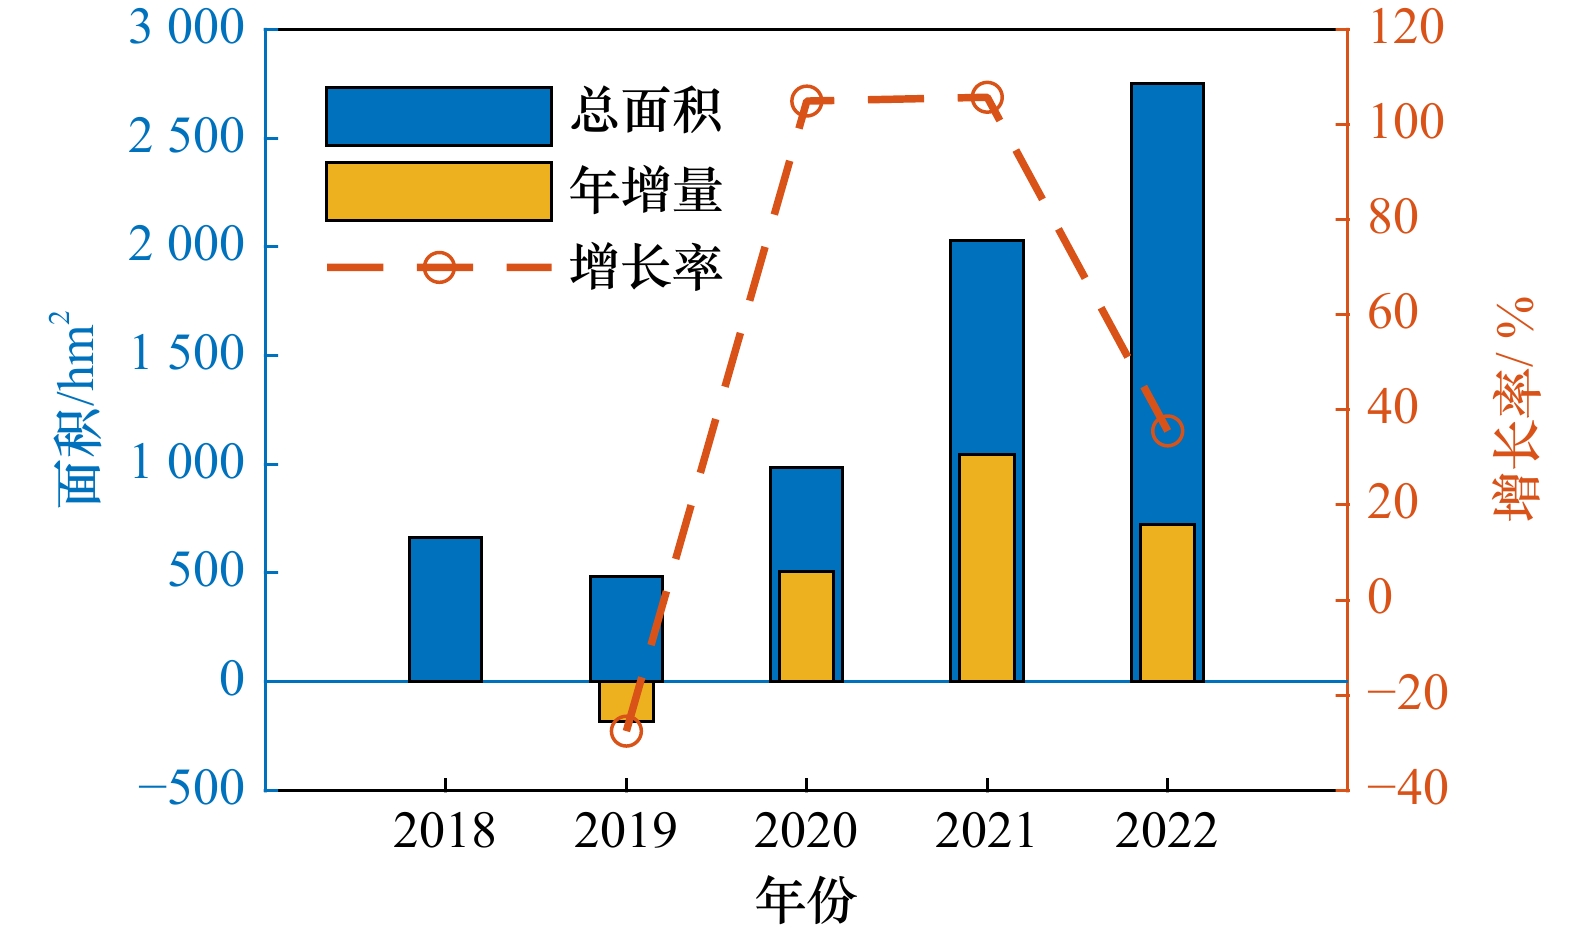
图 9 2008−2022年翅碱蓬分布面积变化情况
Fig. 9 Changes in the distribution area of Suaeda salsa from 2008 to 2022
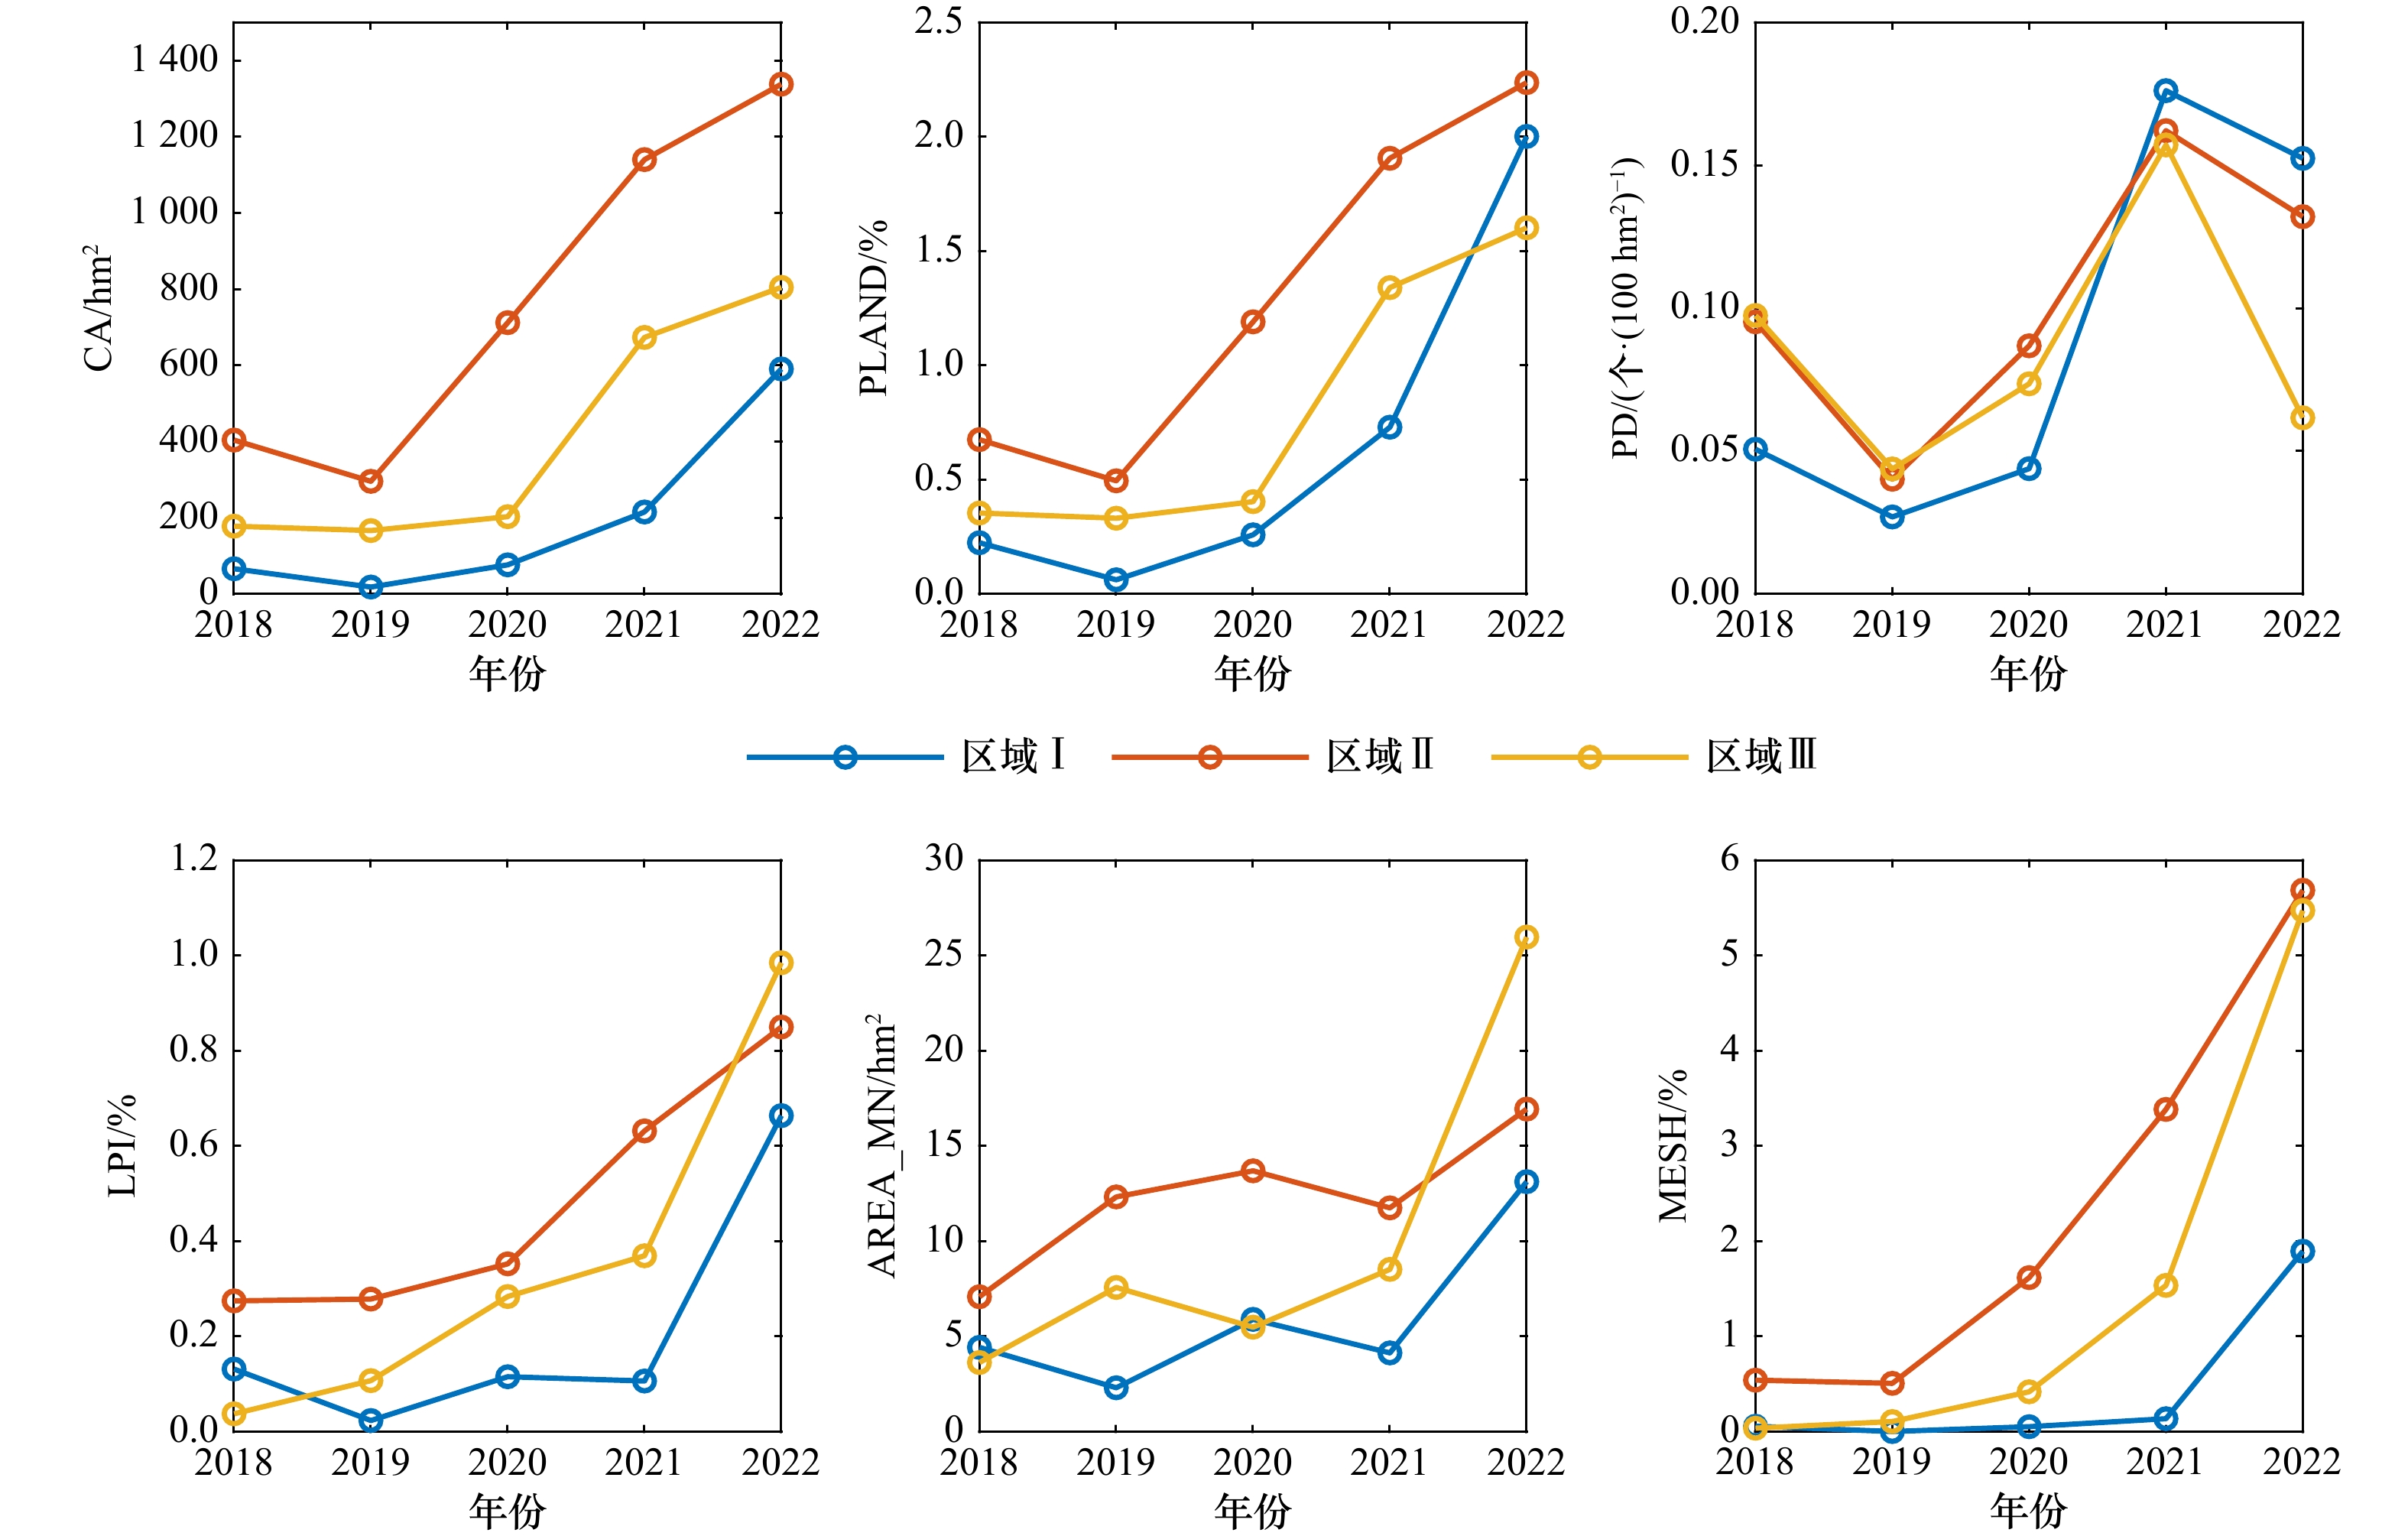
图 12 红海滩不同区域翅碱蓬景观格局指数变化曲线
Fig. 12 Landscape index change curves of Suaeda salsa in different regions of Red Beach
表 1 数据成像时间与潮位信息
Tab. 1 Data imaging time and tide level information
序号 日期 成像时间 卫星轨道号 潮位 1 2018年10月2日 10:46 359 中高潮位 2 2019年9月18日 10:50 5390 中高潮位 3 2020年9月30日 10:46 10808 中低潮位 4 2021年10月7日 10:34 16144 中低潮位 5 2022年9月19日 10:40 21118 中高潮位 注:表中潮位信息来自海事服务网(https://www.cnss.com.cn/html/tide.html)。  下载: 导出CSV
表 2 本文采用的景观格局指数列表
Tab. 2 List of landscape indices used in this article
景观指数(英文缩写) 单位 生态意义 斑块类型面积(CA) hm2 某一类型斑块的总面积 斑块所占景观面积比例(PLAND)
% 某一类型斑块总面积占整个景观面积的百分比,取值范围(0,100),值越小,表示景观中该类型越稀少 最大斑块指数(LPI)
% 某一类型中最大斑块占整个景观面积的百分比,直接体现了景观的优势类型,取值范围(0,100),值的变化反映了人类活动的方向和强弱 有效网格大小(MESH)
% 景观中斑块面积的平方和与景观总面积的比值,用于比较景观中斑块的平均面积,在景观总面积不变时,MESH变大,反映该类型面积增加,表明其在景观中的比重加大 斑块密度(PD) 个/(100 hm2) 表示每100 hm2土地范围内某一类型斑块数量 平均斑块面积(AREA_MN) hm2 某一类型斑块的平均大小,反映景观破碎程度 周长面积分维数(PAFRAC)
指景观不规则几何形状的非整数维数,反映景观形状复杂程度,能在一定程度上反映人类活动对景观格局的干扰程度,取值范围(1,2),指数越大景观越复杂,受人类活动干扰程度越高 破碎化指数(SPLIT)
表示景观空间被分割后的破碎化程度,一定程度上反映人类对景观的干扰程度,景观破碎化是生物多样性丧失的重要原因之一 聚集指数(AI) % 反映某一类型斑块间的连通性,取值范围(0,100),值越大,表示景观中同类斑块相互聚合,结构紧凑
下载: 导出CSV
表 3 已有文献中翅碱蓬提取方法及其结果精度
Tab. 3 Extraction methods and their accuracy in existing literatures
下载: 导出CSV
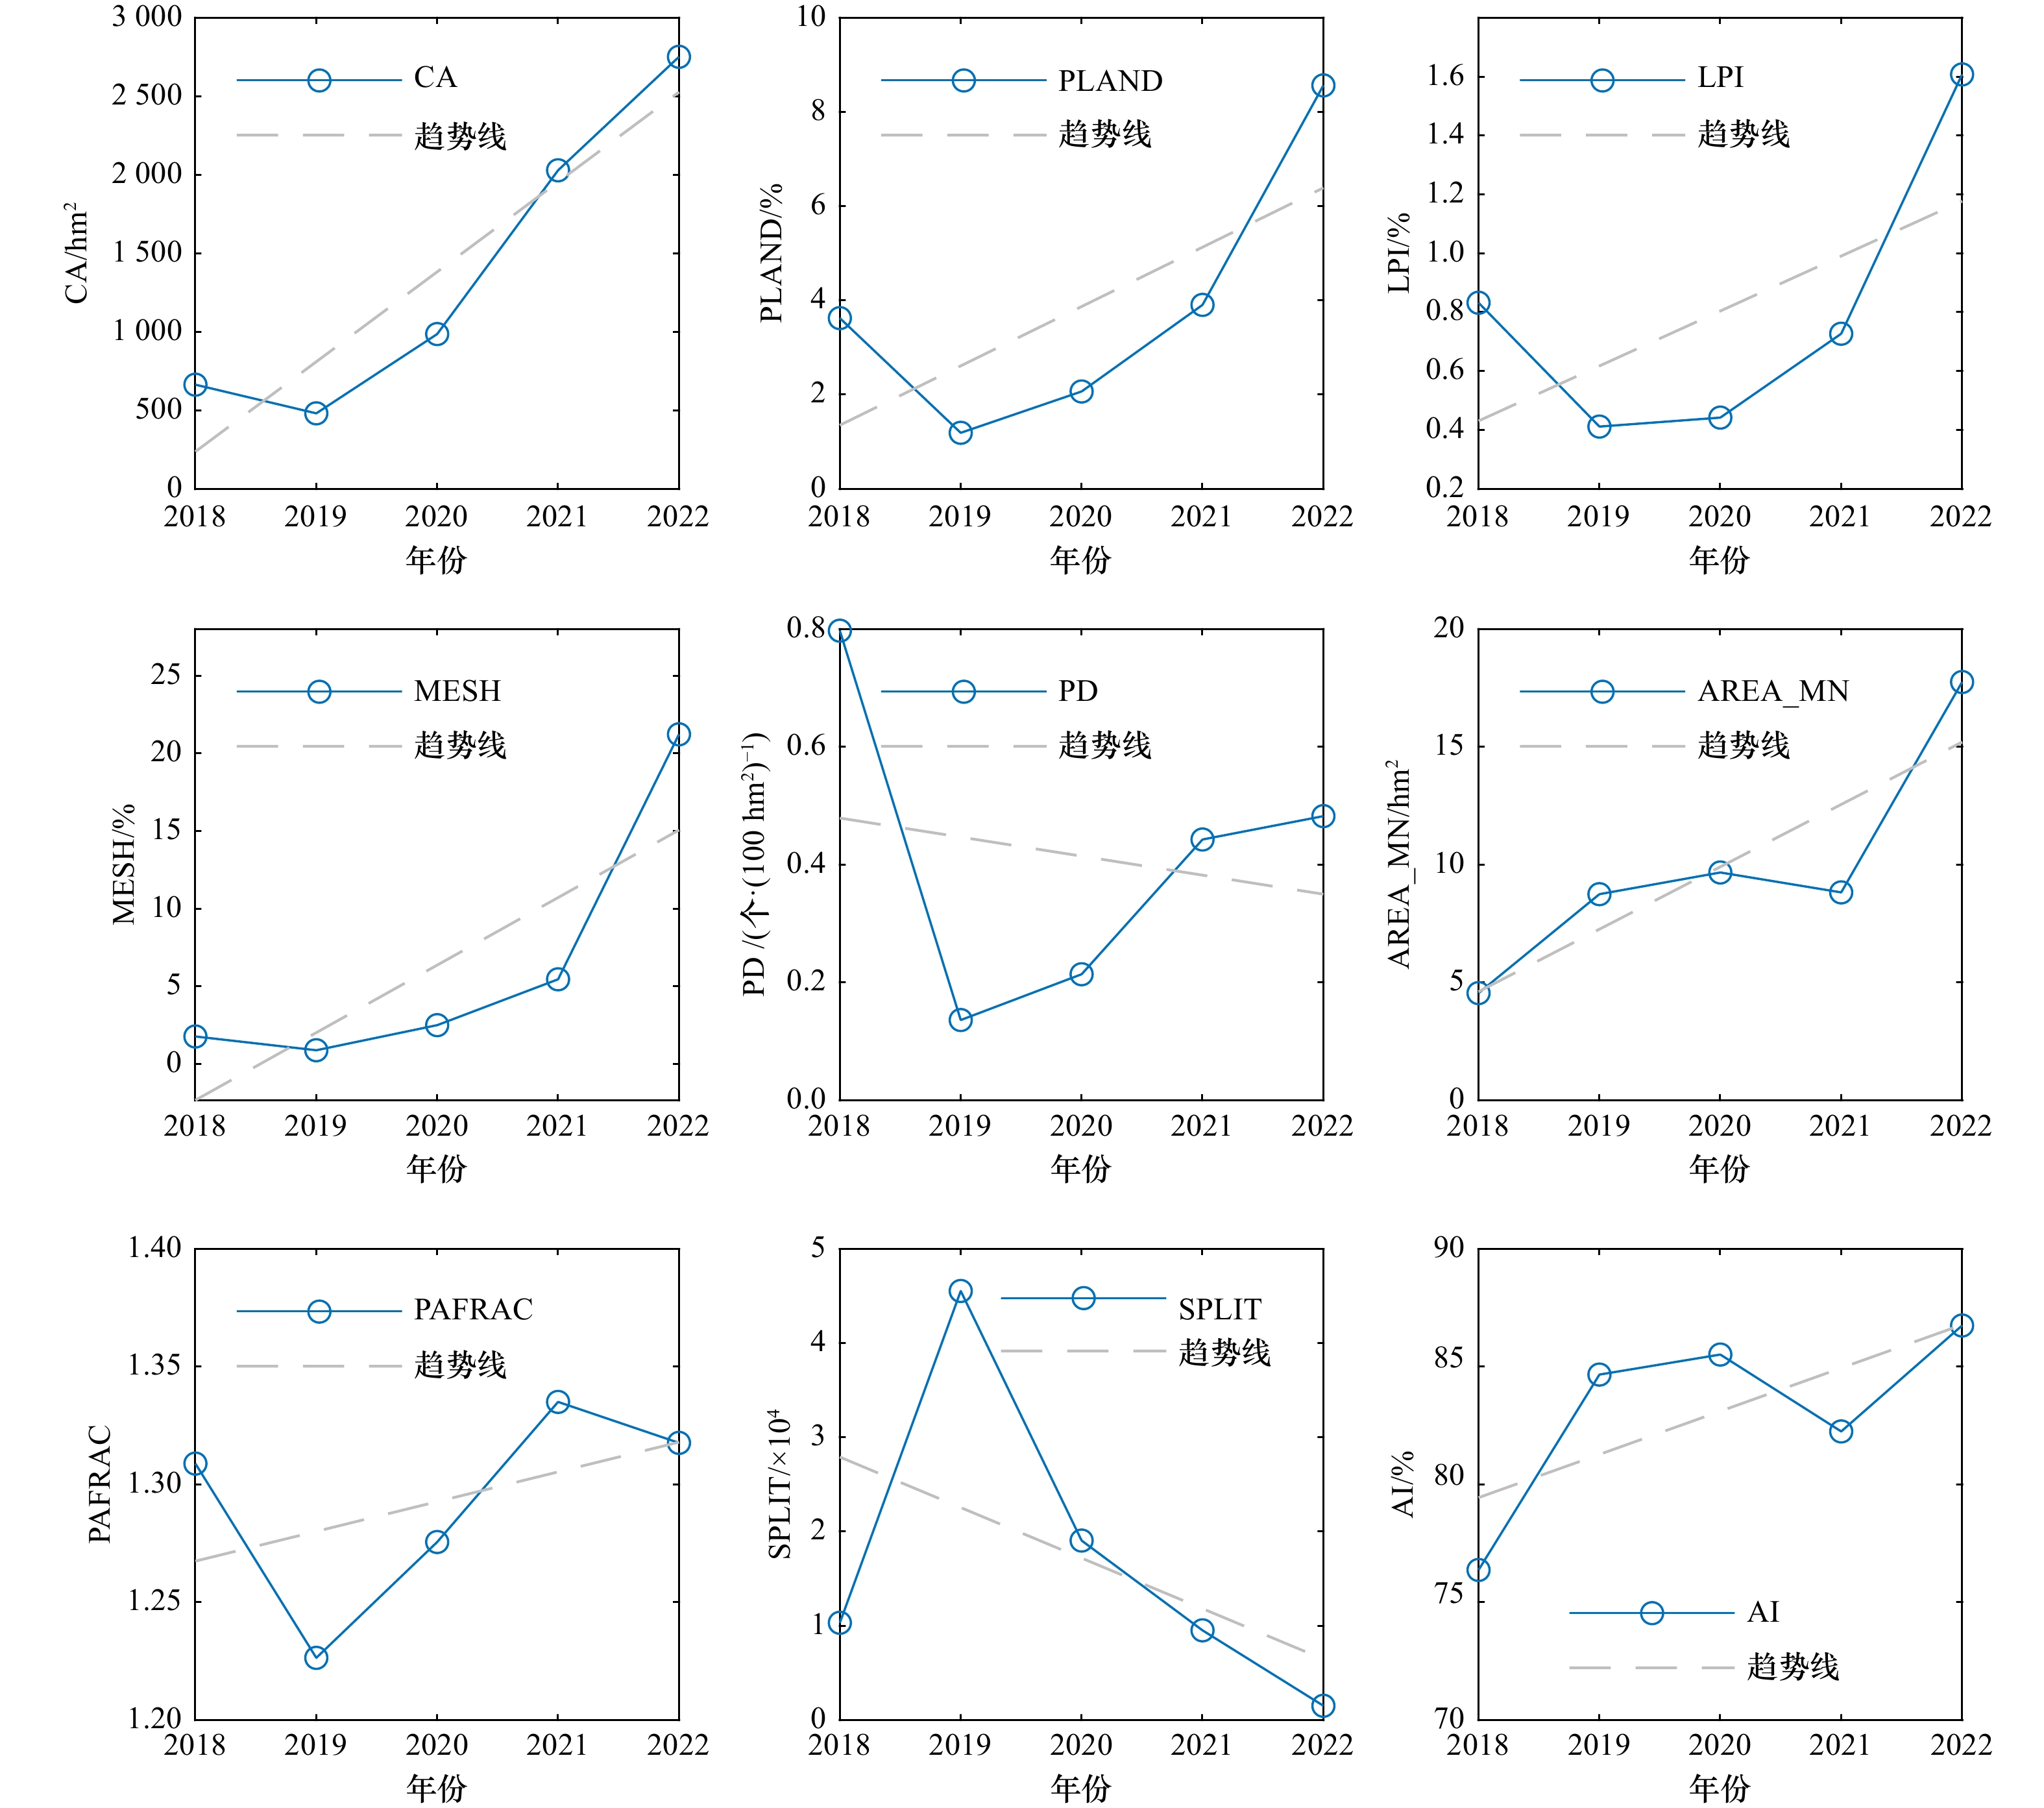
表 4 红海滩翅碱蓬群落类型水平上的景观格局指数
Tab. 4 Landscape indices at the level of community type of Red Beach Suaeda salsa
年份 CA/hm2 PLAND/% LPI/% MESH/% PD/(个·(100 hm2)−1) AREA_MN/hm2 PAFRAC SPLIT AI/% 2018 663.75 3.63 0.83 1.77 0.80 4.55 1.31 10 322.06 76.37 2019 481.13 1.19 0.41 0.89 0.14 8.75 1.23 45 552.91 84.67 2020 986.25 2.07 0.44 2.50 0.21 9.67 1.28 19 053.88 85.52 2021 2029.46 3.91 0.73 5.46 0.44 8.82 1.34 9 522.24 82.26 2022 2752.41 8.57 1.61 21.23 0.48 17.76 1.32 1 513.02 86.75
下载: 导出CSV
-
[1] 康艳华. 盘锦海岸带翅碱蓬种群退化原因的调查与分析[J]. 辽宁农业职业技术学院学报, 2004, 6(3): 27−28, 38.Kang Yanhua. The investigation analysis of why Suaeda heteroptera kitag population becoming vestigial in Panjin Coast[J]. Journal of Liaoning Agricultural Vocation-Technical College, 2004, 6(3): 27−28, 38. [2] 台培东, 苏丹, 刘延斌, 等. 双台子河口国家自然保护区红海滩景观退化机制研究[J]. 环境污染与防治, 2009, 31(1): 17−20. doi: 10.3969/j.issn.1001-3865.2009.01.006Tai Peidong, Su Dan, Liu Yanbin, et al. Degeneration mechanism research of the Red Beach landscape of the Shuangtaizi Estuary National Nature Reserve in China[J]. Environmental Pollution & Control, 2009, 31(1): 17−20. doi: 10.3969/j.issn.1001-3865.2009.01.006 [3] Zhang Minghua, Ustin S L, Rejmankova E, et al. Monitoring Pacific coast salt marshes using remote sensing[J]. Ecological Applications, 1997, 7(3): 1039−1053. doi: 10.1890/1051-0761(1997)007[1039:MPCSMU]2.0.CO;2 [4] Pham D T, Xia Junshi, Ha N T, et al. A review of remote sensing approaches for monitoring blue carbon ecosystems: mangroves, Seagrasses and salt marshes during 2010−2018[J]. Sensors, 2019, 19(8): 1933. doi: 10.3390/s19081933 [5] Li Huixuan, Wang Cuizhen, Cui Yuxin, et al. Mapping salt marsh along coastal South Carolina using U-Net[J]. ISPRS Journal of Photogrammetry and Remote Sensing, 2021, 179: 121−132. doi: 10.1016/j.isprsjprs.2021.07.011 [6] Hu Yuekai, Tian Bo, Yuan Lin, et al. Mapping coastal salt marshes in China using time series of Sentinel-1 SAR[J]. ISPRS Journal of Photogrammetry and Remote Sensing, 2021, 173: 122−134. doi: 10.1016/j.isprsjprs.2021.01.003 [7] Sun Chao, Li Jianlin, Liu Yongxue, et al. Plant species classification in salt marshes using phenological parameters derived from Sentinel-2 pixel-differential time-series[J]. Remote Sensing of Environment, 2021, 256: 112320. doi: 10.1016/j.rse.2021.112320 [8] Chen Guangwei, Jin Runjie, Ye Zhanjiang, et al. Spatiotemporal mapping of salt marshes in the intertidal zone of China during 1985−2019[J]. Journal of Remote Sensing, 2022, 2022: 9793626. [9] Li Miao, Chen Bin, Webster C, et al. The land-sea interface mapping: China’s coastal land covers at 10 m for 2020[J]. Science Bulletin, 2022, 67(17): 1750−1754. [10] Gu Jiali, Jin Runjie, Chen Guangwei, et al. Areal extent, species composition, and spatial distribution of coastal saltmarshes in China[J]. IEEE Journal of Selected Topics in Applied Earth Observations and Remote Sensing, 2021, 14: 7085−7094. doi: 10.1109/JSTARS.2021.3093673 [11] 陈官滨, 刘伟男, 贾越平, 等. 2013~2016年辽河口碱蓬湿地时空动态变化分析[J]. 现代盐化工, 2018, 45(1): 64−65. doi: 10.3969/j.issn.1005-880X.2018.01.027Chen Guanbin, Liu Weinan, Jia Yueping, et al. Analysis on the spatial and temporal changes of Suaeda salsa’ biomass in Liaohe Estuary during 2013 to 2016[J]. Modern Salt and Chemical Industry, 2018, 45(1): 64−65. doi: 10.3969/j.issn.1005-880X.2018.01.027 [12] 吴涛, 赵冬至, 康建成, 等. 辽东湾双台子河口湿地翅碱蓬( Suaeda salsa)生物量遥感反演研究[J]. 生态环境学报, 2011, 20(1): 24−29. doi: 10.3969/j.issn.1674-5906.2011.01.005Wu Tao, Zhao Dongzhi, Kang Jiancheng, et al. Suaeda salsa dynamic remote monitoring and biomass remote sensing inversion in Shuangtaizi River Estuary[J]. Ecology and Environmental Sciences, 2011, 20(1): 24−29. doi: 10.3969/j.issn.1674-5906.2011.01.005 [13] 牟蒙. 基于高光谱遥感的翅碱蓬生物量反演模型研究[D]. 大连: 大连海洋大学, 2016.Mu Meng. Inversion model study of Suaeda salsa biomass based on hyperspectral remote sensing[D]. Dalian: Dalian Ocean University, 2016. [14] 陈官滨. 辽河滨海湿地翅碱蓬群落年碳储量遥感评估[D]. 大连: 大连海洋大学, 2018.Chen Guanbin. Remote sensing assessment of carbon storage by coastal wetlands in Liaohe Estuary[D]. Dalian: Dalian Ocean University, 2018. [15] 李晋, 乔会婷, 徐天平, 等. 辽河口红海滩湿地海域潮流及盐度的数值模拟[J]. 大连海洋大学学报, 2018, 33(5): 625−632. doi: 10.16535/j.cnki.dlhyxb.2018.05.013Li Jin, Qiao Huiting, Xu Tianping, et al. Numerical simulation of tidal flow and salinity in Pink Beach wetlands of Liao River Estuary, China[J]. Journal of Dalian Ocean University, 2018, 33(5): 625−632. doi: 10.16535/j.cnki.dlhyxb.2018.05.013 [16] 李微, 王文硕, 张新宇, 等. 基于HY-1C CZI数据的辽河口湿地盐地碱蓬群落碳储量评估[J]. 大连海洋大学学报, 2022, 37(4): 574−583.Li Wei, Wang Wenshuo, Zhang Xinyu, et al. Carbon storage assessment of sea grass Suaeda salsa community in Liaohe Estuary wetland based on HY-1C CZI data[J]. Journal of Dalian Ocean University, 2022, 37(4): 574−583. [17] 孙圳. 辽河口湿地翅碱蓬植被年际变化及其影响因素的相关性研究[D]. 大连: 大连海洋大学, 2018.Sun Zhen. Interannual change of Suaeda heteroptera in the wetland of Liaohe Estuary and correlation study of its influencing factors[D]. Dalian: Dalian Ocean University, 2018. [18] 苏岫, 李悦铭, 景昕蒂, 等. 基于GF-6的翅碱蓬生长密度遥感定量反演[J]. 海洋环境科学, 2023, 42(1): 151−159.Su Xiu, Li Yueming, Jing Xindi, et al. Quantitative remote sensing inversion of Suaeda salsa growth density based on GF-6[J]. Marine Environmental Science, 2023, 42(1): 151−159. [19] 赵英伟. 辽河口东岸翅碱蓬湿地时空演变分析及分区研究[D]. 沈阳: 沈阳农业大学, 2020.Zhao Yingwei. Spatiotemporal evolution and regionalization of Suaeda salsa wetland degradation in Liaohe Estuary[D]. Shenyang: Shenyang Agricultural University, 2020. [20] 钱凤魁, 李婉宁, 赵英伟, 等. 辽河口东岸翅碱蓬湿地退化分区及其土壤影响因素分析[J]. 沈阳农业大学学报, 2021, 52(5): 611−617.Qian Fengkui, Li Wanning, Zhao Yingwei, et al. Analysis on degradation areas of Suaeda salsa wetland and soil properties in Liaohe Estuary[J]. Journal of Shenyang Agricultural University, 2021, 52(5): 611−617. [21] 温广玥. 1997−2018年辽河口翅碱蓬生物群落时空变化特征研究[D]. 北京: 中国地质大学(北京), 2020.Wen Guangyue. The temporal and spatial variation of Suaeda salsa in Liaohe Estuary from 1997 to 2018[D]. Beijing: China University of Geosciences (Beijing), 2020. [22] 李建国, 杨德明, 胡克, 等. 盘锦市红海滩碱蓬空间特征研究[J]. 吉林大学学报(地球科学版), 2006, 36(S1): 108−112. doi: 10.13278/j.cnki.jjuese.2006.s1.024Li Jianguo, Yang Deming, Hu Ke, et al. Study on hetroptera kitag spatial characteristics in Honghai Beach of Panjin City[J]. Journal of Jilin University (Earth Science Edition), 2006, 36(S1): 108−112. doi: 10.13278/j.cnki.jjuese.2006.s1.024 [23] 周林飞, 李成明, 王英敏. 辽河三角洲湿地景观破碎化分析[J]. 辽宁工程技术大学学报(自然科学版), 2013, 32(1): 97−101.Zhou Linfei, Li Chengming, Wang Yingmin. Landscape fragmentation analysis of Liaohe River Delta wetland[J]. Journal of Liaoning Technical University (Natural Science), 2013, 32(1): 97−101. [24] 吴英超. 双台子河口滨海湿地景观格局动态变化分析[D]. 大连: 大连海事大学, 2011.Wu Yingchao. The study on dynamic change of coastal wetland landscape patterns at Shuangtaizi River[D]. Dalian: Dalian Maritime University, 2011. [25] 郝向磊, 邓磊, 贺英. 盘锦湿地翅碱蓬景观变化的遥感监测与分析[J]. 湿地科学与管理, 2017, 13(4): 31−36. doi: 10.3969/j.issn.1673-3290.2017.04.08Hao Xianglei, Deng Lei, He Ying. An analysis of dynamic monitoring and landscape pattern change of Suaeda salsa wetlands in Panjin using remote sensing technology[J]. Wetland Science & Management, 2017, 13(4): 31−36. doi: 10.3969/j.issn.1673-3290.2017.04.08 [26] 刘婷, 刘兴土, 杜嘉, 等. 五个时期辽河三角洲滨海湿地格局及变化研究[J]. 湿地科学, 2017, 15(4): 622−628. doi: 10.13248/j.cnki.wetlandsci.2017.04.022Liu Ting, Liu Xingtu, Du Jia, et al. Pattern and change of coastal wetlands in the Liaohe River Delta for 5 periods[J]. Wetland Science, 2017, 15(4): 622−628. doi: 10.13248/j.cnki.wetlandsci.2017.04.022 [27] 王旖旎, 康亚茹, 陈旭, 等. 辽河口潮滩湿地景观格局空间演变的动态分析[J]. 大连海洋大学学报, 2021, 36(6): 1009−1017.Wang Yini, Kang Yaru, Chen Xu, et al. Dynamic analysis of spatial evolution of landscape pattern in the tidal flat wetlands at Liao River Estuary[J]. Journal of Dalian Ocean University, 2021, 36(6): 1009−1017. [28] 陈旭, 詹泽荣, 弓耘, 等. 辽河口潮滩典型盐沼植被退化影响因素分析[J]. 人民黄河, 2022, 44(7): 81−85. doi: 10.3969/j.issn.1000-1379.2022.07.015Chen Xu, Zhan Zerong, Gong Yun, et al. Analysis of Influence factors of typical salt vegetation degradation in tidal wetland of Liaohe River Estuary[J]. Yellow River, 2022, 44(7): 81−85. doi: 10.3969/j.issn.1000-1379.2022.07.015 [29] 孟泰舟. 辽河入海口两岸翅碱蓬分布变化情况及退化影响因素分析[J]. 现代农业科技, 2020(11): 216−217. doi: 10.3969/j.issn.1007-5739.2020.11.131Meng Taizhou. Analysis of the distribution changes and degradation influencing factors of Suaeda heteroptera on both sides of the Liaohe River Estuary[J]. Modern Agricultural Science and Technology, 2020(11): 216−217. doi: 10.3969/j.issn.1007-5739.2020.11.131 [30] 梁超, 刘利, 刘建强, 等. 基于HY-1C CZI影像光谱指数重构数据MNF变换的红树林提取[J]. 海洋学报, 2020, 42(4): 104−112.Liang Chao, Liu Li, Liu Jianqiang, et al. Extracting mangrove information using MNF transformation based on HY-1C CZI spectral indices reconstruction data[J]. Haiyang Xuebao, 2020, 42(4): 104−112. [31] 邹亚荣, 刘建强, 梁超, 等. 基于HY-1C卫星CZI数据的红树林长势遥感监测[J]. 海洋学研究, 2020, 38(1): 68−76. doi: 10.3969/j.issn.1001-909X.2020.01.008Zou Yarong, Liu Jianqiang, Liang Chao, et al. Monitoring of mangrove growth using HY-1C Satellite CZI data based on remote sensing[J]. Journal of Marine Sciences, 2020, 38(1): 68−76. doi: 10.3969/j.issn.1001-909X.2020.01.008 [32] 韩秀珍, 吴朝阳, 郑伟, 等. 基于水面实测光谱的太湖蓝藻卫星遥感研究[J]. 应用气象学报, 2010, 21(6): 724−731.Han Xiuzhen, Wu Chaoyang, Zheng Wei, et al. Satellite remote sensing of cyanophyte using observed spectral measurements over the Taihu Lake[J]. Journal of Applied Meteorological Science, 2010, 21(6): 724−731. [33] 岩学斌, 袁金海. 盐胁迫对植物生长的影响[J]. 安徽农业科学, 2019, 47(4): 30−33.Yan Xuebin, Yuan Jinhai. Effects of salt stress on plant growth[J]. Journal of Anhui Agricultural Sciences, 2019, 47(4): 30−33. [34] 韩海华, 梁名志, 王丽, 等. 花青素的研究进展及其应用[J]. 茶叶, 2011, 37(4): 217−220. doi: 10.3969/j.issn.0577-8921.2011.04.006Han Haihua, Liang Mingzhi, Wang Li, et al. Research progress of anthocyanin[J]. Journal of Tea, 2011, 37(4): 217−220. doi: 10.3969/j.issn.0577-8921.2011.04.006 [35] 张正龙. 我国黄、东海浒苔和马尾藻的遥感鉴别及绿潮发生过程研究[D]. 上海: 华东师范大学, 2014.Zhang Zhenglong. Remote sensing identification of Ulva prolifra and Sargassum and evolution of green tide in the Yellow Sea and the East China Sea[D]. Shanghai: East China Normal University, 2014. [36] O’Neill R V, Krummel J R, Gardner R H, et al. Indices of landscape pattern[J]. Landscape Ecology, 1988, 1(3): 153−162. doi: 10.1007/BF00162741 [37] He H S, DeZonia B E, Mladenoff D J. An aggregation index (AI) to quantify spatial patterns of landscapes[J]. Landscape Ecology, 2000, 15(7): 591−601. doi: 10.1023/A:1008102521322 [38] Jaeger J A G. Landscape division, splitting index, and effective mesh size: new measures of landscape fragmentation[J]. Landscape Ecology, 2000, 15(2): 115−130. doi: 10.1023/A:1008129329289 [39] 邬建国. 景观生态学——格局、过程、尺度与等级[M]. 2版. 北京: 高等教育出版社, 2007.Wu Jianguo. Landscape Ecology: Pattern, Process, Scale and Hierarchy[M]. 2nd ed. Beijing: Higher Education Press, 2007. [40] Wu Jianguo, Shen Weijun, Sun Weizhong, et al. Empirical patterns of the effects of changing scale on landscape metrics[J]. Landscape Ecology, 2002, 17(8): 761−782. doi: 10.1023/A:1022995922992 [41] 杨鹏, 高祺, 张艳品, 等. 基于Fragstats4的景观格局指数与地表温度的相关性——以石家庄市为例[J]. 气象科技, 2021, 49(3): 464−474. doi: 10.19517/j.1671-6345.20200207Yang Peng, Gao Qi, Zhang Yanpin, et al. A Fragstats4-based case study of correlation between landscape pattern index and surface temperature in Shijiazhuang[J]. Meteorological Science and Technology, 2021, 49(3): 464−474. doi: 10.19517/j.1671-6345.20200207 [42] 高范, 乌立国, 贾世娜, 等. 辽河口翅碱蓬降滩修复效果评估及其影响机制研究[J]. 环境生态学, 2022, 4(6): 49−53.GAO Fan, WU Liguo, JIA Shina, et al. Study on evaluation and impact mechanism of beach lowering restoration effect of Suaeda Heteroptera wetland in Liaohe Estuary[J]. Environmental Ecology, 2022, 4(6): 49−53. -


计量
- 文章访问数: 528
- HTML全文浏览量: 292
- PDF下载量: 31
- 被引次数: 0
