

Identification and correction of airborne laser bathymetry intensity data in AGC compensated abnormal zone
-
摘要: 机载激光测深系统(Airborne Laser Bathymetry,ALB)因集成了具有独特水体穿透能力的绿波段(532 nm)而被广泛用于水深测量。除地形数据外,ALB还记录了地物目标的辐射特性(后向散射强度),可用于条带配准、海底底质分类和几何建模。然而,由于自动增益控制(Automatic Gain Control,AGC)设计局限,增益值调整存在延缓,对于裸露岩石、水域等高返回、低返回目标较多的海岛海岸带区域,强度补偿异常问题格外突出。针对该问题本文设计了一种基于双向移动的局部加权强度改正方法,提出索引共享机制辅以地形信息实现有效强度数据精确提取;以扫描周期为依据进行扫描线分割,通过柯尔莫可洛夫−斯米洛夫检验进行强度补偿异常区识别;通过对邻近扫描线和邻域强度联合加权进行强度改正,保证强度细节的同时较好地消除与邻域强度偏差,独特的双向移动策略能有效削弱改正不足积累造成的强度改正精度下降问题。实验证明该方法能有效解决AGC补偿异常问题,相较于改正前,改正后的强度数据平均绝对百分比误差降低了约0.27,均方根误差下降了约693,异常区强度与邻域强度偏差控制在26 DN(Digital Number)以内,得到高质量强度图像。Abstract: Airborne Laser Bathymetry (ALB) as an established surveying procedure is certainly operated in blue-green region (532 nm) for penetrating the water column to collect depth. Alongside geometric information accepted widely, ALB typically record the radiometric properties (backscattering intensity) about sensed targets and assist with accurate strips registration, fine ground (sediment) cover classification, and advanced geometric modelling. However, due to the design limitations of Automatic Gain Control (AGC), there is a delay in gain value adjustment, particularly prominent in island and coastal areas with more high-return and low-return targets such as exposed rocks and water, which throws the issue of intensity compensation abnormality into stark relief. In response to this issue, a local weighted intensity correction method based on bidirectional movement is designed. Firstly, effective intensity is extracted by index sharing and elevation information. Then, the emission angles are used to divide the scan line and serve as the judgment unit, and the Kolmogorov-Smirnov test is used to identify the abnormal area. Finally, intensity correction is performed by joint weighting of adjacent scan lines and neighborhood intensity, where the joint weighting can ensure the intensity details while eliminating the deviation from the neighborhood intensity. In addition, a unique bidirectional moving strategy is introduced to weaken the decline of strength correction accuracy caused by insufficient correction accumulation. Experiments have illustrated that this approach can effectively solve the AGC compensation anomaly problem, and compared to the pre-correction, the average absolute percentage error of the corrected intensity data decreased by about 0.27, the root mean square error decreased by about 693, and the intensity deviation of the abnormal area was controlled within 26 DN (Digital Number), thus obtaining a high-quality intensity image.
-
Key words:
- airborne laser bathymetry /
- automatic gain control /
- intensity correction /
- scan line
-

图 1 ALB强度数据AGC补偿异常区示意图
Fig. 1 Schematic diagram for the AGC compensation abnormal area of ALB intensity data
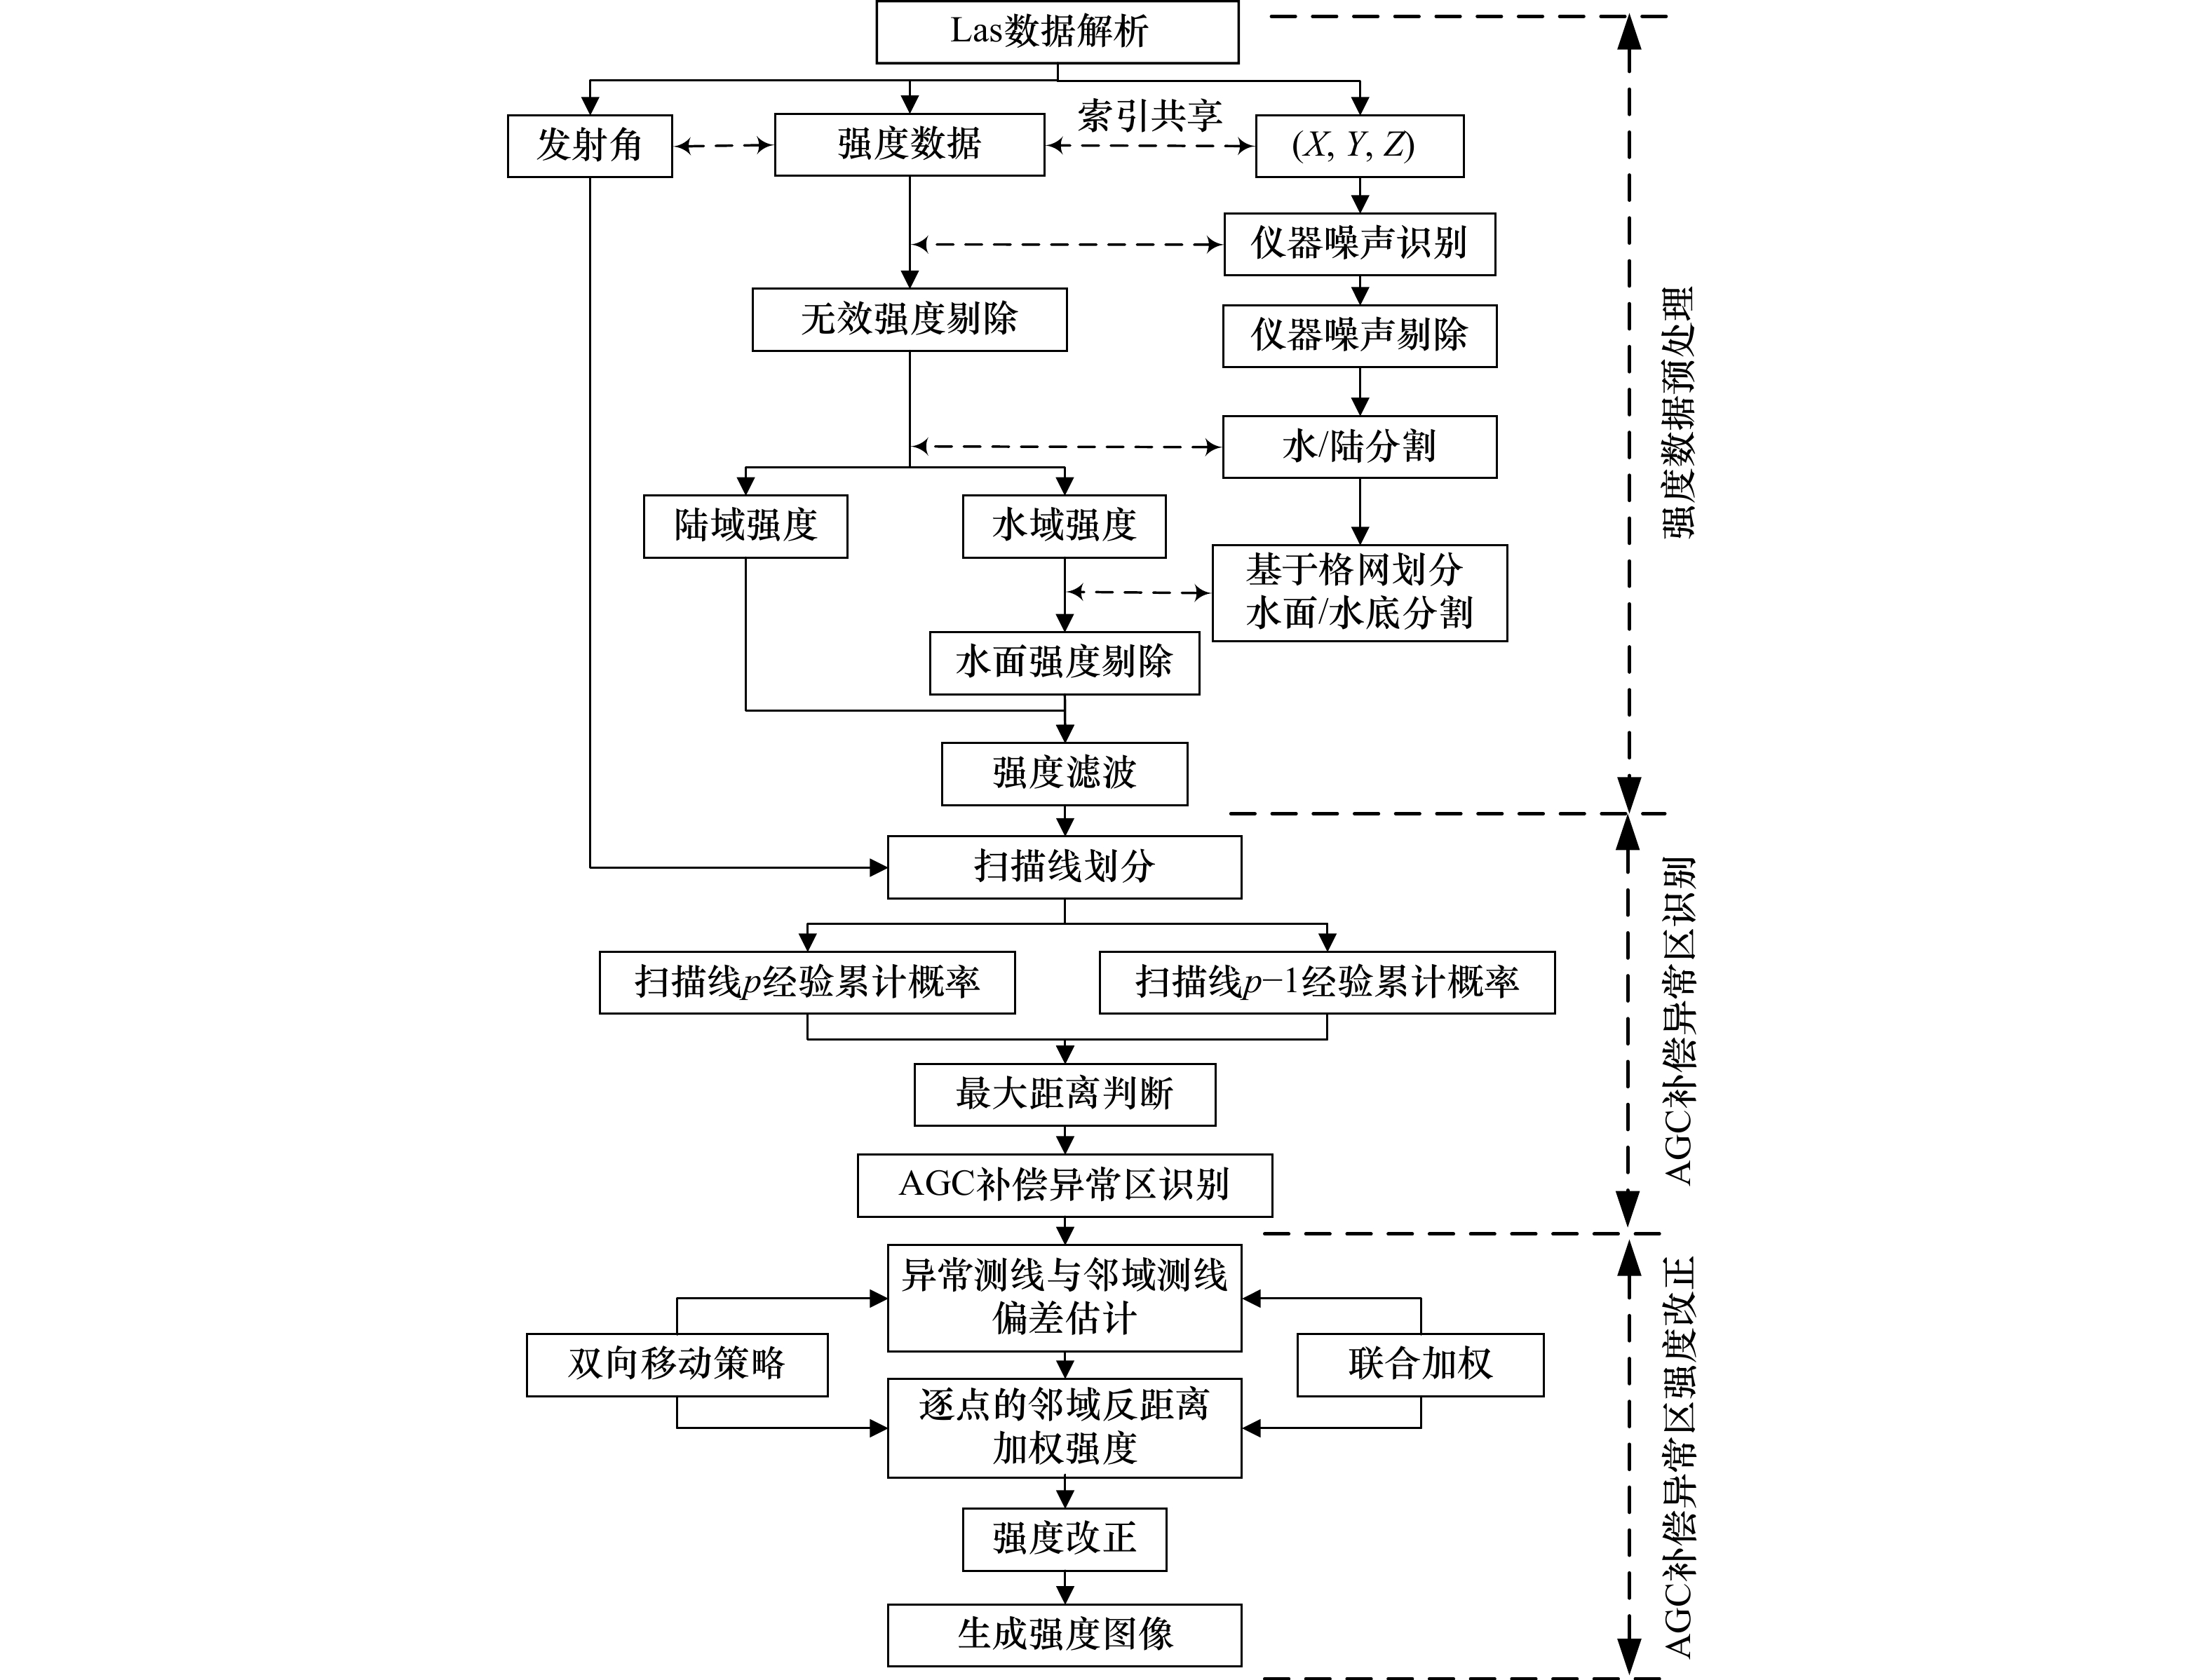
图 2 AGC强度补偿异常区识别及改正工作流程图
Fig. 2 Flow chart of identification and correction of AGC correction abnormal area

图 3 双向移动的局部加权强度改正示意图
Fig. 3 Bidirectional movement-based local weighted intensity correction diagram

图 5 补偿异常扫描线与邻近正常扫描线的强度对比
Fig. 5 The intensity comparison between abnormal scan lines and adjacent normal scan lines
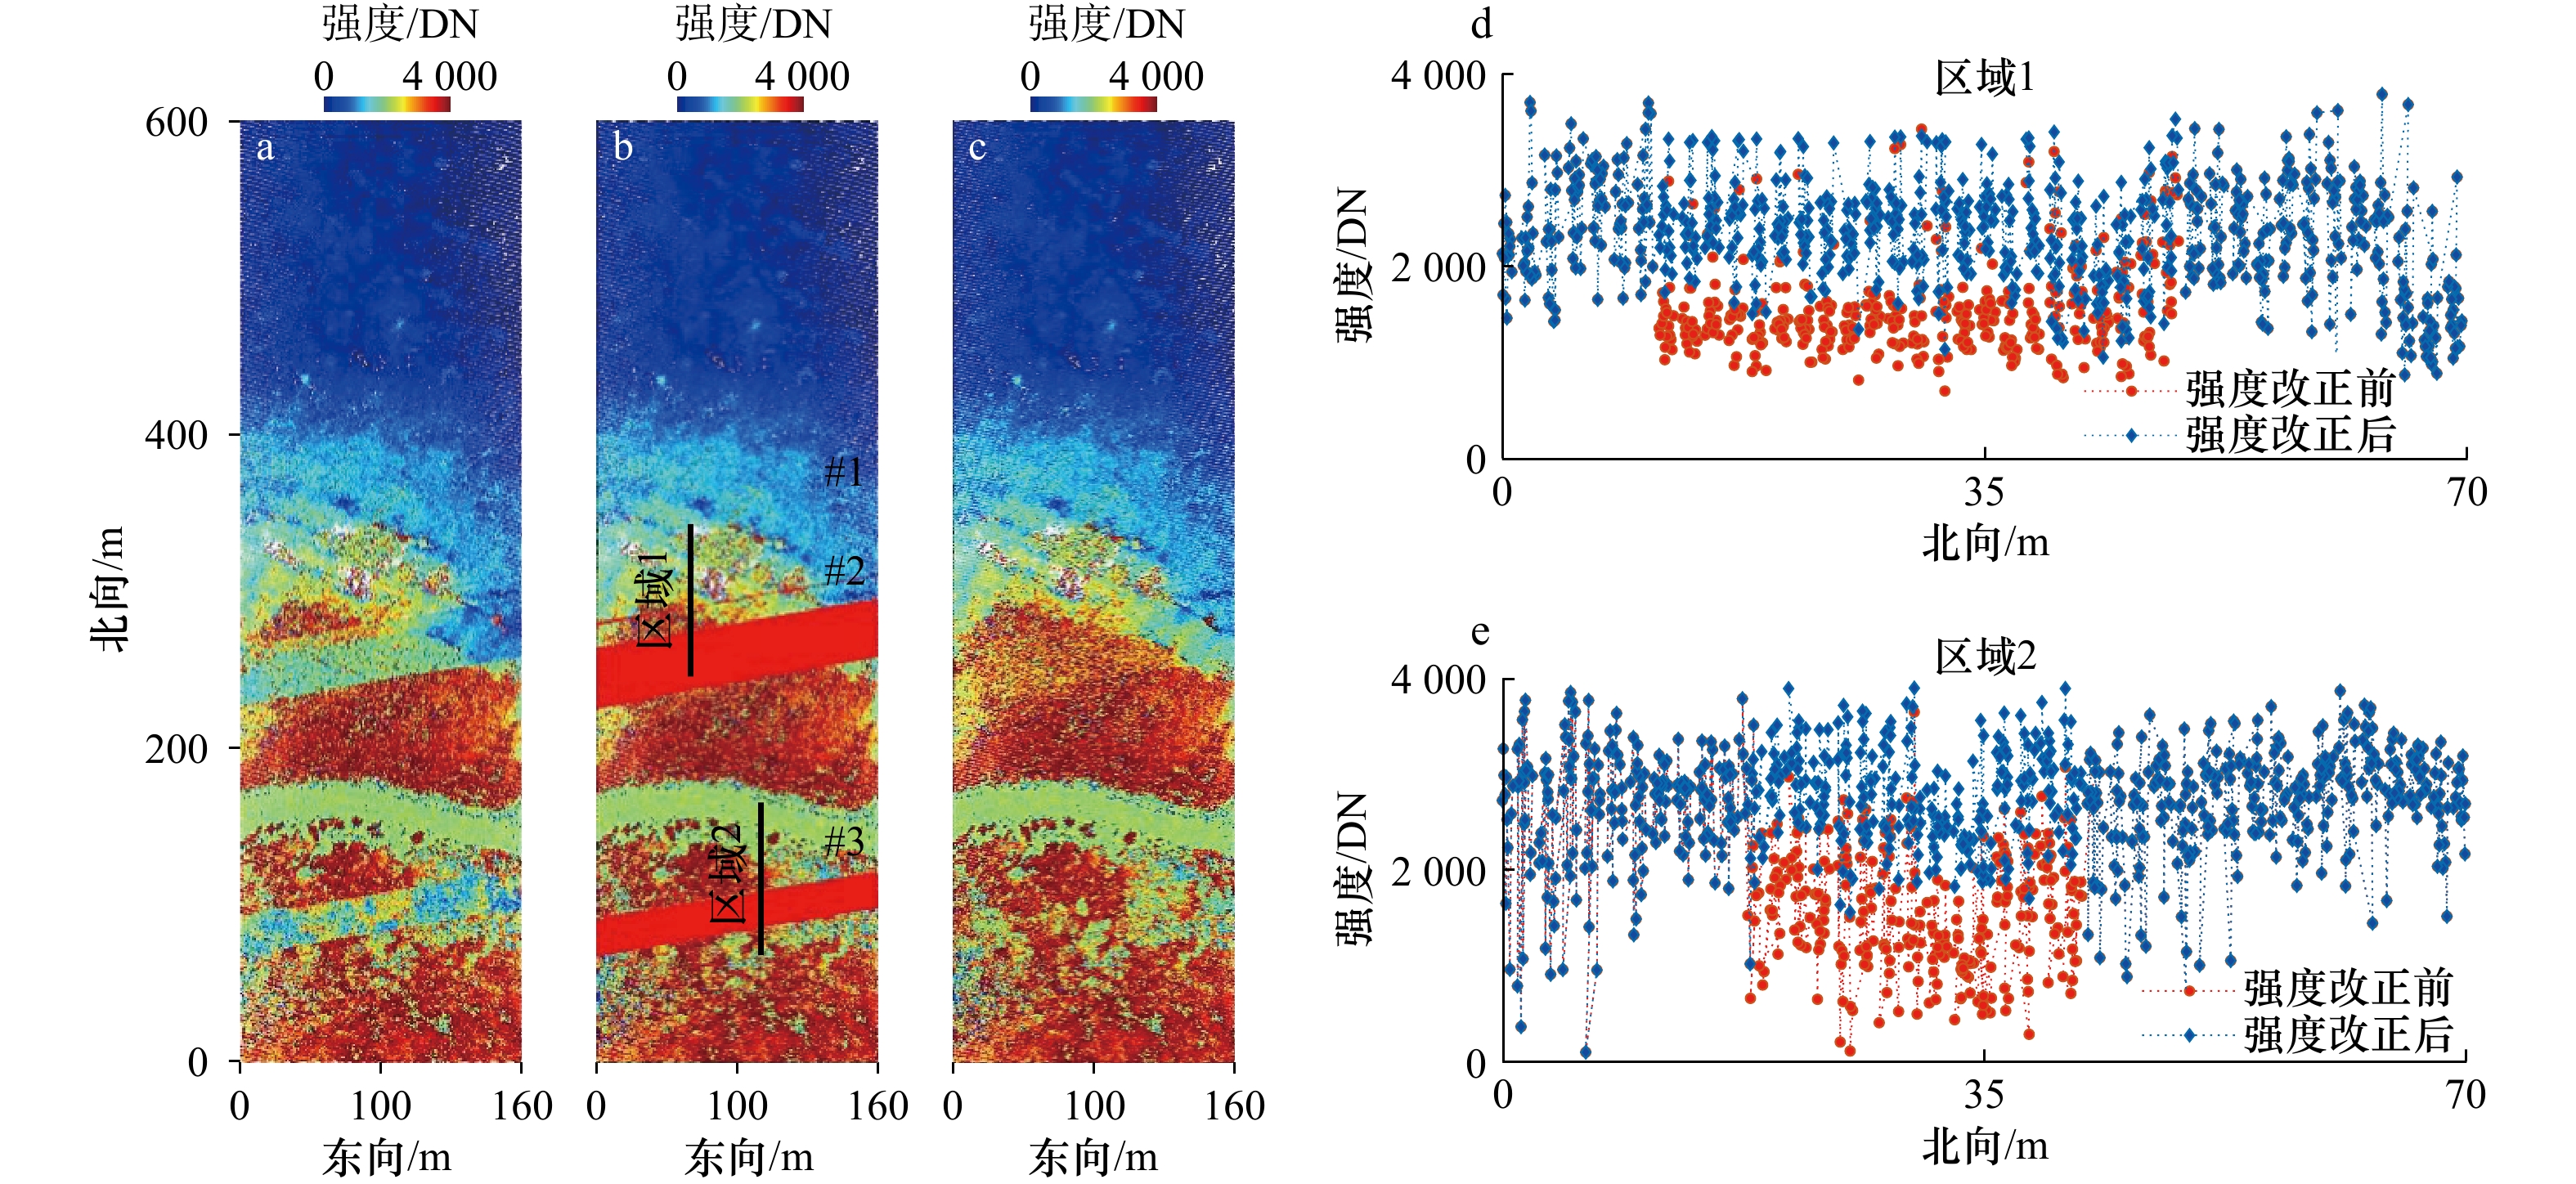
图 6 强度改正前后对比
a. 改正前强度图像;b. AGC补偿异常扫描线分布;c. 改正后强度图像;d. 区域1强度改正前后;e. 区域2强度改正前后
Fig. 6 Comparison before and after intensity correction
a. Intensity image before correction; b. AGC compensation abnormal scan line distribution; c. intensity image after correction; d. Region 1 before and after intensity correction; e. Region 2 before and after intensity correction
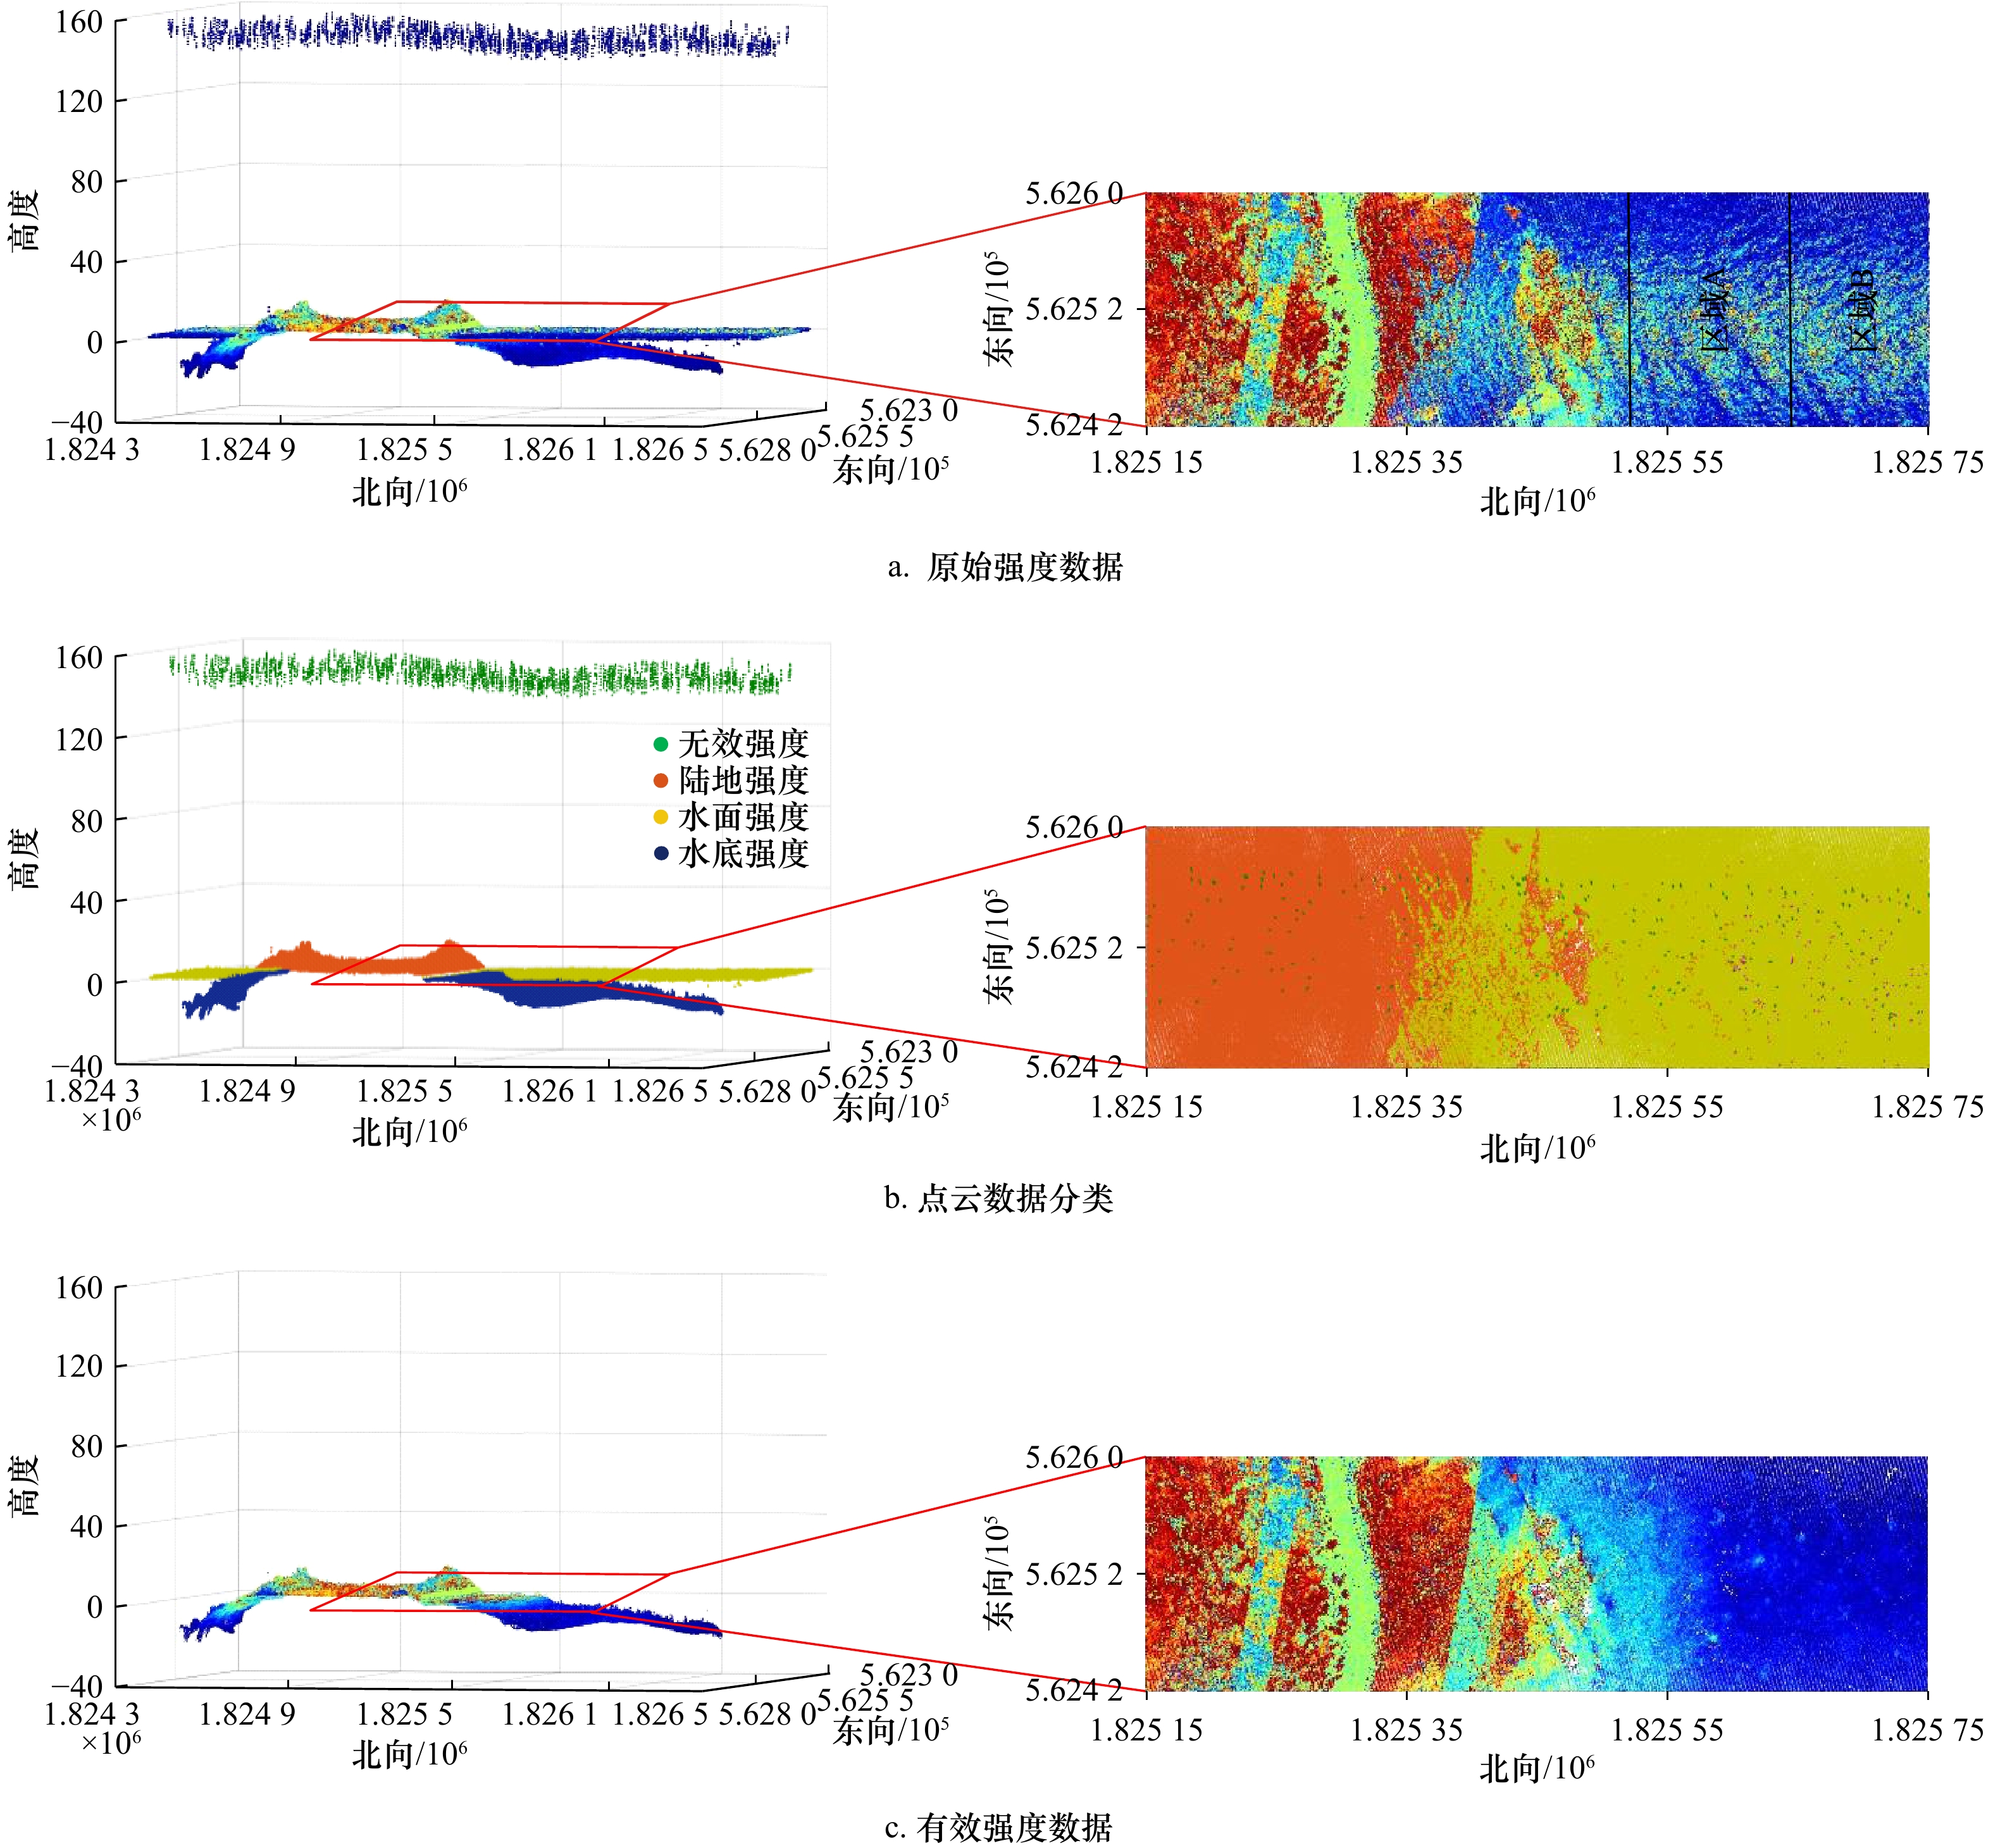
表 1 区域A/B强度数据处理前后参数统计
Tab. 1 Parameter statistics of regional A/B intensity data before and after processing
区域A 区域B 原始强度 数据量 7 812 4 468 D 3 818 1 277 SD 527.07 339.31 强度数据预处理后 数据量 8 656 4 643 D 3 815 912 SD 510.44 137.18  下载: 导出CSV
表 2 强度改正前后对比分析
Tab. 2 Comparative analysis before and after intensity correction
区域1 区域2 改正前 MD 922.55 1 106.48 MAPE 0.40 0.38 RMSE 981.37 1 238.85 改正后 MD 21.51 32.05 MAPE 0.12 0.13 RMSE 380.69 452.87
下载: 导出CSV
-
[1] Su Dianpeng, Yang Fanlin, Ma Yue, et al. Classification of coral reefs in the South China Sea by combining airborne LiDAR bathymetry bottom waveforms and bathymetric features[J]. IEEE Transactions on Geoscience and Remote Sensing, 2019, 57(2): 815−828. doi: 10.1109/TGRS.2018.2860931 [2] Narayanan R, Kim H B, Sohn G. Classification of SHOALS 3000 bathymetric LiDAR signals using decision tree and ensemble techniques[C]//2009 IEEE Toronto International Conference Science and Technology for Humanity (TIC-STH). Toronto, ON, Canada: IEEE, 2009. [3] 刘焱雄, 郭锴, 何秀凤, 等. 机载激光测深技术及其研究进展[J]. 武汉大学学报(信息科学版), 2017, 42(9): 1185−1194.Liu Yanxiong, Guo Kai, He Xiufeng, et al. Research progress of airborne laser bathymetry technology[J]. Geomatics and Information Science of Wuhan University, 2017, 42(9): 1185−1194. [4] Ji Xue, Yang Bisheng, Tang Qiuhua, et al. A coarse-to-fine strip mosaicing model for airborne bathymetric LiDAR data[J]. IEEE Transactions on Geoscience and Remote Sensing, 2021, 59(10): 8129−8142. doi: 10.1109/TGRS.2021.3050789 [5] Ji Xue, Yang Bisheng, Wang Yuan, et al. Full-waveform classification and segmentation-based signal detection of single-wavelength bathymetric LiDAR[J]. IEEE Transactions on Geoscience and Remote Sensing, 2022, 60: 4208714. [6] Abdallah H, Baghdadi N, Bailly J S, et al. Wa-LiD: a new LiDAR simulator for waters[J]. IEEE Geoscience and Remote Sensing Letters, 2012, 9(4): 744−748. doi: 10.1109/LGRS.2011.2180506 [7] Eren F, Pe’eri S, Rzhanov Y, et al. Bottom characterization by using airborne lidar bathymetry (ALB) waveform features obtained from bottom return residual analysis[J]. Remote Sensing of Environment, 2018, 206: 260−274. doi: 10.1016/j.rse.2017.12.035 [8] Zavalas R, Ierodiaconou D, Ryan D, et al. Habitat classification of temperate marine macroalgal communities using bathymetric LiDAR[J]. Remote Sensing, 2014, 6(3): 2154−2175. doi: 10.3390/rs6032154 [9] Long B F, Aucoin F, Montreuil S, et al. Airborne lidar bathymetry applied to coastal hydrodynamic processes[C]. Coastal Engineering Proceedings. 2011, 1(32): 1−12. [10] Ji Xue, Yang Bisheng, Tang Qiuhua, et al. Feature fusion-based registration of satellite images to airborne LiDAR bathymetry in island area[J]. International Journal of Applied Earth Observation and Geoinformation, 2022, 109: 102778. doi: 10.1016/j.jag.2022.102778 [11] Höfle B, Pfeifer N. Correction of laser scanning intensity data: Data and model-driven approaches[J]. ISPRS Journal of Photogrammetry and Remote Sensing, 2007, 62(6): 415−433. doi: 10.1016/j.isprsjprs.2007.05.008 [12] Oren M, Nayar S K. Generalization of the Lambertian model and implications for machine vision[J]. International Journal of Computer Vision, 1995, 14(3): 227−251. doi: 10.1007/BF01679684 [13] Yoon J S, Shin J I, Lee K S. Land cover characteristics of airborne LiDAR intensity data: a case study[J]. IEEE Geoscience and Remote Sensing Letters, 2008, 5(4): 801−805. doi: 10.1109/LGRS.2008.2000754 [14] Richter K, Maas H G. Radiometric enhancement of full-waveform airborne laser scanner data for volumetric representation in environmental applications[J]. ISPRS Journal of Photogrammetry and Remote Sensing, 2022, 183: 510−524. doi: 10.1016/j.isprsjprs.2021.10.021 [15] Kashani A G, Olsen M J, Parrish C E, et al. A review of LIDAR radiometric processing: from Ad Hoc intensity correction to rigorous radiometric calibration[J]. Sensors, 2015, 15(11): 28099−28128. doi: 10.3390/s151128099 [16] Lin Y C. Normalization of echo features derived from full-waveform airborne laser scanning data[J]. Remote Sensing, 2015, 7(3): 2731−2751. doi: 10.3390/rs70302731 [17] Peeri S, Gardner J V, Ward L G, et al. The seafloor: a key factor in Lidar bottom detection[J]. IEEE Transactions on Geoscience and Remote Sensing, 2011, 49(3): 1150−1157. doi: 10.1109/TGRS.2010.2070875 [18] Wang C K, Philpot W D. Using airborne bathymetric Lidar to detect bottom type variation in shallow waters[J]. Remote Sensing of Environment, 2007, 106(1): 123−135. doi: 10.1016/j.rse.2006.08.003 [19] Philips D M, Abbot R H, Penny M F. Remote sensing of sea water turbidity with an airborne laser system[J]. Journal of Physics D: Applied Physics, 1984, 17(8): 1749. doi: 10.1088/0022-3727/17/8/028 [20] Vain A, Yu Xiaowei, Kaasalainen S, et al. Correcting airborne laser scanning intensity data for automatic gain control effect[J]. IEEE Geoscience and Remote Sensing Letters, 2010, 7(3): 511−514. doi: 10.1109/LGRS.2010.2040578 [21] Korpela I, Ørka H O, Hyyppä J, et al. Range and AGC normalization in airborne discrete-return LiDAR intensity data for forest canopies[J]. ISPRS Journal of Photogrammetry and Remote Sensing, 2010, 65(4): 369−379. doi: 10.1016/j.isprsjprs.2010.04.003 [22] Korpela I S. Mapping of understory lichens with airborne discrete-return LiDAR data[J]. Remote Sensing of Environment, 2008, 112(10): 3891−3897. doi: 10.1016/j.rse.2008.06.007 [23] 刘健, 陈亮, 王驹, 等. 二维K-S检验法在岩体统计均质区划分中的应用[J]. 岩土工程学报, 2019, 41(12): 2374−2380.Liu Jian, Chen Liang, Wang Ju, et al. Application of 2D K-S tests to evaluating statistical homogeneity of rock mass[J]. Chinese Journal of Geotechnical Engineering, 2019, 41(12): 2374−2380. -

计量
- 文章访问数: 321
- HTML全文浏览量: 137
- PDF下载量: 13
- 被引次数: 0
