

The distribution of eastward propagating pathways of the Tropical Intraseasonal Oscillation and its mechanism in the Maritime Continent
-
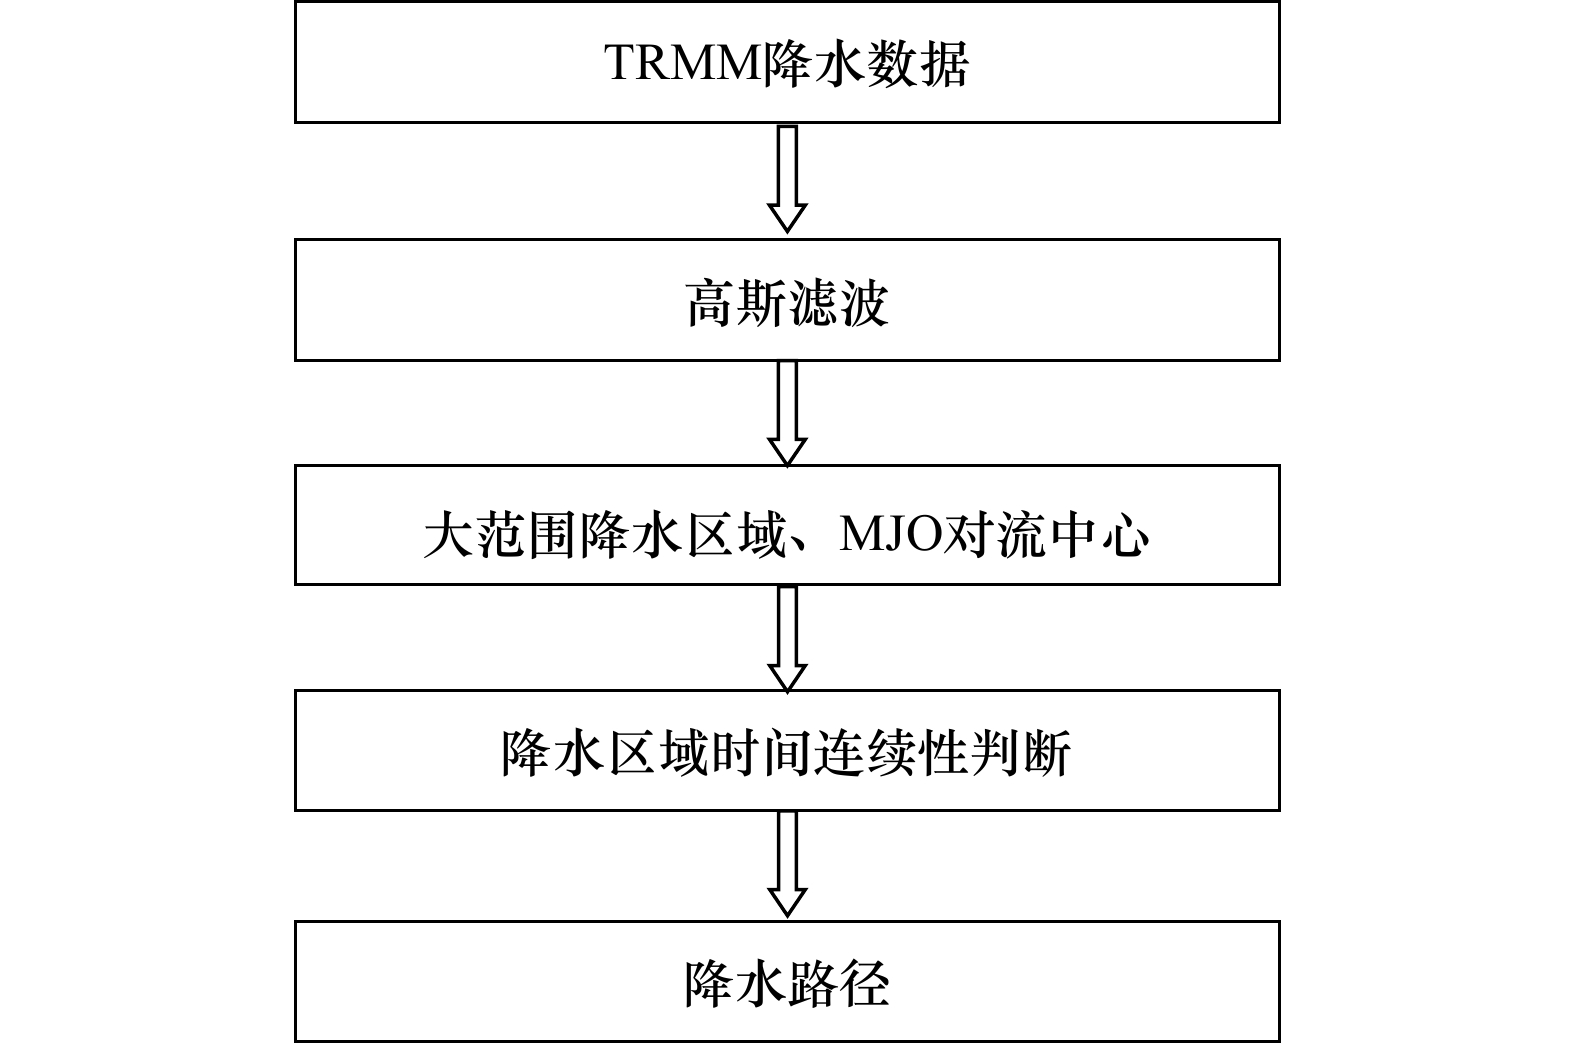
摘要: 本文利用降水数据,从拉格朗日观点追踪了热带季节内振荡(MJO)路径,对其在海洋性大陆(100°~120°E)区域的分布及机制进行了探讨。以24 h内超过12 mm的降水范围为MJO的对流区域,以该区域的“重心”为MJO的对流中心,追踪MJO的路径,并形成其路径集。由于向东传播的MJO主要发生在北半球冬季,因此我们聚焦于MJO在北半球冬季的路径分布特征。结果表明,以降水量来衡量,MJO事件主要从赤道附近(5°S~5°N)通过印尼海区域。这和前人以对外长波辐射(OLR)为指标得到的MJO在印尼海区域向南偏折有明显的区别。此外,与MJO伴随的降水主要从赤道附近通过的结论不依赖于厄尔尼诺–南方涛动(ENSO)及印度洋偶极子(IOD)等背景气候态。机制分析表明,与MJO伴随的降水通过印尼海区域的路径主要受强的海表热通量异常的调制,而与暖海表温度(SST)异常的区域并不一致,这也造成了从降水和OLR两个不同角度看到的MJO通过印尼海区域的路径不一致。Abstract: Using Tropical Rainfall Measurement Mission 3B42 rainfall data, this study tracks pathways of Tropical Intraseasonal Oscillations (MJO) from a Lagrange perspective, analyses their distribution in the Maritime Continent (100°−120°E) and further discusses its mechanism. Identifying a raining area with above 12 mm in 24 hours precipitation as a MJO convective region and using its centroid as MJO convective center, pathways of MJO are tracked and a set of pathways is given. Because eastward propagating MJO events happen mostly in boreal winter, this study focuses on the distribution of pathways of MJO events in boreal winter. The results show that if measured by precipitation MJO moves through the Maritime Continent mostly near the equator (5°S−5°N), which is different from past research results that MJO detours to the south of the Maritime Continent measured by using outgoing long wave radiation (OLR) as a index. Besides, the conclusion that the precipitation associated with MJO moves through the Maritime Continent mostly near the equator is independent of background climate patterns like ENSO or IOD. The analysis of the mechanism shows that pathways of the precipitation associated with MJO through the Maritime Continent are mostly regulated by strong latent heat flux anomalies and are inconsistent with regions with warm sea surface temperature anomalies, which leads to different pathways of MJO moving through the Maritime Continent from different perspectives of precipitation and OLR.
-
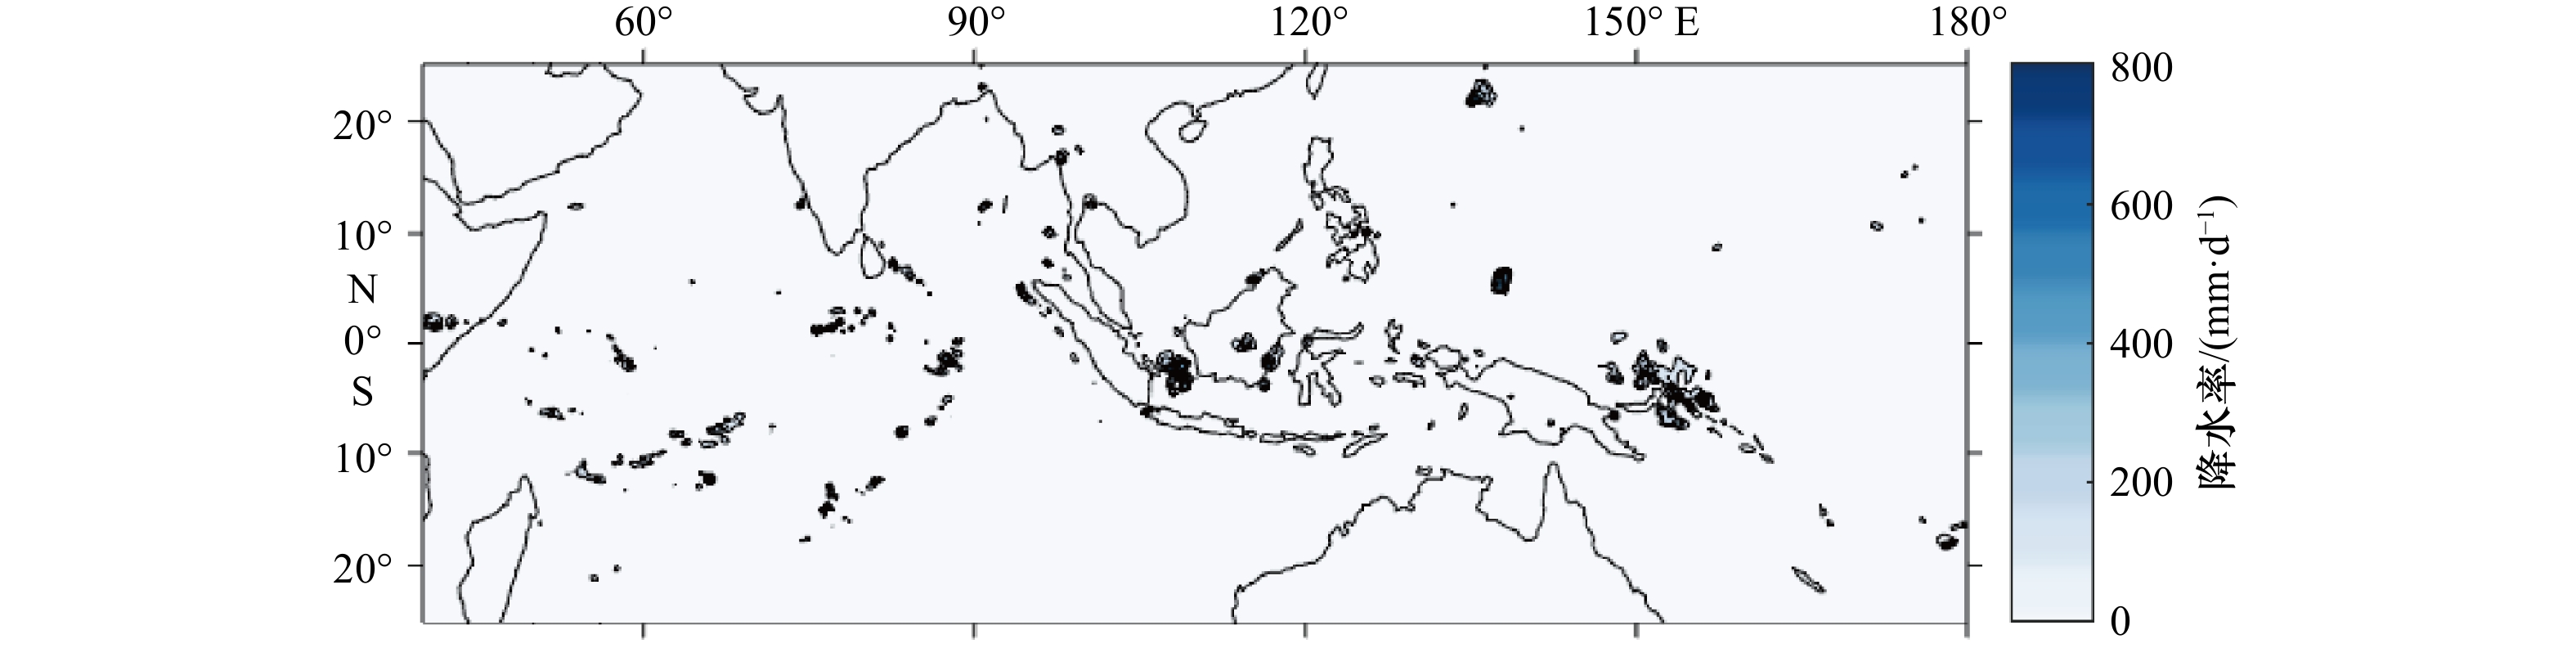
图 2 2003年4月30日21时在25°S~25°N ,40°E~180°的降水率
Fig. 2 The rainfall rate of 21:00 April 30, 2003 in the region 25°S–25°N, 40°E–180°
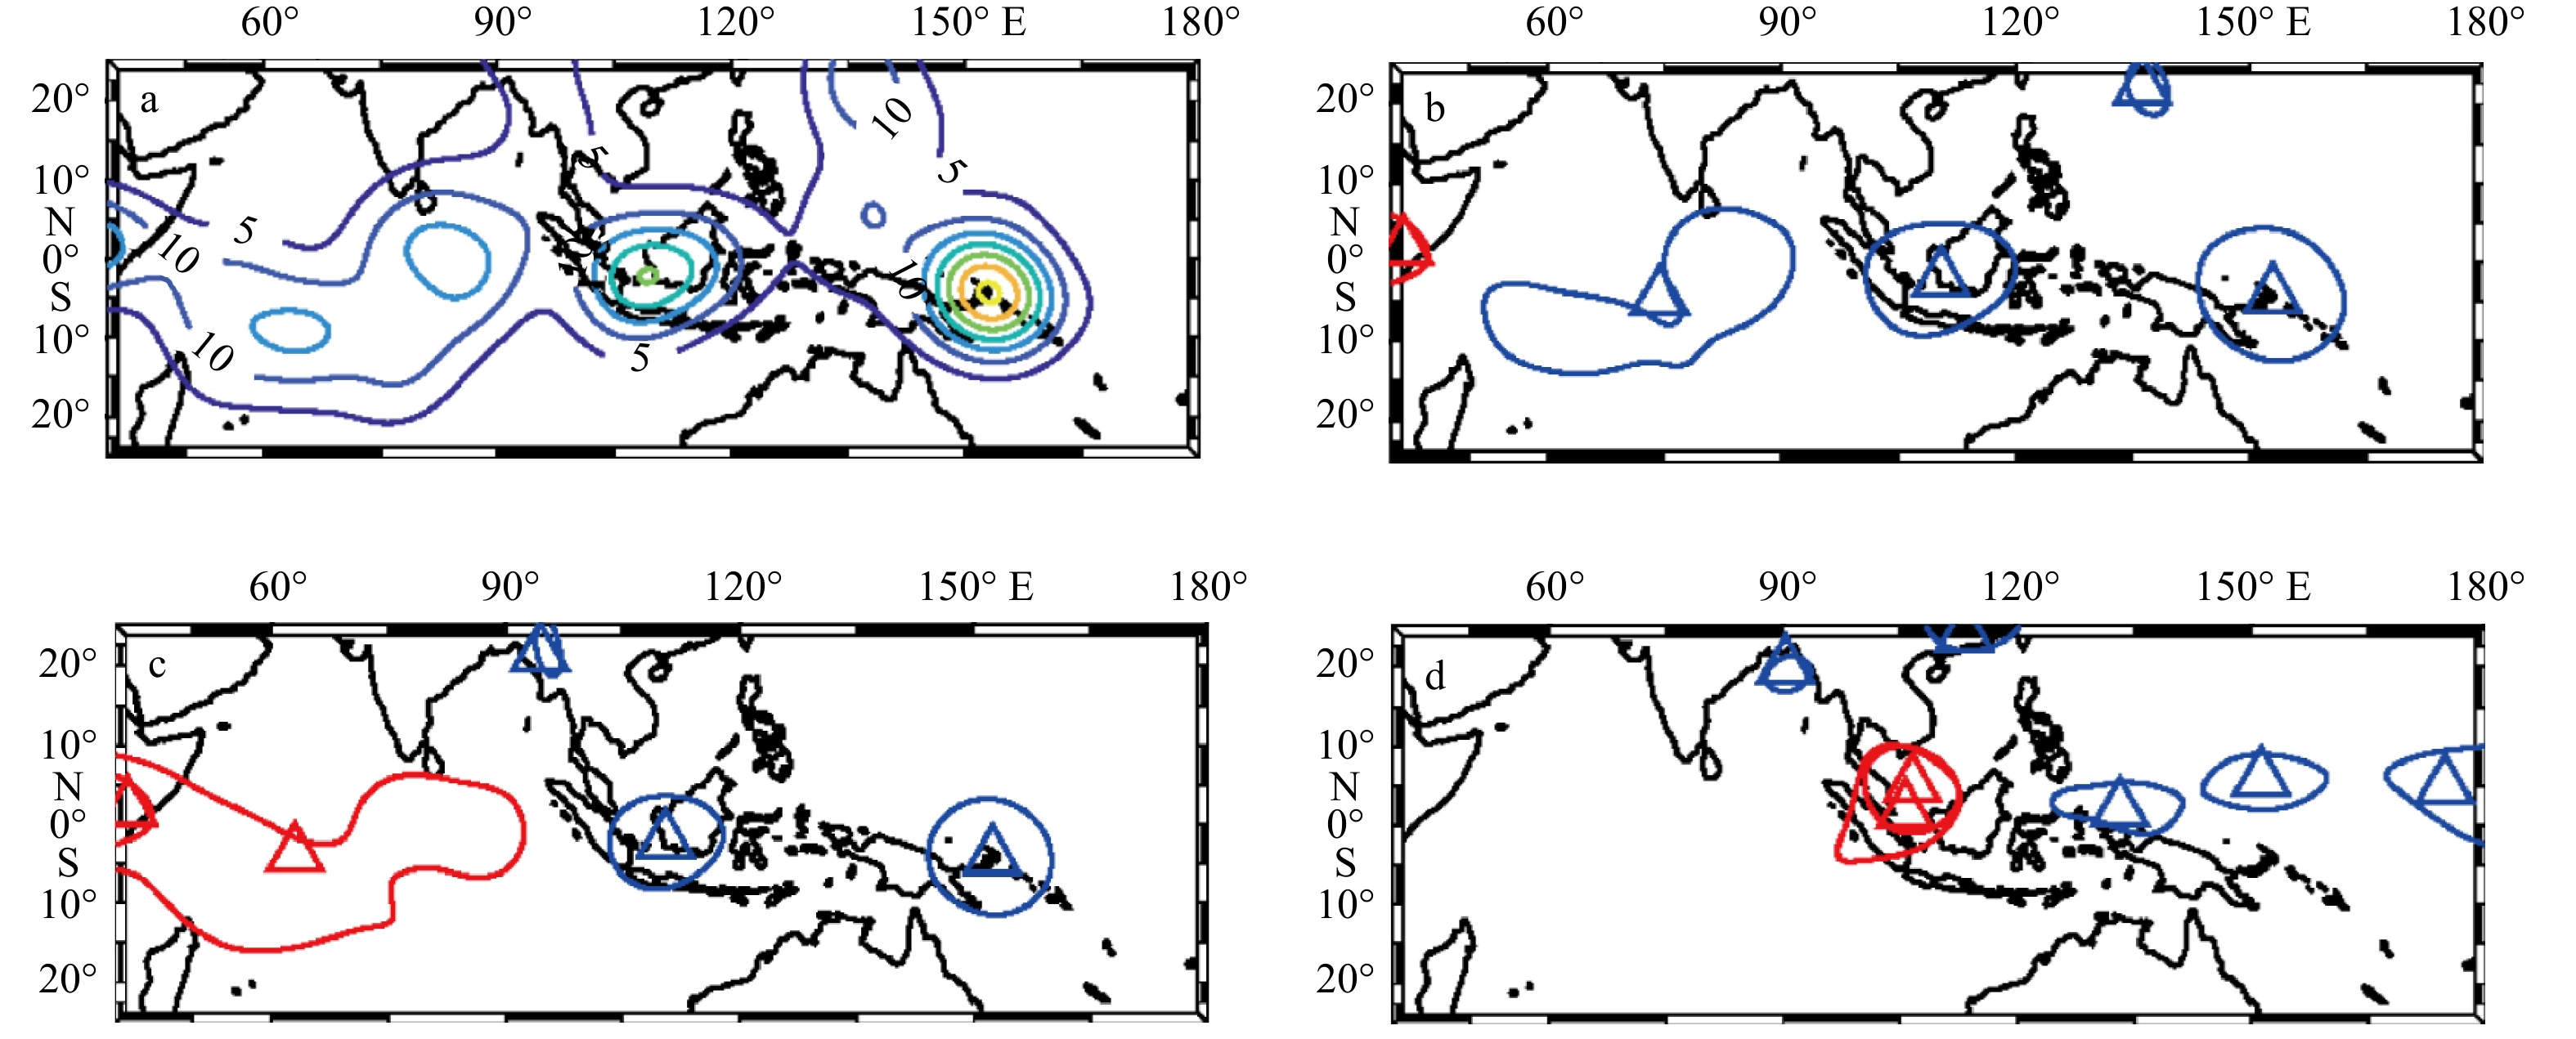
图 3 降水追踪方法的一个示例
a. 2003年4月30日21时空间平滑后的大尺度对流包络(单位:mm/d);b. 2003年4月30日21时的大尺度降水区域和对流中心,红色包络和三角代表追踪起始时刻的降水区域和对流中心;c. 2003年4月30日21时和2004年5月1日3时的大尺度降水区域和对流中心,红色包络和三角代表两相邻时刻重合面积超过它们其中之一的一半或者重合区域经纬度范围超过5°的降水区域和相应对流中心;d. 2003年5月14日0时和2003年5月14日6时的大尺度降水区域和对流中心,红色三角和等高线代表3 d以内的两个时刻空间上经纬度相距10°以内的对流中心和相应降水区域。蓝色包络和三角均代表没有被选择的降水区域和对流中心
Fig. 3 An example of the precipitation tracking method
a. The large-scale rainfall envelope (unit: mm/d) after space smoothing of 21:00 April 30, 2003; b. large-scale precipitation regions and convection centroids of 21:00 April 30, 2003, the red envelope and triangle marker indicate the chosen initial precipitation regions and convection centroid respectively; c. large-scale precipitation regions and convection centroids of 21:00 April 30, 2003 and 3:00 May 1, 2004, the red envelope and triangle marker indicate their precipitation region which overlap by at least 50% of their area or a minimum 5° longitudinal and latitudinal range and corresponding convection centroid respectively; d. large-scale precipitation regions and convection centroids of 00:00 May 14, 2003 and 6:00 May 14, 2004, the red triangle and envelope marker indicate their convection centroid of which longitudinal and latitudinal distance are within 10° and corresponding precipitation region respectively. The blue envelope and triangle represent unselected precipitation regions and convective centers
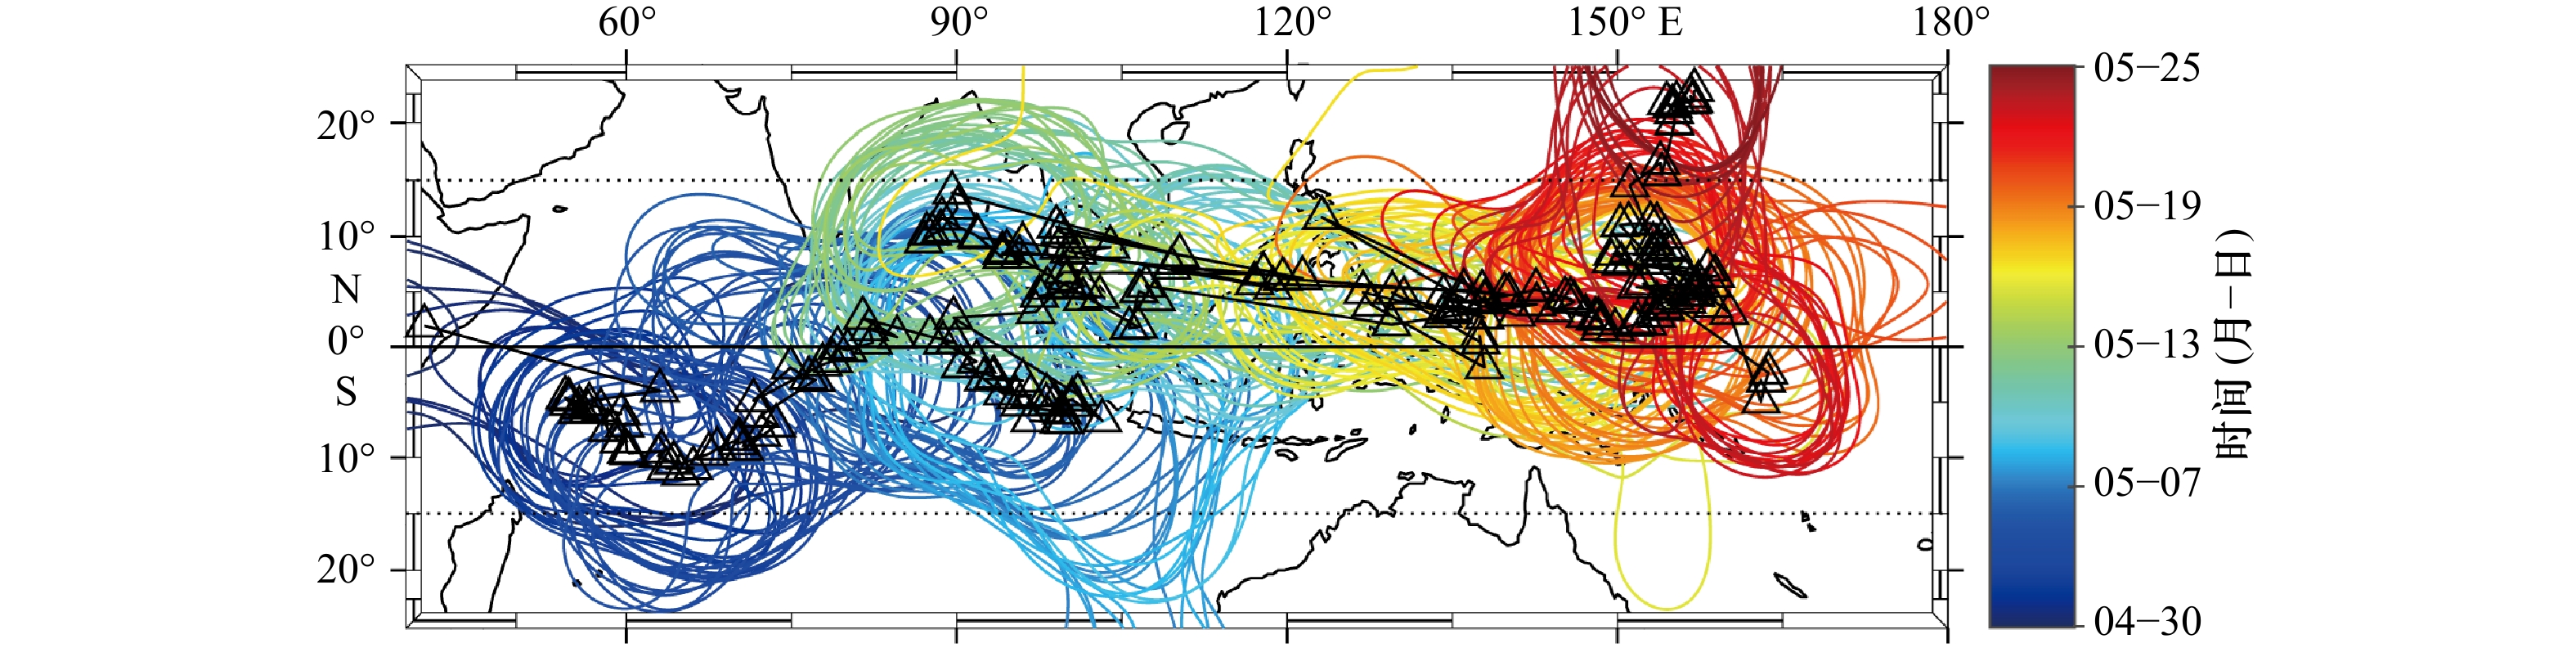
图 4 起始时间为2003年4月30日21时大范围降水追踪结果
间隔为3个小时的大范围降水区域按照每3个小时的先后顺序对应颜色条绘制成从蓝到红的颜色,对应的降水重心以黑色三角标注,黑色实线标注赤道的位置,黑色虚线标注南北纬15°的位置
Fig. 4 Large scale precipitation tracking results of which starting date is 21:00 April 30, 2003
The 3 h large scale precipitation area drawn every 3 h with dates from blue to red according to the color scale on the right and the precipitation centroids are drawn as black triangles. The horizontal dashed lines are 15°S and 15°N, and the equator is drawn as a solid black line
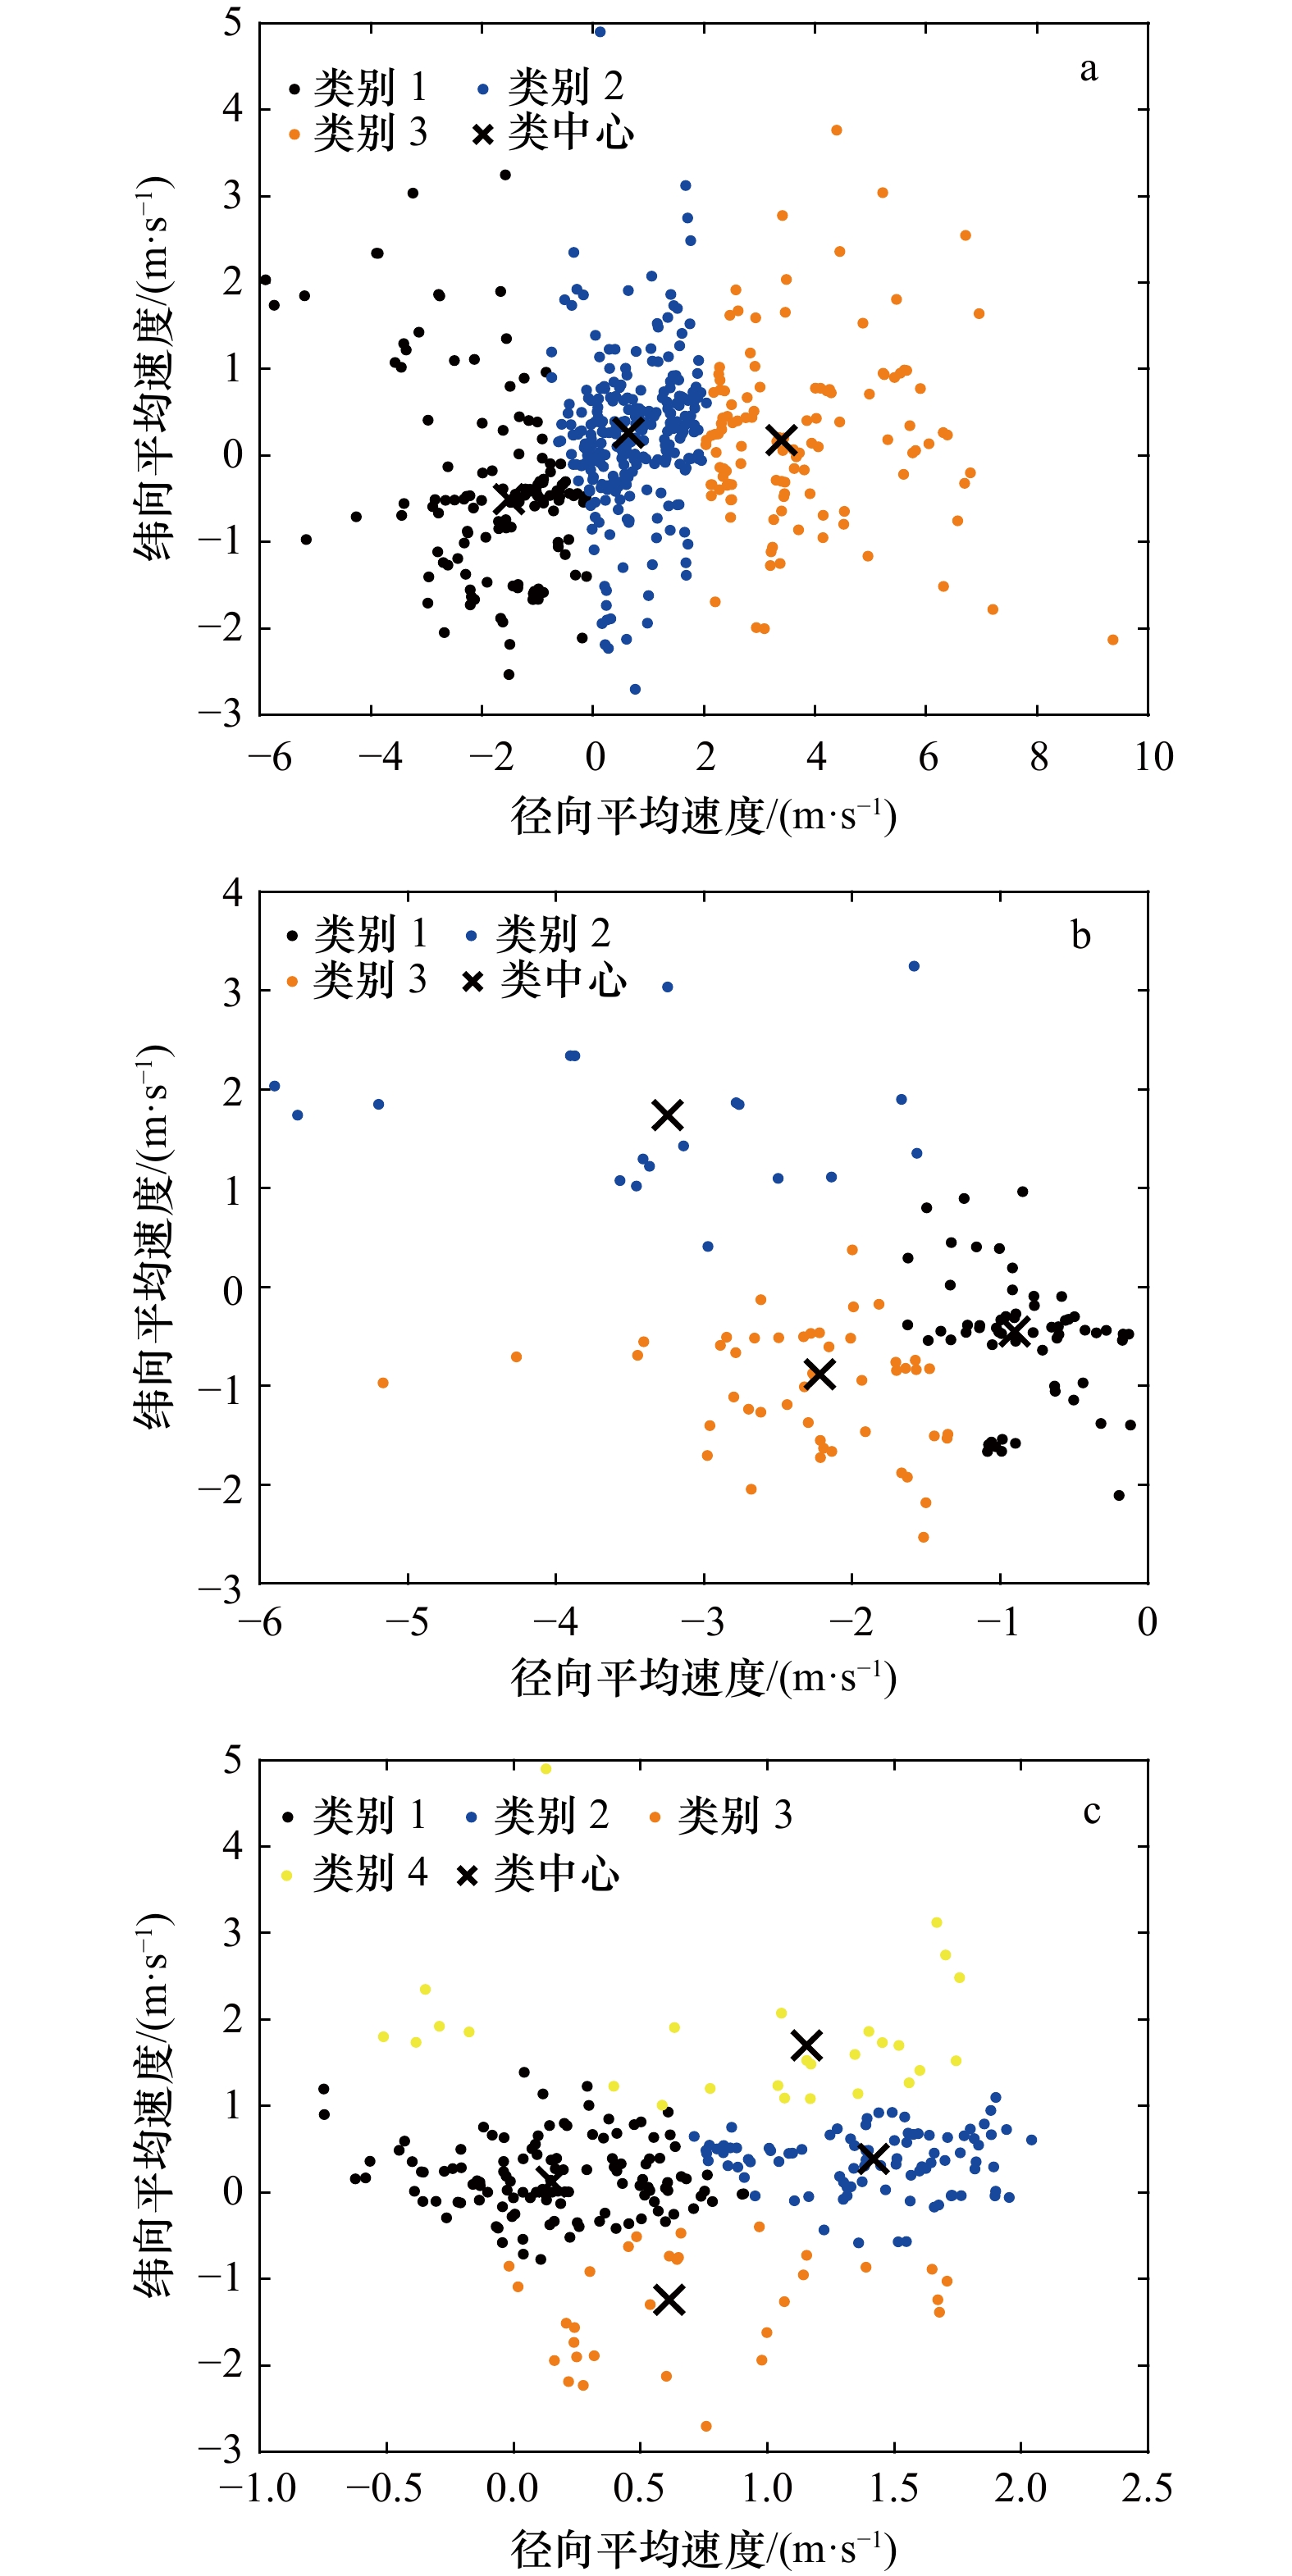
图 5 按照经向平均速度的降水事件聚类结果
a. 全部降水事件的聚类结果;b. 图a的类别1中降水事件的聚类结果;c. 图a的类别2中降水事件的聚类结果
Fig. 5 Clustering results of precipitation events according to the average meridional velocity
a. Clustering of all precipitation events; b. clustering of Cluster 1 in figure a; c. clustering of Cluster 2 in figure a
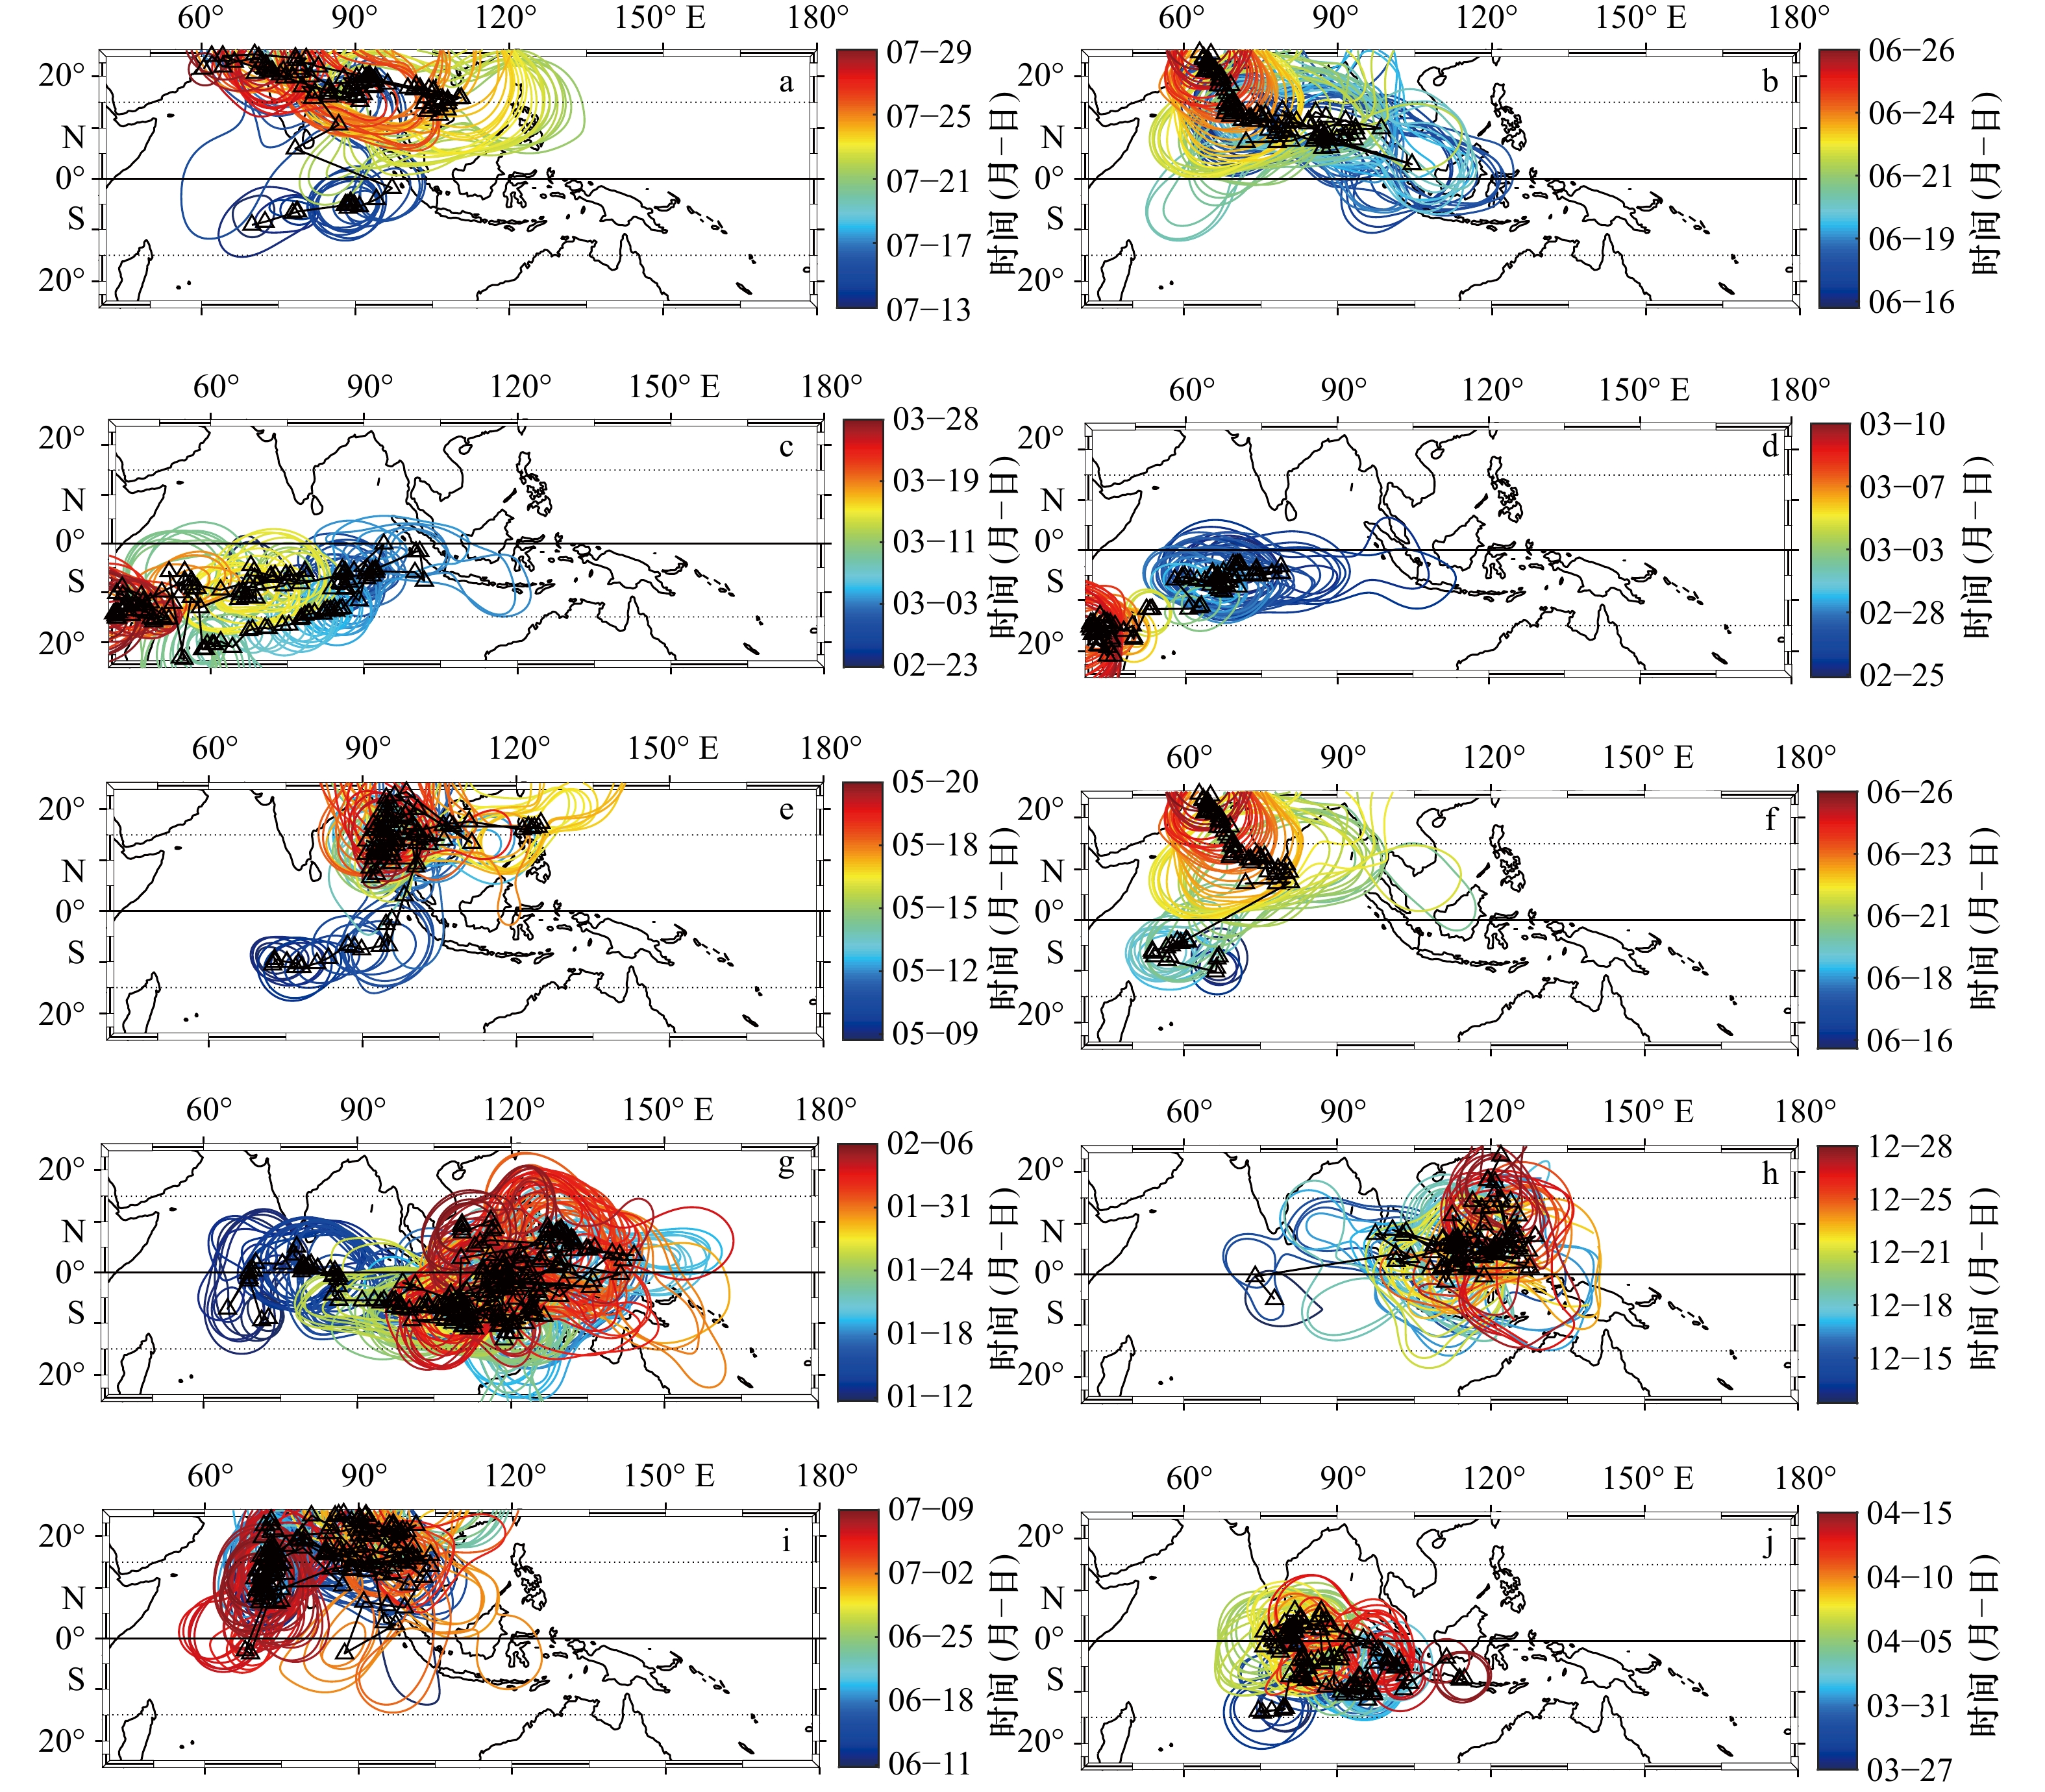
图 6 5类非MJO降水追踪结果的示例
a−j. 起始时间分别为2003年7月13日、2007年6月16日、1999年2月22日、2008年2月25日、2000年5月9日、2007年6月15日、2000年1月11日、2005年12月12日、1999年6月11日、2007年3月27日的大范围降水追踪结果,其中a和b,c和d,e和f,g和h,i和j分别对应类型I、II、III、IV、V 的非MJO降水追踪结果。间隔为3 h的大范围降水区域按照每3 h的先后顺序对应每张图右边的颜色条绘制成从蓝到红的颜色,对应的降水重心以黑色三角标注,黑色实线标注赤道的位置,黑色虚线标注南北纬15°的位置
Fig. 6 Examples of five clusters of non-MJO events
a−j. Show large scale precipitation tracking results of which starting date is July 13, 2003, June 16, 2007, February 22, 1999, February 25, 2008, May 9, 2000, June 15, 2007, January 11, 2000, December 12, 2005, June 11, 1999, March 27, 2007, respectively. a and b, c and d, e and f, g and h, i and j show precipitation tracking results of cluster I, II, III, IV, V non-MJO events. The 3 h large scale precipitation area drawn every 3 h with dates from blue to red according to the color scale on the right and the precipitation centroids are drawn as black triangles. The horizontal dashed lines are 15°S and 15°N, and the equator is drawn as a solid black line

图 7 MJO降水事件的示例
a−c. 起始时间分别为1999年5月22日、2000年11月13日、2007年3月4日的MJO降水事件。间隔为3 h的大范围降水区域按照每3 h的先后顺序对应每张图右边的颜色条绘制成从蓝到红的颜色,对应的降水重心以黑色三角标注,黑色实线标注赤道的位置,黑色虚线标注南北纬15°的位置
Fig. 7 Examples of MJO precipitation events
a−c. Show MJO precipitation events of which starting date is May 22, 1999, November 13, 2000, March 4, 2007 respectively. The 3 hourly large scale precipitation area drawn every 3 h with dates from blue to red according to the color scale on the right and the precipitation centroids are drawn as black triangles. The horizontal dashed lines are 15°S and 15°N, and the equator is drawn as a solid black line
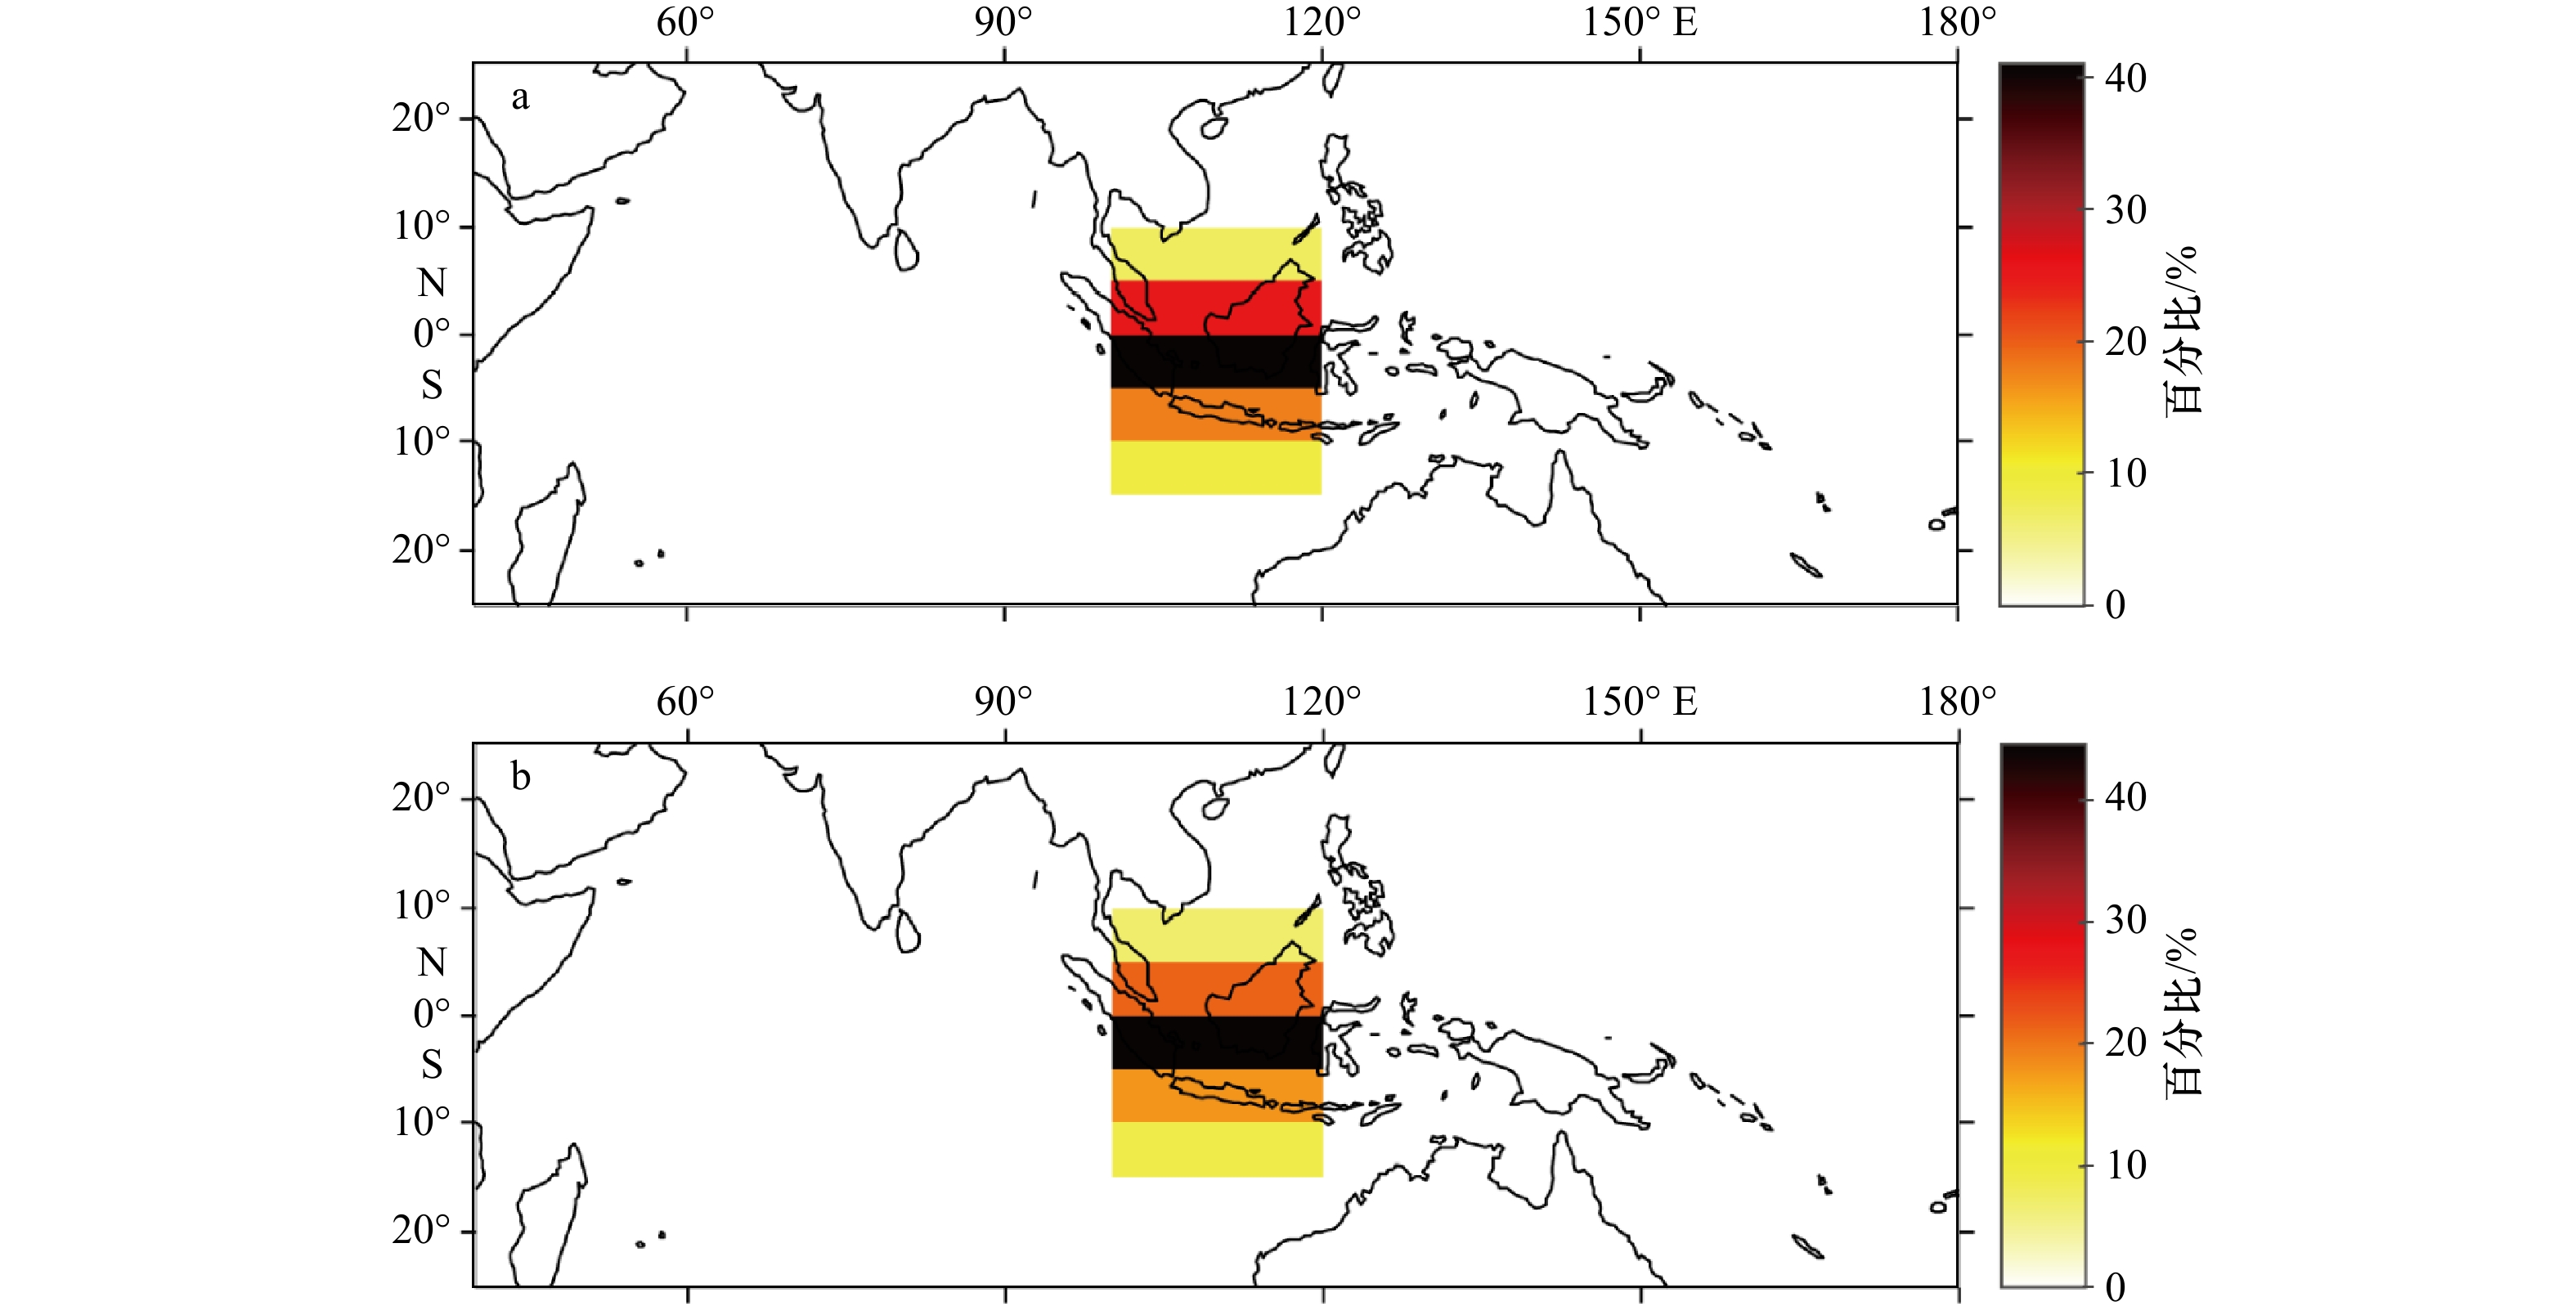
图 8 两种不同平均后MJO事件的纬度分布
a. 降水加权平均后得到的北半球冬天在海洋性大陆各个纬度带通过的MJO事件数目占总事件数目的百分比;b. 纬度平均后得到的北半球冬天在海洋性大陆各个纬度带通过的MJO事件数目占总事件数目的百分比
Fig. 8 The latitudinal distribution of MJO events after two different averaging methods
a. Percentage of MJO events which propagate through the Maritime Continent from different latitude belts in boreal winter after precipitation weighted averaging; b. percentage of MJO events which propagate through the Maritime Continent from different latitude belt in boreal winter after latitude averaging

图 9 MJO事件的路径
a. 北半球冬天可以通过海洋性大陆的56个MJO事件的路径;b−f. 降水加权平均后分别从纬度带10°~15°S、5°~10°S、0°~5°S、0°~5°N、5°~10°N通过的5、10、23、14、4个MJO事件的路径。黑色三角和黑色叉号分别代表每个MJO事件的产生和消亡位置
Fig. 9 Pathways of MJO events
a. Pathways of 56 MJO events which can pass through the Maritime Continent; b−f. pathways of 5, 10, 23, 14, 4 MJO events which pass through the Maritime Continent from 10°−15°S, 5°−10°S, 0°−5°S, 0°−5°N, 5°−10°N after precipitation weighted averaging. Black triangle markers and cross markers indicate initial points and end points of every MJO events respectively
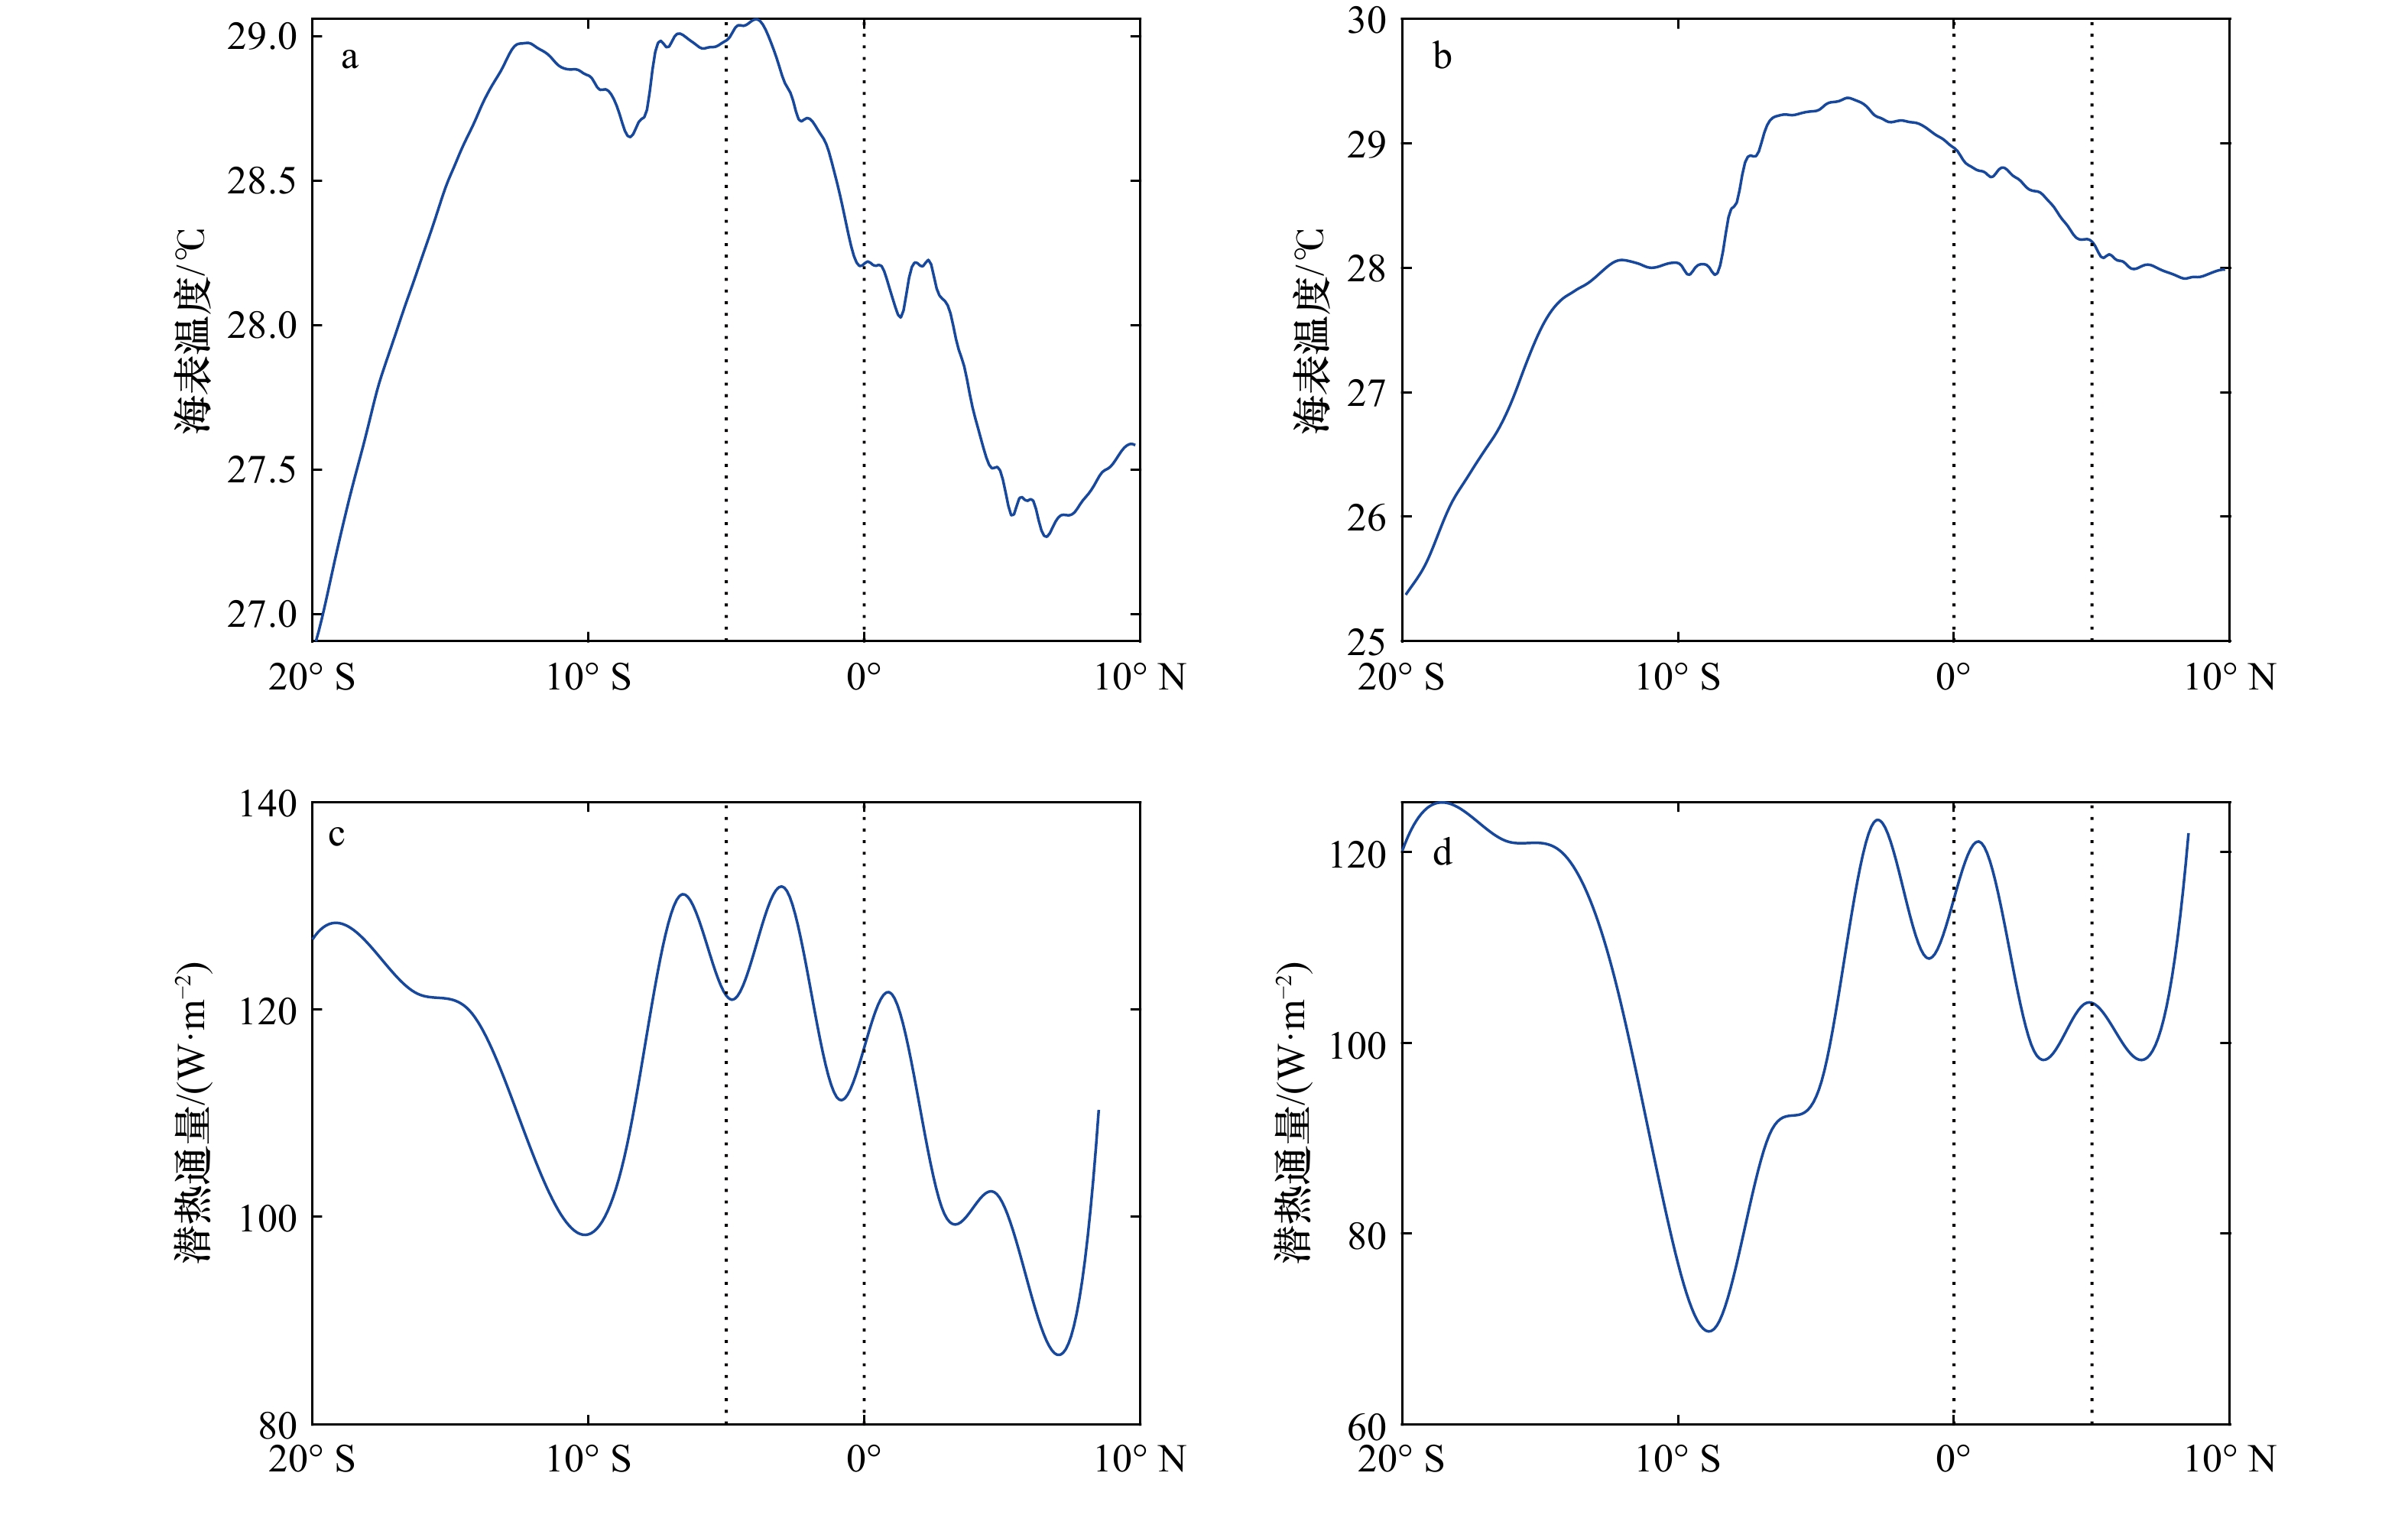
图 10 MJO事件的海表温度、潜热通量背景场
a, c. 北半球冬天在海洋性大陆从纬度带0°~5°S通过的MJO事件所处的海表温度、潜热通量背景场在经度范围100°~120°E平均后随纬度的变化。b, d. 展示了北半球冬天在海洋性大陆从纬度带0°~5°N通过的MJO事件所处的海表温度、潜热通量背景场在经度范围100°~120°E平均后随纬度的变化。黑色虚线均表示对应MJO事件的偏折纬度带
Fig. 10 The SST、LHF background field of MJO events
a, c. Show the variation of SST and LHF with latitude after longitude averaging between 100°E and 120°E of MJO events propagating through the west Maritime Continent from 0°−5°S in boreal winter; b, d. show the variation of SST and LHF with latitude after longitude averaging between 100°E and 120°E of MJO events propagating through the west Maritime Continent from 0°−5°N in boreal winter. The vertical dashed lines show the latitude belts where MJO events detour
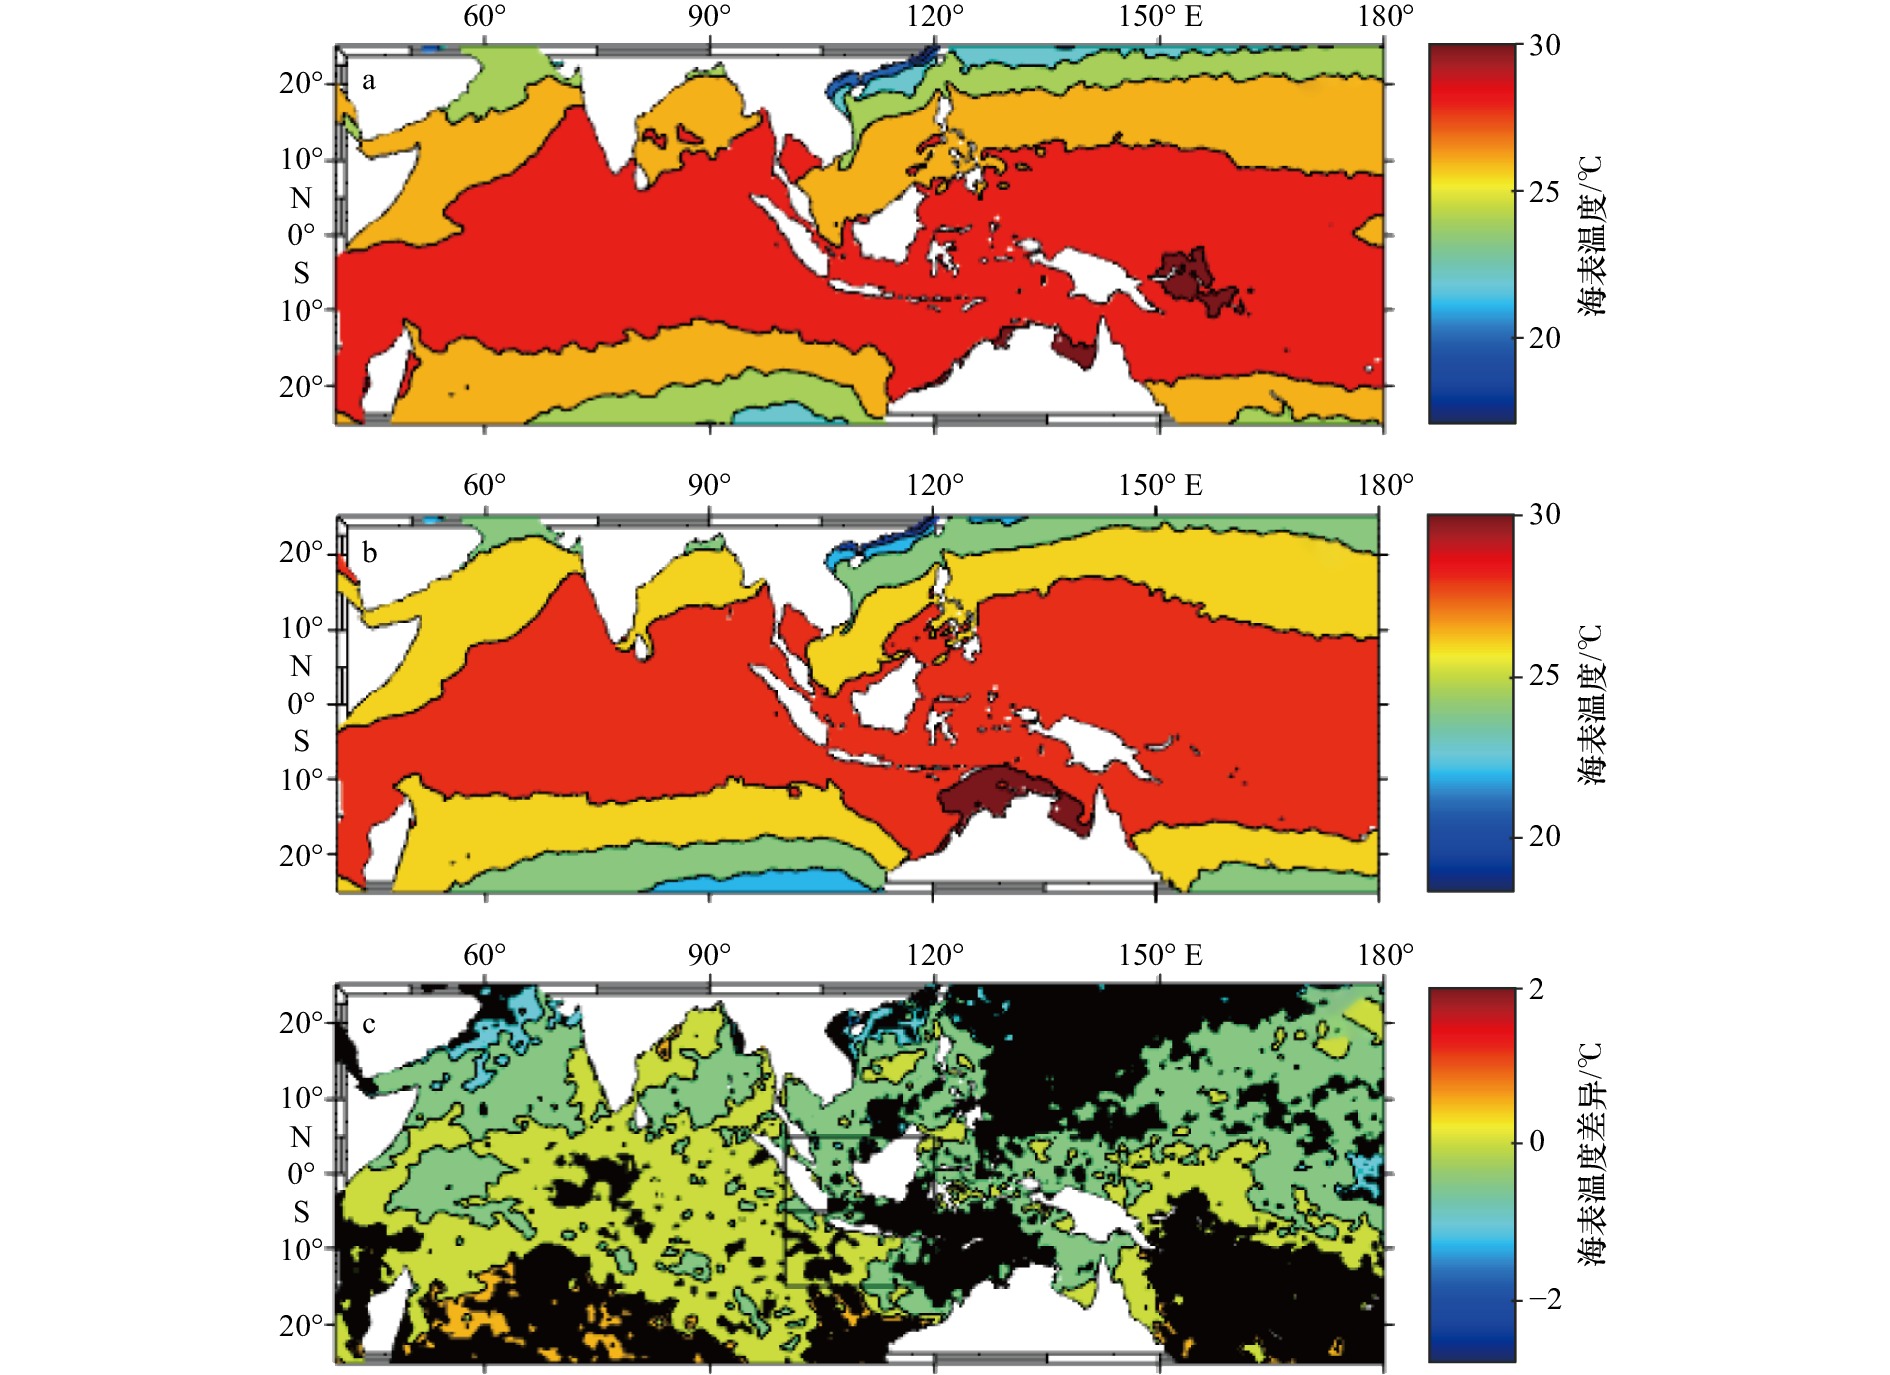
图 11 两类MJO事件的海表温度背景场及差异场
a. 北半球冬天在海洋性大陆从纬度带5°~15°S通过的MJO事件所处的海表温度背景场;b. 北半球冬天在海洋性大陆从纬度带5°S~5°N通过的MJO事件所处的海表温度背景场;c. 两类MJO事件海表温度的差异场,黑色点标记两类MJO事件的海表温度背景场在95%显著性水平下具有显著差异的区域,黑色框表示对应MJO事件的偏折纬度带
Fig. 11 The SST background fields and their difference of two clusters of MJO events
a. Composite SST for the MJO events which pass through the Maritime Continent from 5°−15°S; b. MJO events which pass through the Maritime Continent from 5°S−5°N; c. the difference between a and b. The dotted regions indicate statistically significant differences at the 95% confidence level. The two black boxes are the latitude belts where MJO events detour
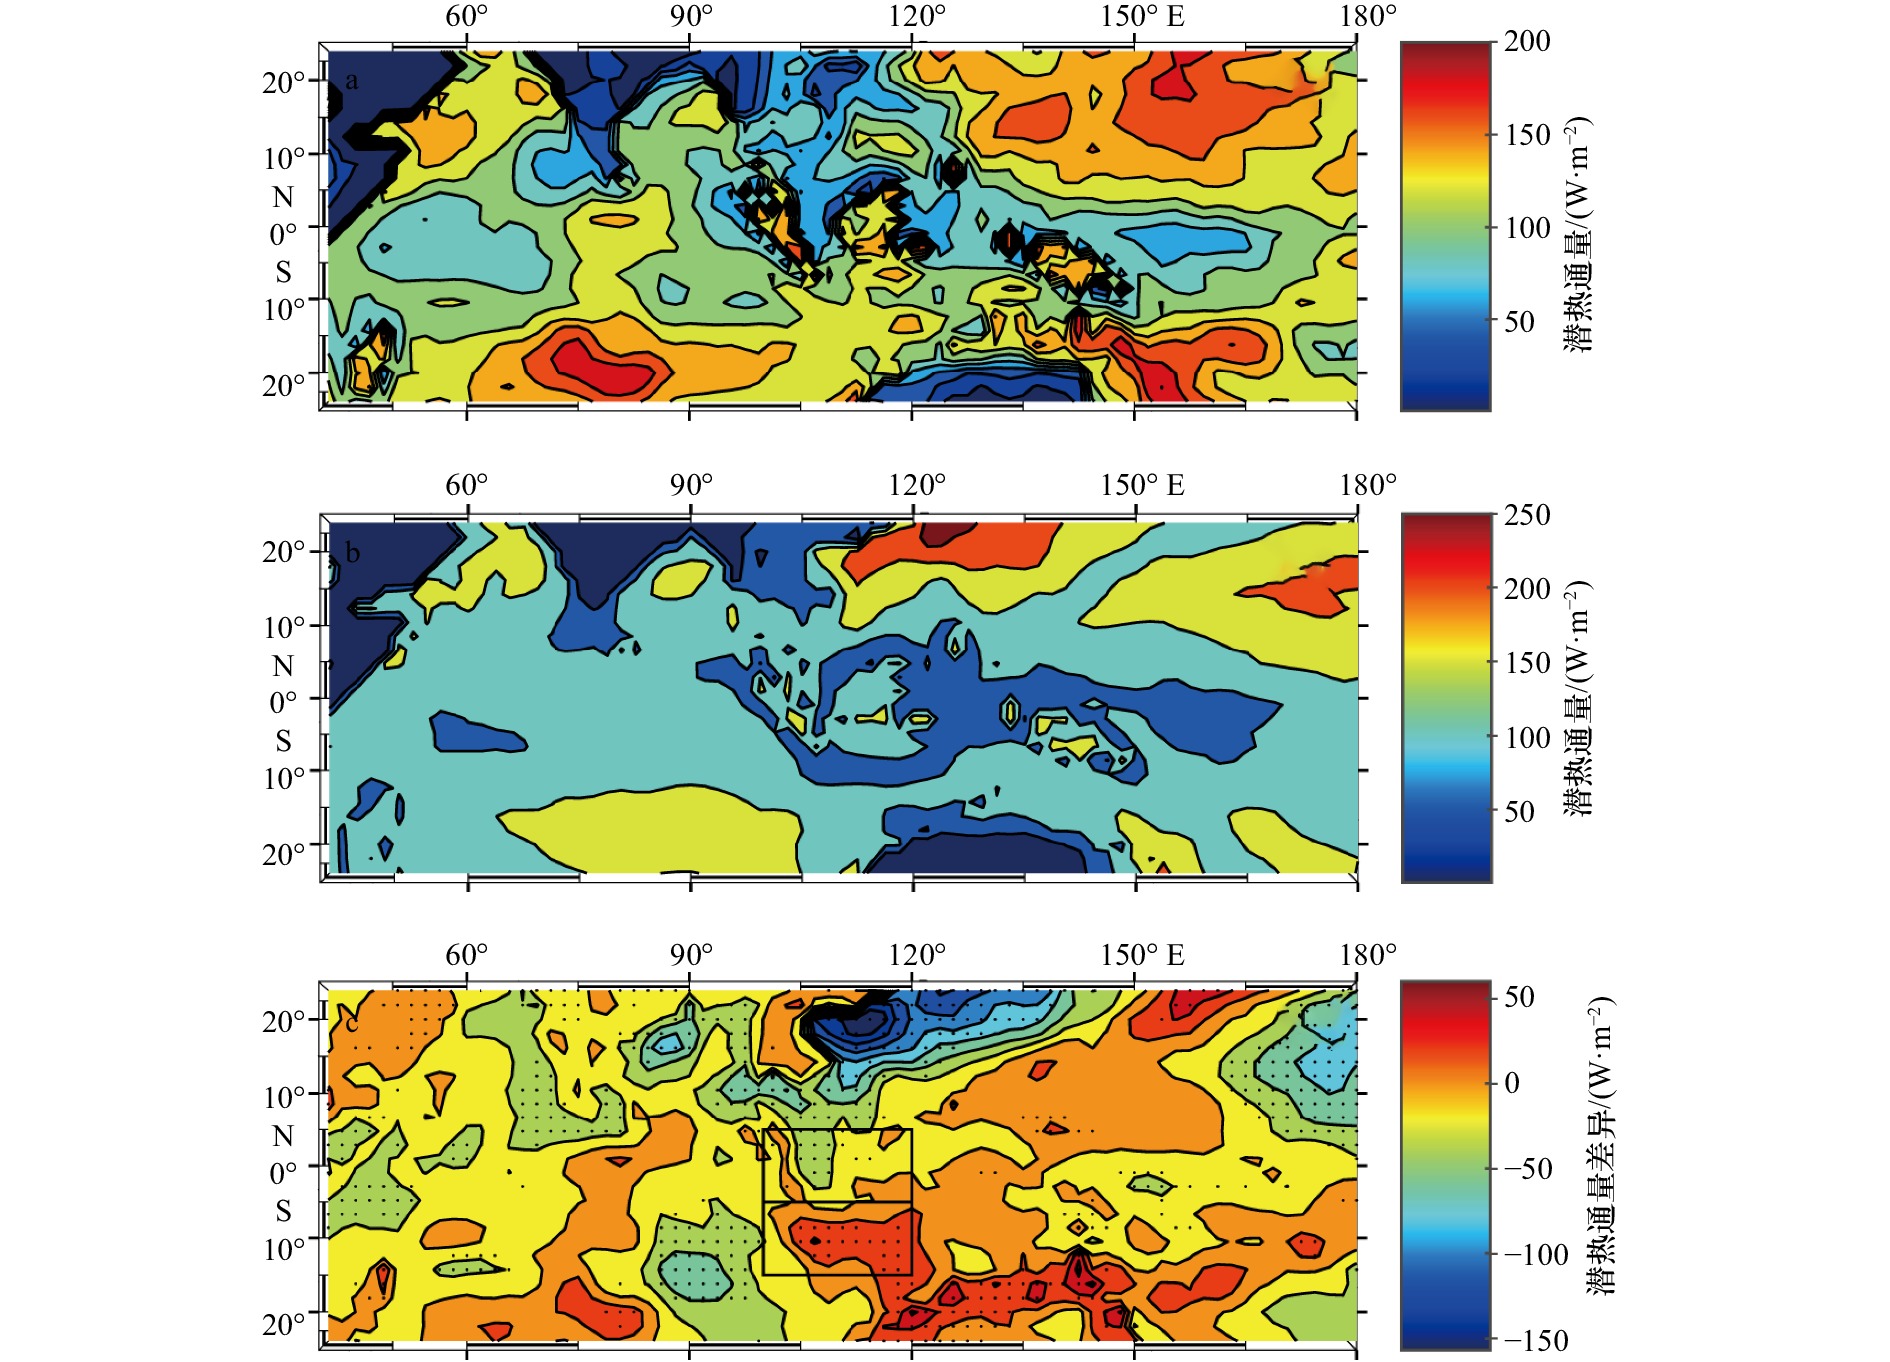
图 12 两类MJO事件的潜热通量背景场及差异场
a. 北半球冬天在海洋性大陆从纬度带5°~15°S通过的MJO事件所处的潜热通量背景场;b. 北半球冬天在海洋性大陆从纬度带5°S~5°N通过的MJO事件所处的潜热通量背景场;c. 两类MJO事件潜热通量的差异场,黑色点标记两类MJO事件的潜热通量背景场在95%显著性水平下具有显著差异的位置,黑色框表示对应MJO事件的偏折纬度带
Fig. 12 The LHF background fields and their difference of two clusters of MJO events
a. Composite LHF (W/m2) for the MJO events which pass through the Maritime Continent from 5°−15°S; b. MJO events which pass through the Maritime Continent from 5°S−5°N; c. the differences between a and b. The dotted regions indicate statistically significant differences at the 95% confidence level, the two black boxes are the latitude belts where MJO events detour
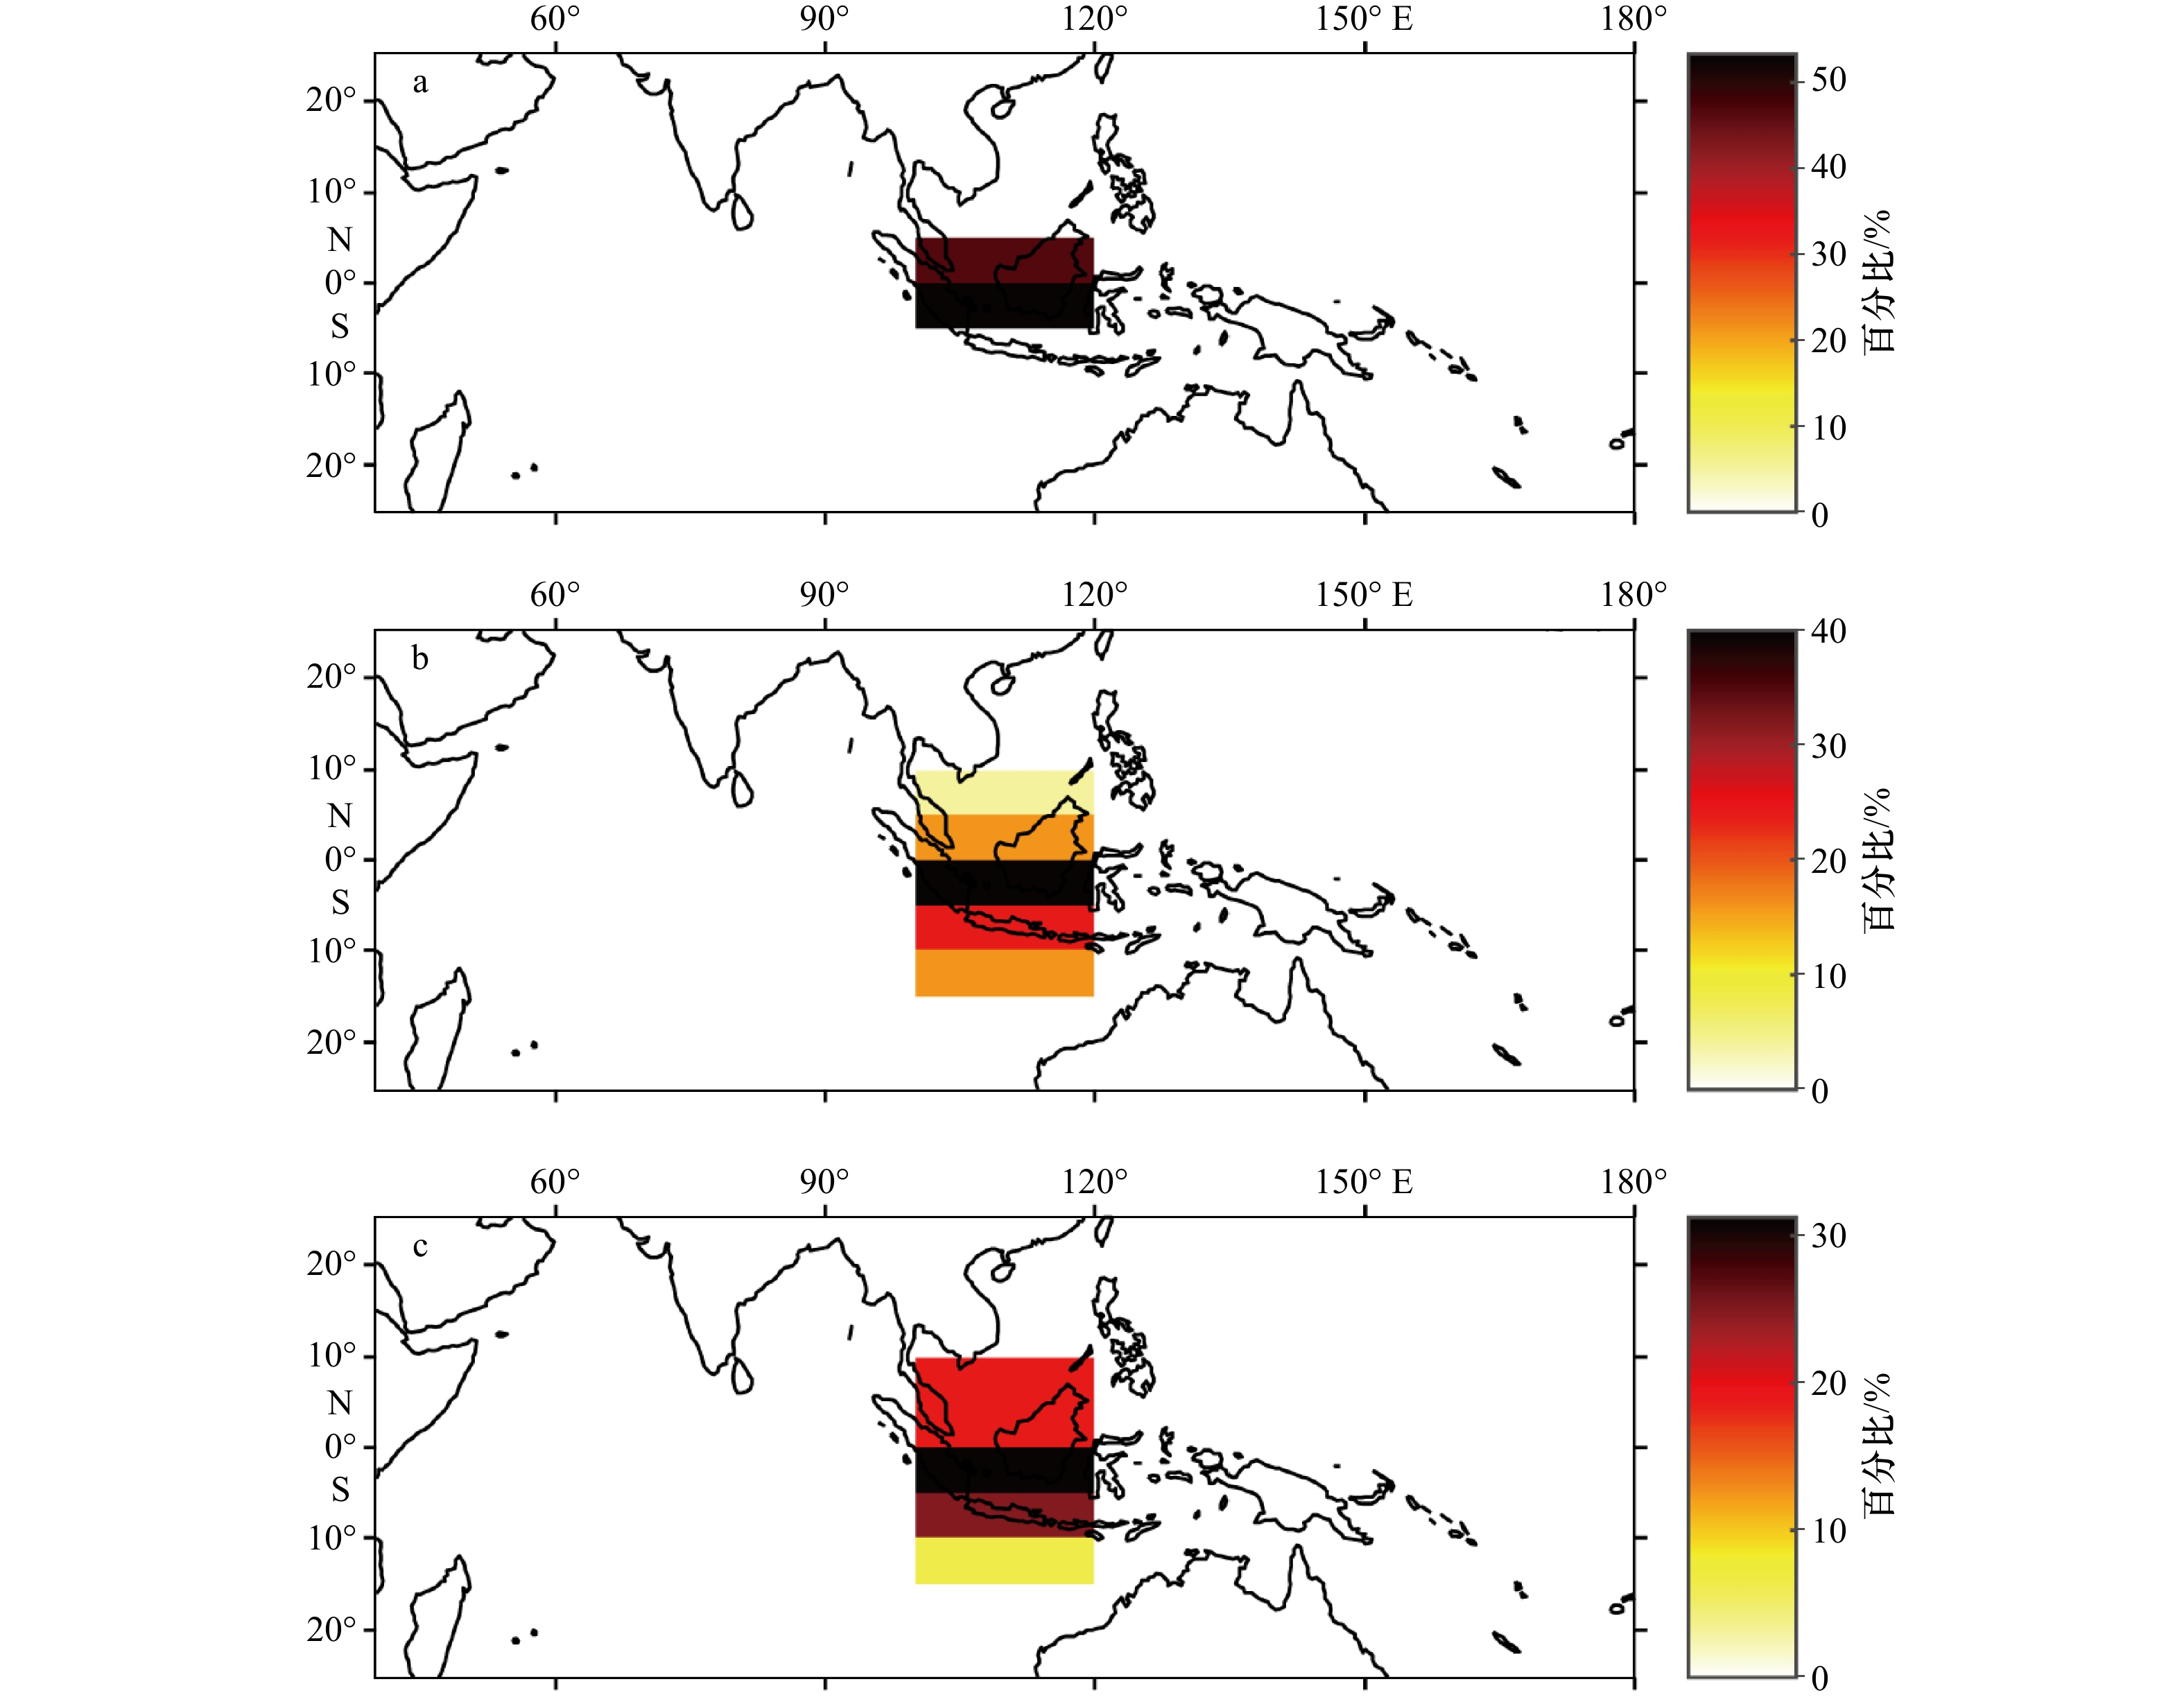
图 13 不同ENSO相位的MJO事件纬度分布
a. 北半球冬天厄尔尼诺发生时在海洋性大陆各个纬度带通过的MJO事件数占总数的百分比;b. 北半球冬天拉尼娜发生时在海洋性大陆各个纬度带通过的MJO事件数占总数的百分比;c. 北半球冬天ENSO中间态发生时在海洋性大陆各个纬度带通过的MJO事件数占总数的百分比
Fig. 13 The latitudinal distribution of MJO events during different phases of ENSO
a. Percentage of MJO events which propagate through the Maritime Continent from different latitude belts in boreal winter when El Niño happens; b. percentage of MJO events which propagate through the Maritime Continent from different latitude belt in boreal winter when La Niña happens; c. percentage of MJO events which propagate through the Maritime Continent from different latitude belt in boreal winter when ENSO neutral condition happens
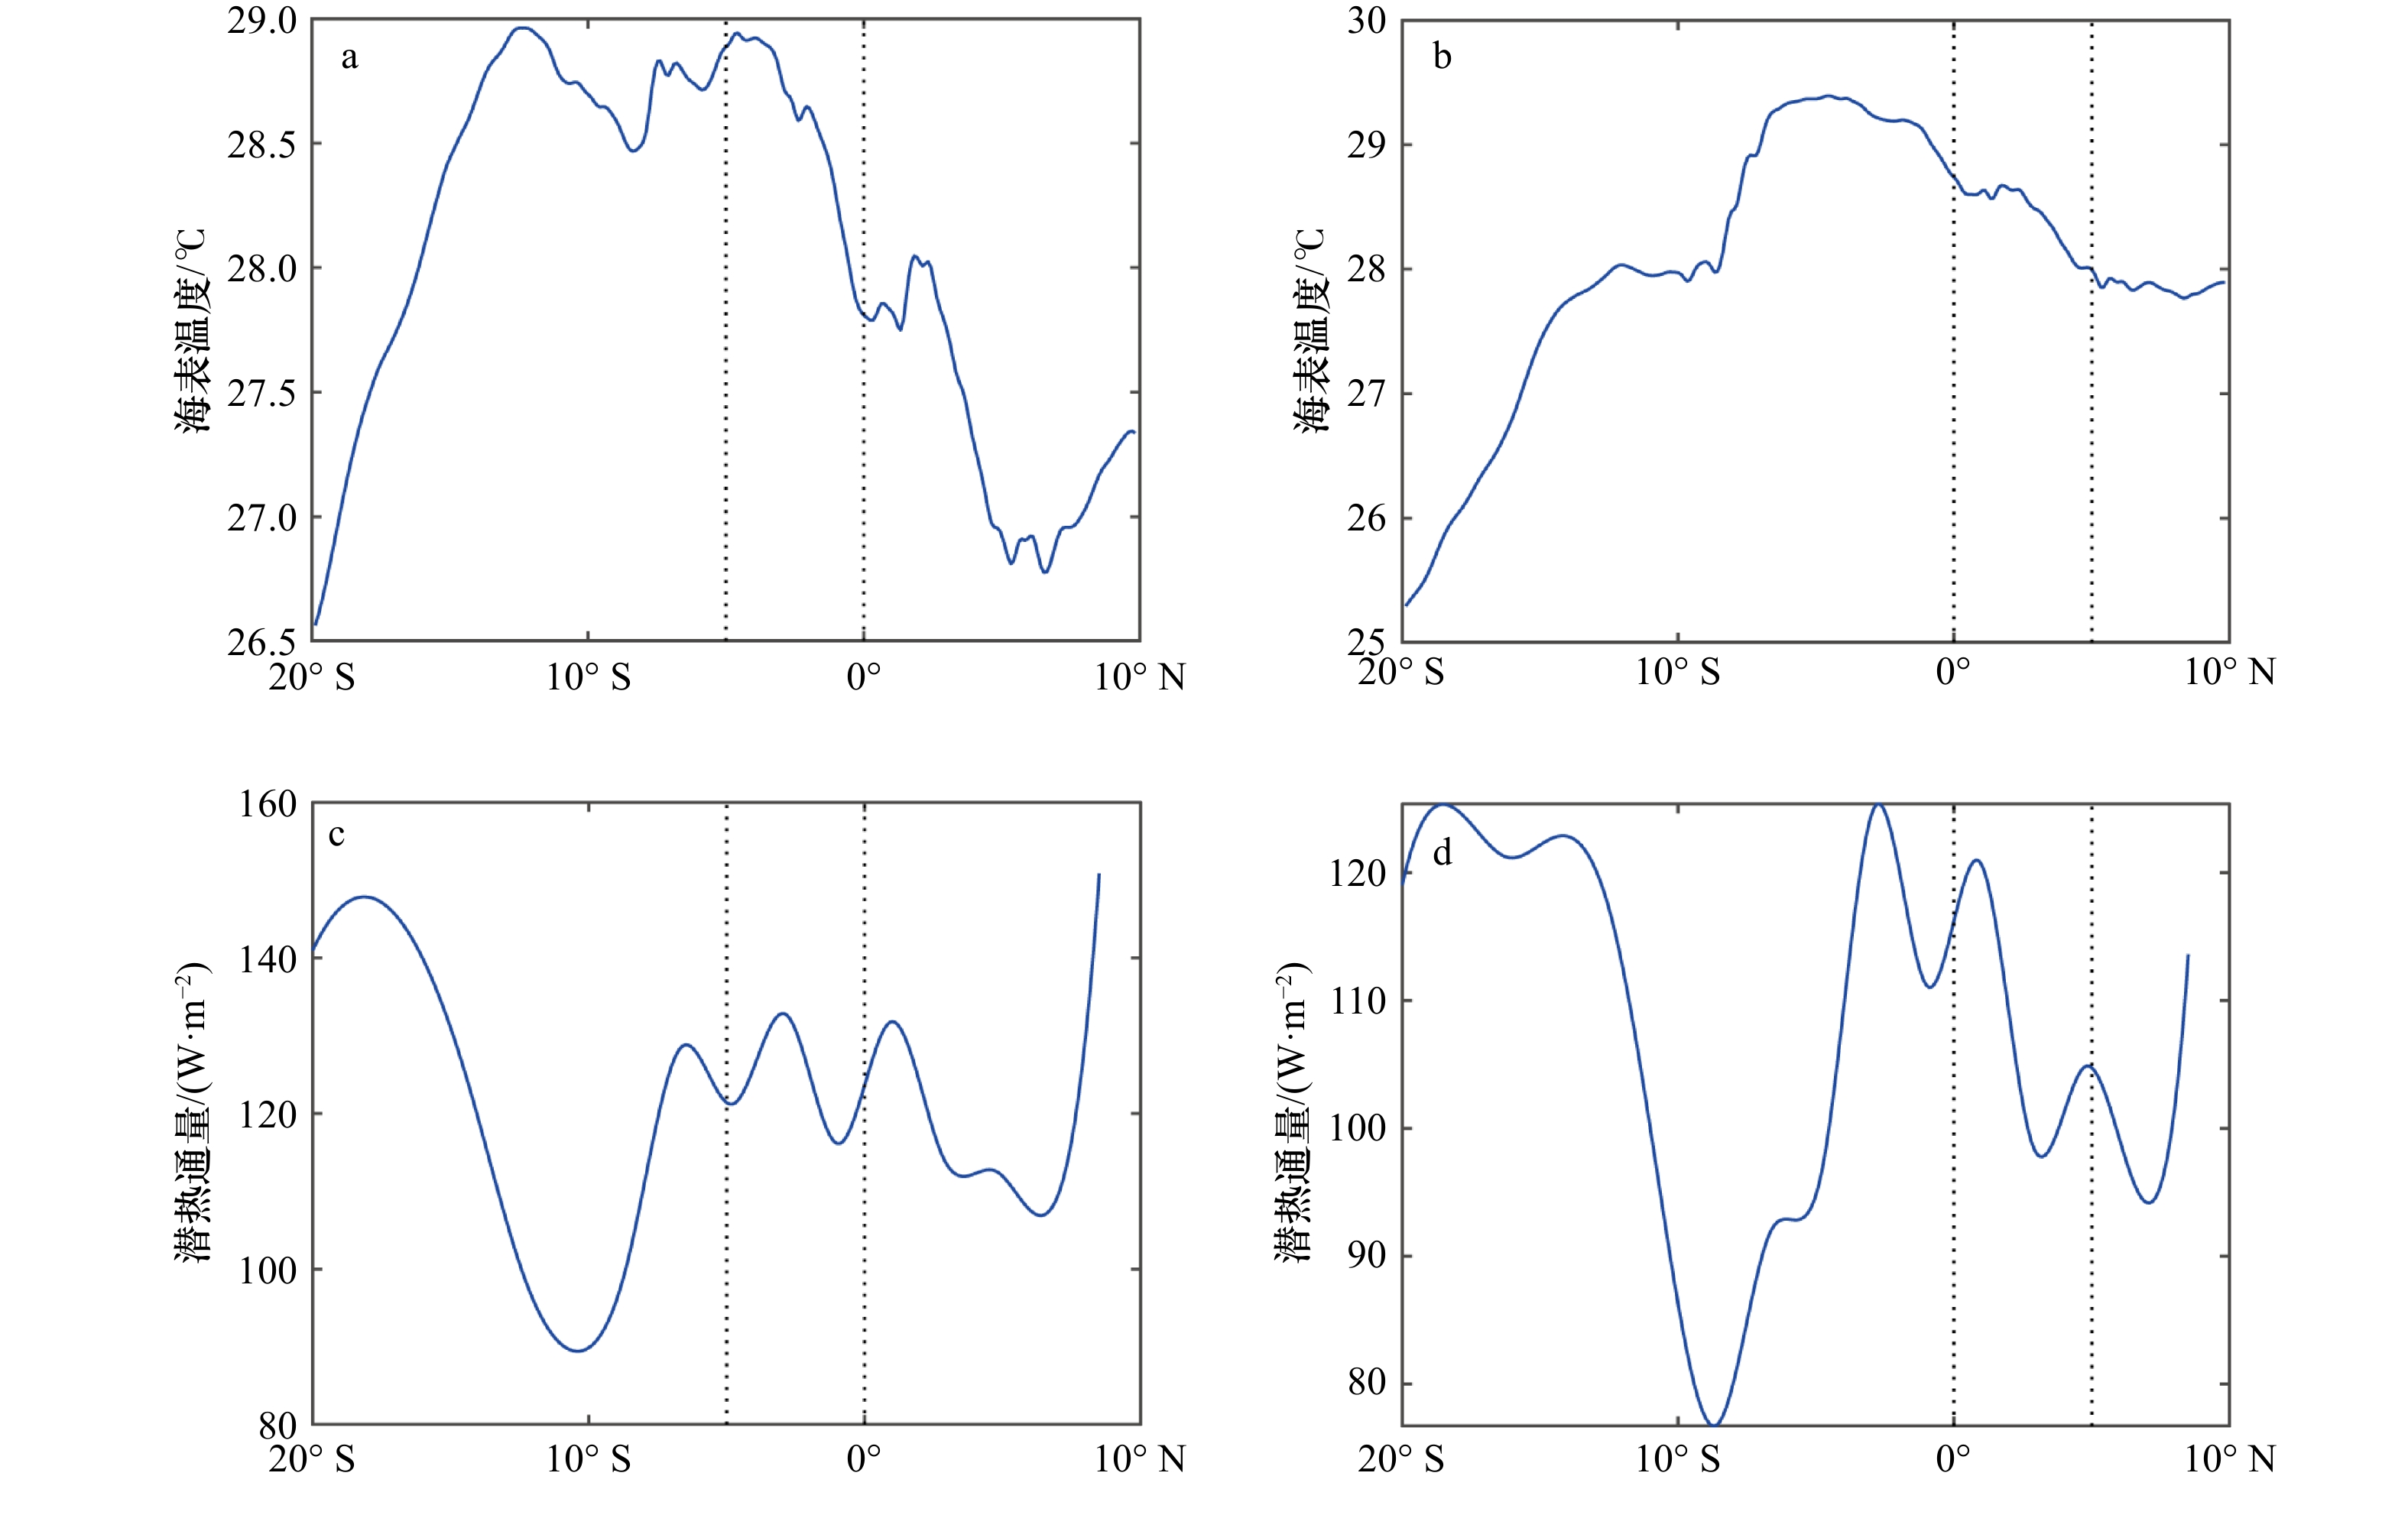
图 14 厄尔尼诺下的MJO事件的海表温度、潜热通量背景场
a,c. 北半球冬天厄尔尼诺发生时在海洋性大陆从纬度带0°~5°S通过的MJO事件所处的海表温度、潜热通量背景场在经度范围100°~120°E平均后随纬度的变化;b,d. 北半球冬天厄尔尼诺发生时在海洋性大陆从纬度带0°~5°N通过的MJO事件所处的海表温度、潜热通量背景场在经度范围100°~120°E平均后随纬度的变化。黑色虚线均表示对应MJO事件的偏折纬度带
Fig. 14 The SST、LHF background fields of MJO events when El Niño happens
a, c. The variation of sea surface temperature and latent heat flux with latitude after longitude averaging between 100°−120°E of MJO events propagating through the Maritime Continent from 0°−5°S in boreal winter when El Niño happens; b, d. the variation of sea surface temperature and latent heat flux with latitude after longitude averaging between 100°−120°E of MJO events propagating through the Maritime Continent from 0°−5°N in boreal winter when El Niño happens. The vertical dashed lines show the latitude belts where MJO events detour
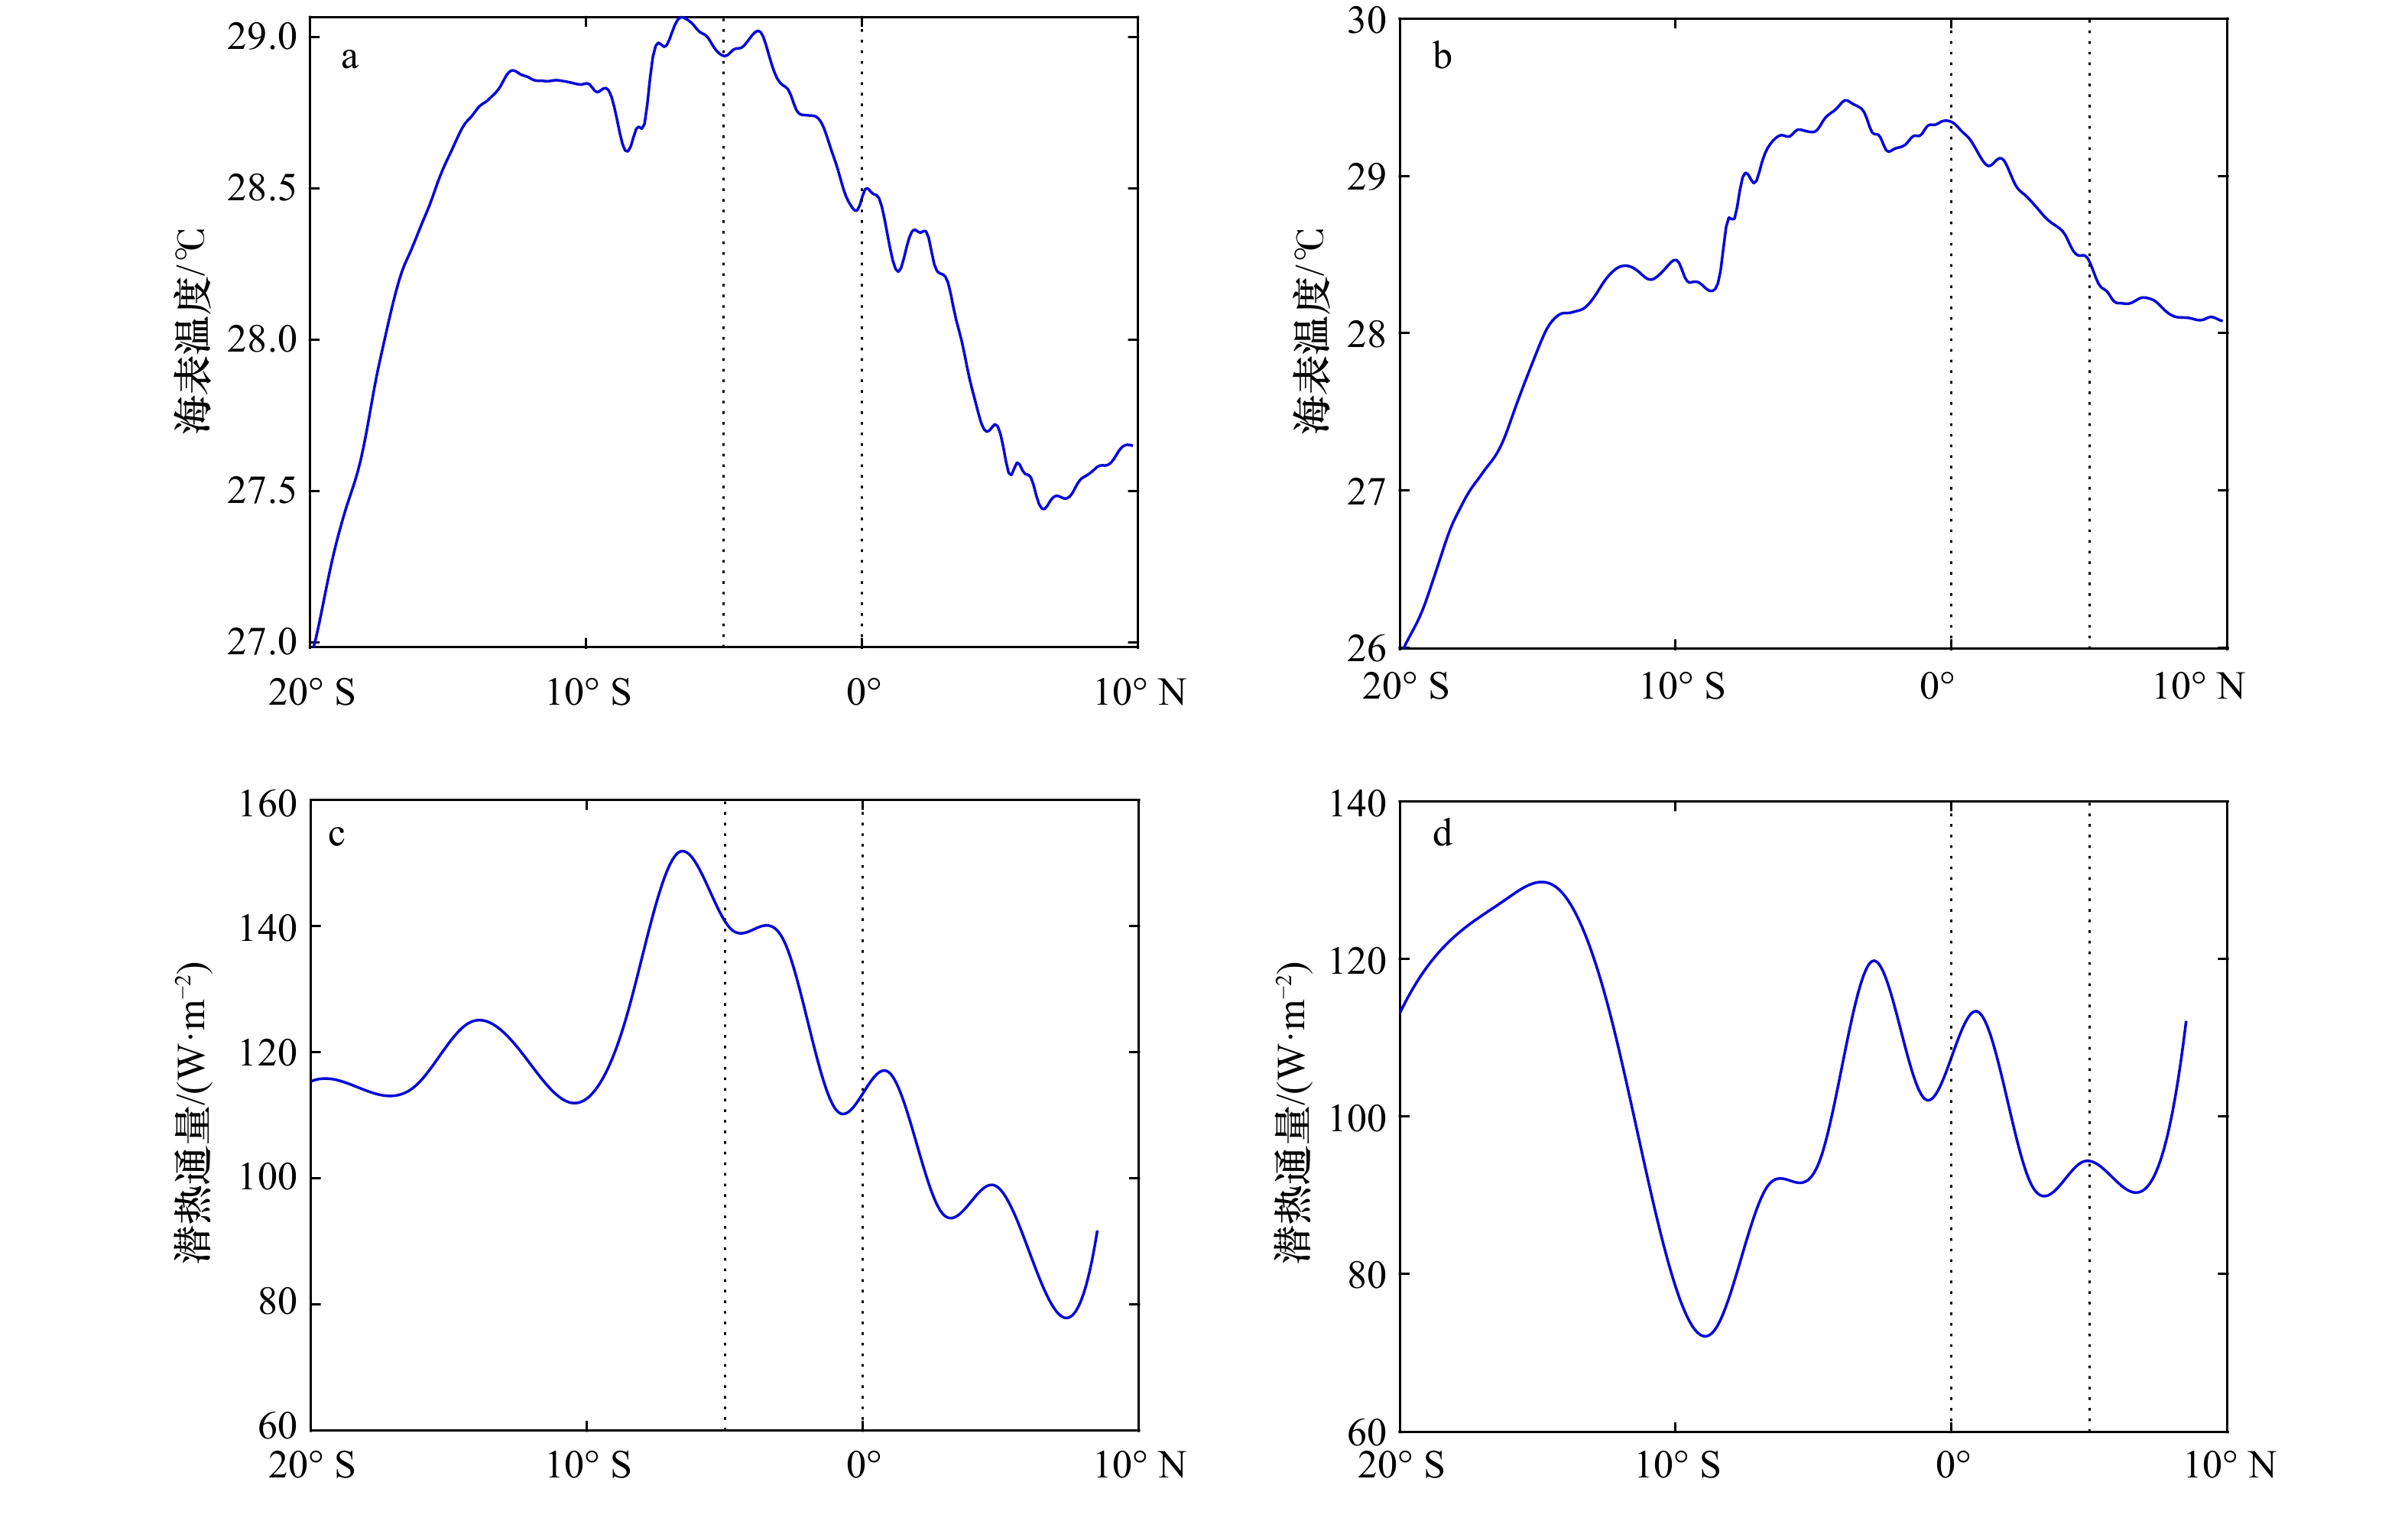
图 15 拉尼娜下的MJO事件的海表温度、潜热通量背景场
a, c. 北半球冬天拉尼娜发生时在海洋性大陆从纬度带0°~5°S通过的MJO事件所处的海表温度、潜热通量背景场在经度范围100°~120°E平均后随纬度的变化;b, d. 北半球冬天拉尼娜发生时在海洋性大陆从纬度带0°~5°N通过的MJO事件所处的海表温度、潜热通量背景场在经度范围100°~120°E平均后随纬度的变化。黑色虚线均表示对应MJO事件的偏折纬度带
Fig. 15 The SST、LHF background fields of MJO events when La Niña happens
a, c. The variation of sea surface temperature and latent heat flux with latitude after longitude averaging between 100°−120°E of MJO events propagating through the Maritime Continent from 0°−5°S in boreal winter when La Niña happens; b, d. the variation of sea surface temperature and latent heat flux with latitude after longitude averaging between 100°−120°E of MJO events propagating through the Maritime Continent from 0°−5°N in boreal winter when La Niña happens. The vertical dashed lines show the latitude belts where MJO events detour

图 16 ENSO中间态下的MJO事件的海表温度、潜热通量背景场
a, c. 北半球冬天ENSO中间态发生时在海洋性大陆从纬度带0°~5°S通过的MJO事件所处的海表温度、潜热通量背景场在经度范围100°~120°E平均后随纬度的变化;b, d. 北半球冬天ENSO中间态发生时在海洋性大陆从纬度带0°~5°N通过的MJO事件所处的海表温度、潜热通量背景场在经度范围100°~120°E平均后随纬度的变化。黑色虚线均表示对应MJO事件的偏折纬度带
Fig. 16 The SST、LHF background fields of MJO events when ENSO neutral condition happens
a, c. The variation of sea surface temperature and latent heat flux with latitude after longitude averaging between 100°−120°E of MJO events propagating through the Maritime Continent from 0°−5°S in boreal winter when ENSO neutral condition happens; b, d. the variation of sea surface temperature and latent heat flux with latitude after longitude averaging between 100°−120°E of MJO events propagating through the Maritime Continent from 0°−5°N in boreal winter when ENSO neutral condition happens. The vertical dashed lines show the latitude belts where MJO events detour
-
[1] Madden R A, Julian P R. Description of global-scale circulation cells in the tropics with a 40−50 day period[J]. Journal of the Atmospheric Sciences, 1972, 29(6): 1109−1123. doi: 10.1175/1520-0469(1972)029<1109:DOGSCC>2.0.CO;2 [2] Zhang Chidong. Madden-julian oscillation[J]. Reviews of Geophysics, 2005, 43(2): RG2003. [3] Kerns B W, Chen S S. A 20-year climatology of madden-julian oscillation convection: large-scale precipitation tracking from TRMM-GPM rainfall[J]. Journal of Geophysical Research: Atmospheres, 2020, 125(7): e2019JD032142. doi: 10.1029/2019JD032142 [4] Zhou Lei, Murtugudde R. Oceanic impacts on MJOs detouring near the maritime continent[J]. Journal of Climate, 2020, 33(6): 2371−2388. doi: 10.1175/JCLI-D-19-0505.1 [5] Wilson E A, Gordon A L, Kim D. Observations of the madden Julian oscillation during Indian Ocean dipole events[J]. Journal of Geophysical Research: Atmospheres, 2013, 118(6): 2588−2599. doi: 10.1002/jgrd.50241 [6] Lau K M, Chan P H. Aspects of the 40−50 day oscillation during the northern summer as inferred from outgoing longwave radiation[J]. Monthly Weather Review, 1986, 114(7): 1354−1367. doi: 10.1175/1520-0493(1986)114<1354:AOTDOD>2.0.CO;2 [7] Knutson T R, Weickmann K M. 30−60 day atmospheric oscillations: composite life cycles of convection and circulation anomalies[J]. Monthly Weather Review, 1987, 115(7): 1407−1436. doi: 10.1175/1520-0493(1987)115<1407:DAOCLC>2.0.CO;2 [8] Zhang Chidong, Hendon H H. Propagating and standing components of the Intraseasonal Oscillation in tropical convection[J]. Journal of the Atmospheric Sciences, 1997, 54(6): 741−752. doi: 10.1175/1520-0469(1997)054<0741:PASCOT>2.0.CO;2 [9] Maloney E D, Hartmann D L. Frictional moisture convergence in a composite life cycle of the Madden-Julian Oscillation[J]. Journal of Climate, 1998, 11(9): 2387−2403. doi: 10.1175/1520-0442(1998)011<2387:FMCIAC>2.0.CO;2 [10] Lo F, Hendon H H. Empirical extended-range prediction of the Madden-Julian Oscillation[J]. Monthly Weather Review, 2000, 128(7): 2528−2543. doi: 10.1175/1520-0493(2000)128<2528:EERPOT>2.0.CO;2 [11] Matthews A J. Propagation mechanisms for the Madden-Julian Oscillation[J]. Quarterly Journal of the Royal Meteorological Society, 2000, 126(569): 2637−2651. [12] Kessler W S. EOF representations of the Madden-Julian Oscillation and its connection with ENSO[J]. Journal of Climate, 2001, 14(13): 3055−3061. doi: 10.1175/1520-0442(2001)014<3055:EROTMJ>2.0.CO;2 [13] Adames Á F, Wallace J M. Three-dimensional structure and evolution of the MJO and its relation to the mean flow[J]. Journal of the Atmospheric Sciences, 2014, 71(6): 2007−2026. doi: 10.1175/JAS-D-13-0254.1 [14] Straub K H. MJO initiation in the real-time multivariate MJO index[J]. Journal of Climate, 2013, 26(4): 1130−1151. doi: 10.1175/JCLI-D-12-00074.1 [15] Kiladis G N, Dias J, Straub K H, et al. A comparison of OLR and circulation-based indices for tracking the MJO[J]. Monthly Weather Review, 2014, 142(5): 1697−1715. doi: 10.1175/MWR-D-13-00301.1 [16] Inness P M, Slingo J M. The interaction of the Madden-Julian Oscillation with the Maritime Continent in a GCM[J]. Quarterly Journal of the Royal Meteorological Society, 2006, 132(618): 1645−1667. doi: 10.1256/qj.05.102 [17] Kerns B W, Chen S S. Large-scale precipitation tracking and the MJO over the Maritime Continent and Indo-Pacific warm pool[J]. Journal of Geophysical Research: Atmospheres, 2016, 121(15): 8755−8776. doi: 10.1002/2015JD024661 [18] Kim D, Kim H, Lee M I. Why does the MJO detour the Maritime Continent during austral summer?[J]. Geophysical Research Letters, 2017, 44(5): 2579−2587. doi: 10.1002/2017GL072643 [19] Zhang Chidong, Ling Jian. Barrier effect of the indo-pacific maritime continent on the MJO: perspectives from tracking MJO precipitation[J]. Journal of Climate, 2017, 30(9): 3439−3459. doi: 10.1175/JCLI-D-16-0614.1 [20] Weaver S J, Wang Wanqiu, Chen Mingyue, et al. Representation of MJO variability in the NCEP climate forecast system[J]. Journal of Climate, 2011, 24(17): 4676−4694. doi: 10.1175/2011JCLI4188.1 [21] Wang Wanqiu, Hung Mengpai, Weaver S J, et al. MJO prediction in the NCEP climate forecast system version 2[J]. Climate Dynamics, 2014, 42(9/10): 2509−2520. [22] Kim H M, Kim D, Vitart F, et al. MJO propagation across the maritime continent in the ECMWF ensemble prediction system[J]. Journal of Climate, 2016, 29(11): 3973−3988. doi: 10.1175/JCLI-D-15-0862.1 [23] Wu C H, Hsu H H. Topographic influence on the MJO in the maritime continent[J]. Journal of Climate, 2009, 22(20): 5433−5448. doi: 10.1175/2009JCLI2825.1 [24] Tan Haochen, Ray P, Barrett B S, et al. Role of topography on the MJO in the maritime continent: a numerical case study[J]. Climate Dynamics, 2020, 55(1/2): 295−314. [25] Sobel A H, Maloney E D, Bellon G, et al. Surface fluxes and tropical intraseasonal variability: a reassessment[J]. Journal of Advances in Modeling Earth Systems, 2010, 2(1): 1−27. [26] Krishnamurti T N, Oosterhof D K, Mehta A V. Air-sea interaction on the time scale of 30 to 50 days[J]. Journal of the Atmospheric Sciences, 1988, 45(8): 1304−1322. doi: 10.1175/1520-0469(1988)045<1304:AIOTTS>2.0.CO;2 [27] Tseng W L, Hsu H H, Keenlyside N, et al. Effects of surface orography and land-sea contrast on the Madden-Julian Oscillation in the maritime continent: a numerical study using ECHAM5-SIT[J]. Journal of Climate, 2017, 30(23): 9725−9741. doi: 10.1175/JCLI-D-17-0051.1 [28] Huffman G J, Bolvin D T, Nelkin E J, et al. The TRMM multisatellite precipitation analysis (TMPA): quasi-global, multiyear, combined-sensor precipitation estimates at fine scales[J]. Journal of Hydrometeorology, 2007, 8(1): 38−55. doi: 10.1175/JHM560.1 [29] Reynolds R W, Smith T M, Liu Chunying, et al. Daily high-resolution-blended analyses for sea surface temperature[J]. Journal of Climate, 2007, 20(22): 5473−5496. doi: 10.1175/2007JCLI1824.1 [30] Kalnay E, Kanamitsu M, Kistler R, et al. The NCEP/NCAR 40-year reanalysis project[J]. Bulletin of the American Meteorological Society, 1996, 77(3): 437−472. doi: 10.1175/1520-0477(1996)077<0437:TNYRP>2.0.CO;2 [31] Lau K M, Chan P H. Aspects of the 40−50 day oscillation during the northern winter as inferred from outgoing longwave radiation[J]. Monthly Weather Review, 1985, 113(11): 1889−1909. doi: 10.1175/1520-0493(1985)113<1889:AOTDOD>2.0.CO;2 [32] Rui Hualan, Wang Bin. Development characteristics and dynamic structure of tropical intraseasonal convection anomalies[J]. Journal of the Atmospheric Sciences, 1990, 47(3): 357−379. doi: 10.1175/1520-0469(1990)047<0357:DCADSO>2.0.CO;2 [33] Trenberth K E. The definition of El Niño[J]. Bulletin of the American Meteorological Society, 1997, 78(12): 2771−2778. doi: 10.1175/1520-0477(1997)078<2771:TDOENO>2.0.CO;2 [34] Zhou Lei, Ruan Ruomei, Murtugudde R. Impacts of detoured Madden-Julian Oscillations on the South Pacific convergence zone[J]. Journal of Climate, 2021, 34(13): 5461−5476. [35] Arakawa A, Schubert W H. Interaction of a cumulus cloud ensemble with the large-scale environment, Part I[J]. Journal of the Atmospheric Sciences, 1974, 31(3): 674−701. doi: 10.1175/1520-0469(1974)031<0674:IOACCE>2.0.CO;2 [36] Emanuel K A, Neelin J D, Bretherton C S. On large-scale circulations in convecting atmospheres[J]. Quarterly Journal of the Royal Meteorological Society, 1994, 120(519): 1111−1143. [37] Arakawa A. The cumulus parameterization problem: past, present, and future[J]. Journal of Climate, 2004, 17(13): 2493−2525. doi: 10.1175/1520-0442(2004)017<2493:RATCPP>2.0.CO;2 [38] Shinoda T, Hendon H H, Glick J. Intraseasonal variability of surface fluxes and sea surface temperature in the tropical western Pacific and Indian Oceans[J]. Journal of Climate, 1998, 11(7): 1685−1702. doi: 10.1175/1520-0442(1998)011<1685:IVOSFA>2.0.CO;2 [39] Araligidad N M, Maloney E D. Wind-driven latent heat flux and the Intraseasonal Oscillation[J]. Geophysical Research Letters, 2008, 35(4): L04815. [40] Sobel A H, Maloney E D, Bellon G, et al. The role of surface heat fluxes in tropical Intraseasonal Oscillations[J]. Nature Geoscience, 2008, 1(10): 653−657. doi: 10.1038/ngeo312 [41] Fink A, Speth P. Some potential forcing mechanisms of the year-to-year variability of the tropical convection and its intraseasonal (25-70-day) variability[J]. International Journal of Climatology, 1997, 17(14): 1513−1534. doi: 10.1002/(SICI)1097-0088(19971130)17:14<1513::AID-JOC210>3.0.CO;2-U [42] Zhang Chidong, Hendon H H, Kessler W S, et al. A workshop on the MJO and ENSO[J]. Bulletin of the American Meteorological Society, 2001, 82(5): 971−976. doi: 10.1175/1520-0477(2001)082<0971:MSAWOT>2.3.CO;2 -

 下载:
下载:
计量
- 文章访问数: 310
- HTML全文浏览量: 199
- PDF下载量: 35
- 被引次数: 0
