

Effect of liquid precipitation and surface air temperature on the early melt onset of Arctic sea ice
-
摘要: 海冰最早开始融化时间(EMO)是体现海冰融化的重要指标,也是影响海冰热收支的关键因素。本文使用EMO遥感数据、ERA5再分析资料和海冰密集度数据分析研究了地表气温和液态降水对EMO影响的相对贡献。研究显示,在5个研究海区中,大西洋扇区南区EMO提前最显著,1979− 2021年的变化率为−3.3 d/(10 a)。北极各海区的地表气温与EMO有着持续1~2个月的显著相关时段,其中太平洋扇区南区、大西洋扇区北区和南区的地表气温较液态降水与EMO相关的持续时间更长,相关性也更强;而对太平洋扇区北区和北极中央区,只有在EMO发生前的2~3周,液态降水对其EMO有着更高的贡献。对于太平洋扇区北区,大气环流提供的强水汽输送通道伸入该海区,使对流层低层饱和水汽增多,500 hPa位势高度的多年变化趋势具有三波绕极环流加强的结构,也有利于经向的热量交换,使比湿的垂向梯度进一步增加,为该海区EMO的提前起到一定的促进作用。对于北极中央区,在EMO提前的年份,液态降水较常年偏高33%,不仅气候态意义下的太平洋水汽通道的输送加强,欧亚大陆上空的水汽通道也与之汇合,促使北极东部形成气旋式水汽输送模态,为EMO的提前发生提供了有利条件。
-
关键词:
- 海冰最早开始融化时间 /
- 液态降水 /
- 地表气温 /
- 相对贡献
Abstract: Early melt onset (EMO) is a crucial time index for sea ice melting and has a significant impact on the thermal balance of sea ice. In this paper, EMO remote sensing, ERA5 reanalysis, and sea ice concentration data have been used to reveal the relative contribution of surface air temperature and liquid precipitation. Our research indicates that, the most significant advancement of EMO is observed in the southern Atlantic sector among the five study sea areas from 1979−2021, with the rate of −3.3 d/(10 a). For the atmospheric factors affecting EMO, surface air temperature has a considerable correlation period lasting 1−2 months with EMO in all Arctic sea areas. In addition, surface air temperature in the southern Pacific sector and northern and southern Atlantic sectors have a longer duration and stronger correlation with EMO than liquid precipitation. However, for the northern Pacific sector and the central Arctic, liquid precipitation has a higher contribution only in the 2−3 weeks prior to EMO. For the northern Pacific sector, atmospheric circulation provides strong water vapor transport channel extends into this sea area, increasing saturated water vapor in the lower troposphere. Meanwhile, the trend of the 500 hPa potential height shows a three-wave strengthening atmospheric circulation structure around the pole, allowing meridional heat exchange and enhancing the vertical gradient of specific humidity, which promotes the advancement of EMO. For the central Arctic, in years when EMO is advanced, the liquid precipitation is 33% higher than climatology. Additionally, not only the Pacific water vapor transport in the climatology is enhanced, but also the converges with water vapor channel over Eurasia continent, contributing to the formation of cyclonic water vapor transport mode in the eastern Arctic, providing conditions for the advancement of EMO. -
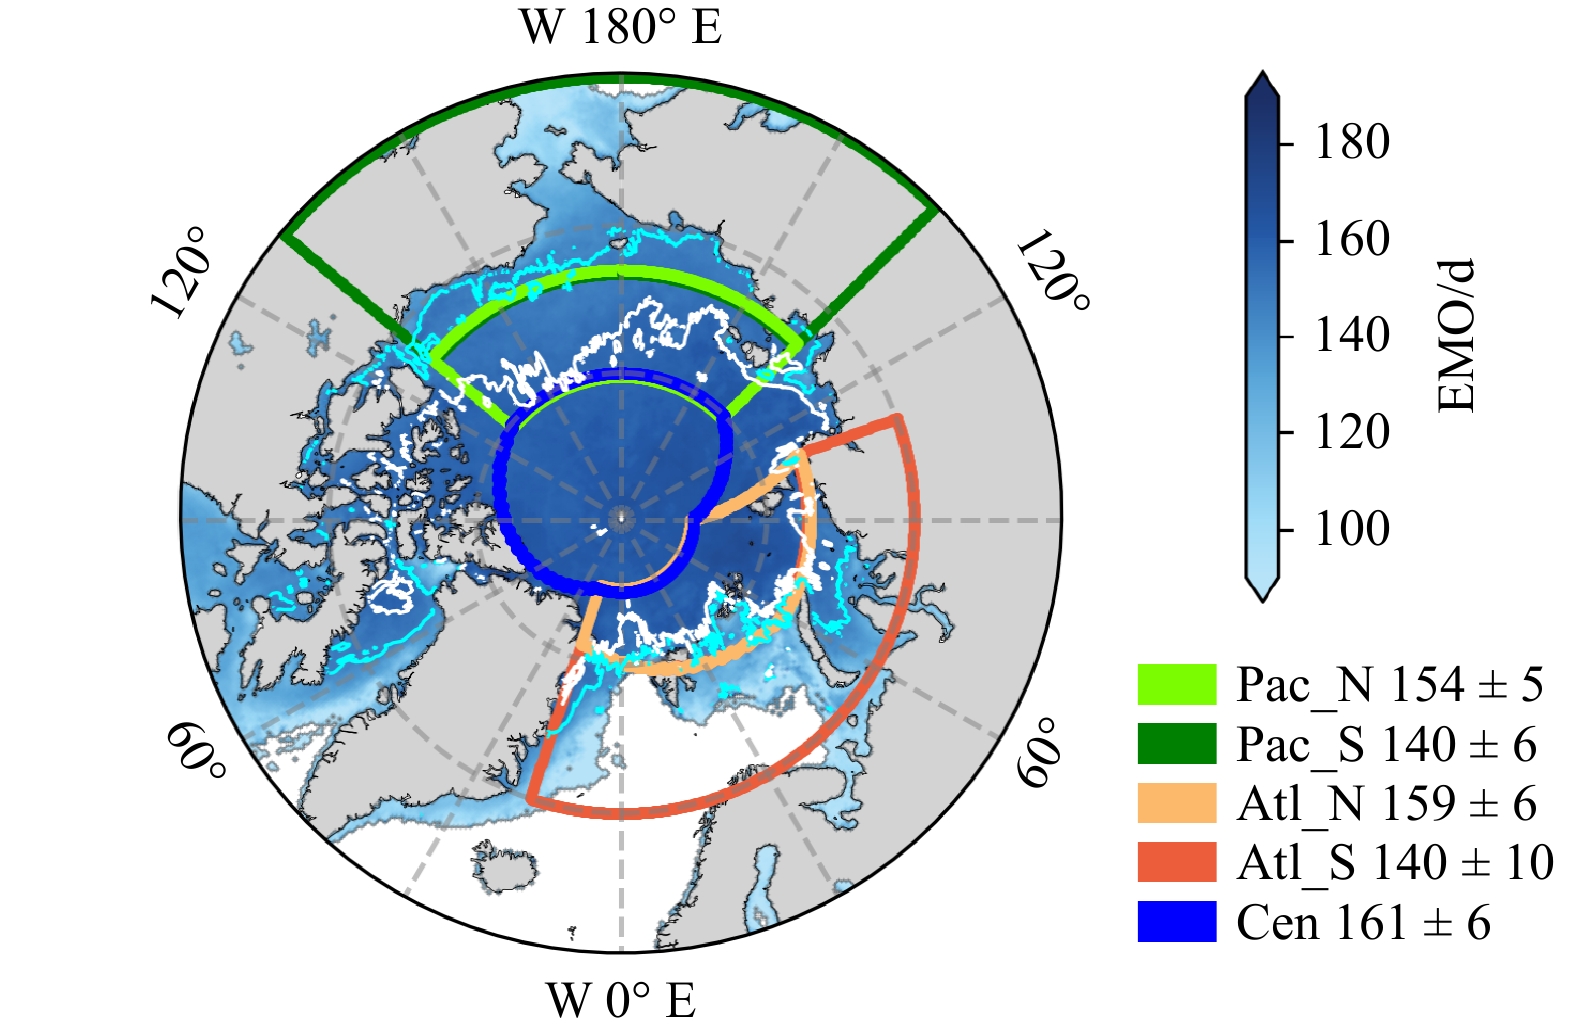
图 1 研究海区分区
背景颜色为1979−2021年气候态EMO空间分布,青色和白色曲线分别代表EMO为第145天及第155天的等值线,图例显示了各分海区EMO均值和标准差(d),EMO数据来源于NASA哥达德空间飞行中心
Fig. 1 The divisions of the study sea area
The background represents the spatial distribution of climatological EMO from 1979 to 2021. The cyan and white contours are the EMO of the 145th and 155th days, respectively. The mean and standard deviation of EMO for each partition are labeled after the corresponding legend, with the unit of the day, EMO data from NASA Goddard Space Flight Center
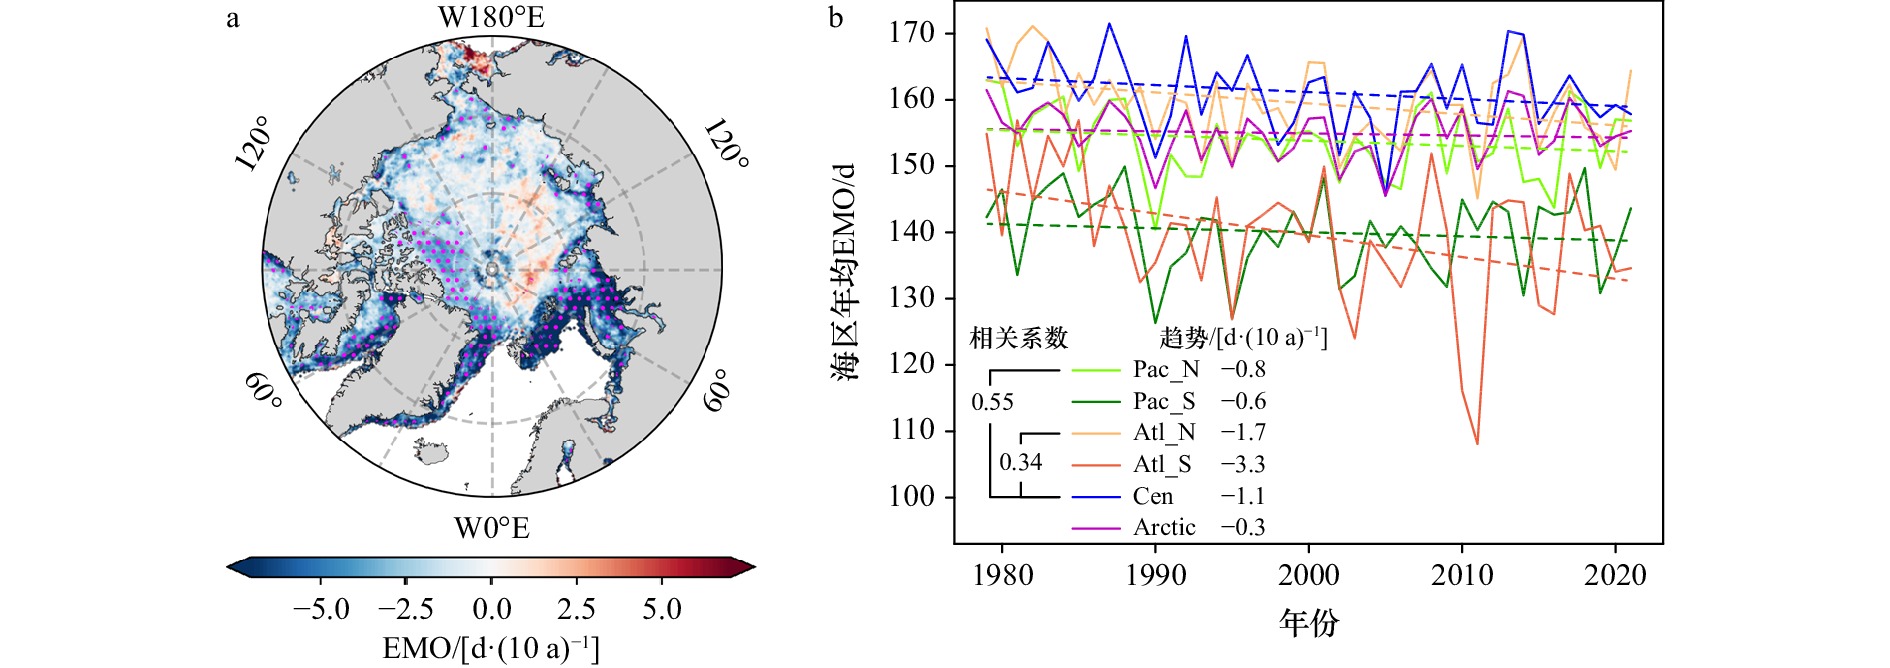
图 2 1979−2021年EMO变化趋势(a)和各海区EMO年际变化时间序列(b)
图a品红色区域置信水平高于90%;图b实线和虚线分别为EMO的区域平均和线性拟合时间序列,图例左侧为北极中央区和太平洋扇区北区以及大西洋扇区北区的相关系数,右侧为各海区趋势
Fig. 2 The EMO variation trend (a) and time series of annual variation of EMO in each sea area (b) from 1979 to 2021
The magenta part has passed the t-test at a confidence level of 90% in figure a; solid and dashed lines are regional average and linear-fit series, respectively in figure b. The correlation coefficients of the central Arctic and the northern Pacific sector and the northern Atlantic sector are labeled on the left side of the legend. The trend values are labeled on the right

图 3 1979−2021年3月27日至7月16日周平均
${{{T}}_{2\;{\rm{m}}}}$ 与EMO相关性空间分布图中彩色所示区域置信水平高于90%;a图中绿色轮廓线为研究海区分界线
Fig. 3 Spatial distribution of the correlation between the weekly average
${{{T}}_{2\;{\rm{m}}}}$ and EMO from March 27 to July 16 during 1979−2021The colored part has passed the two-sided test at a confidence level of 90%; the green contour in figure a is the boundary of the study sea area
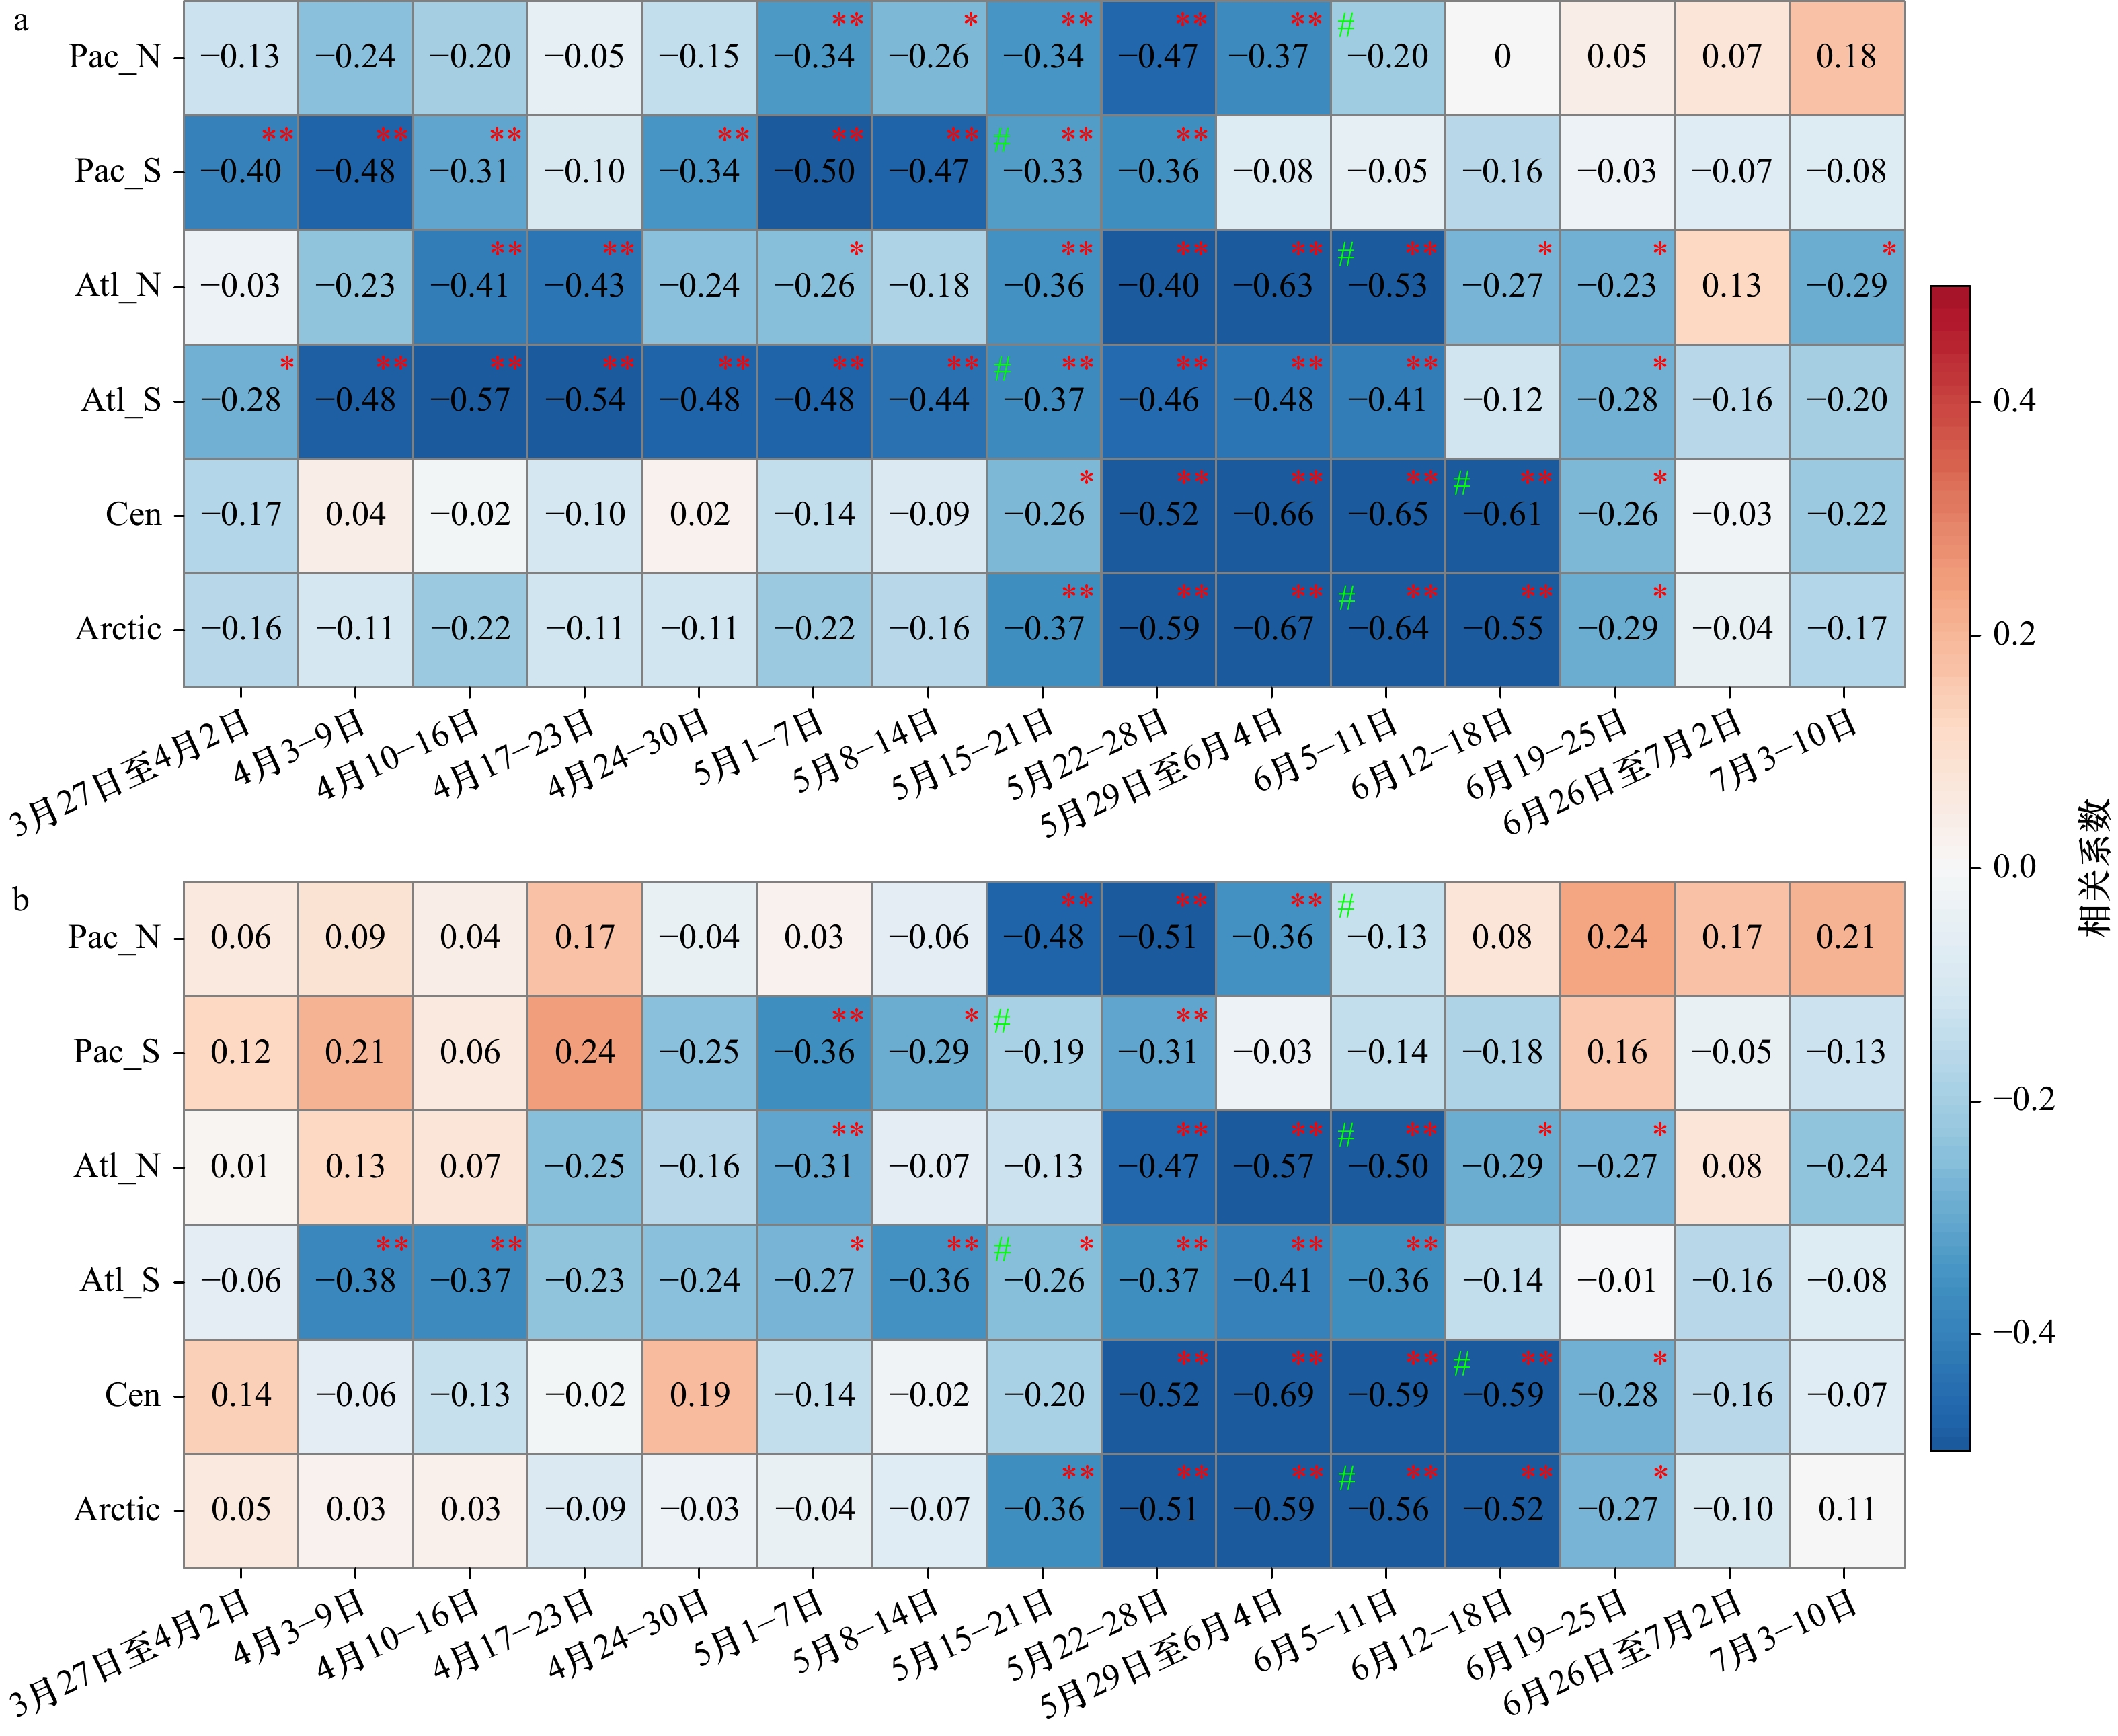
图 4 1979−2021年3月27日至7月16日各海区
${{{T}}_{2\;{\rm{m}}}}$ (a)和RPR(b)与EMO的相关性系数右上角红色*(**)分别表示置信水平高于90%(95%),左上角绿色#所在时段为多年平均EMO发生时段
Fig. 4 Correlation coefficients of
${{{T}}_{2\;{\rm{m}}}}$ (a) and RPR (b) with EMO for each sea area from March 27 to July 16 during 1979−2021The red * (**) in the upper right corner indicates the confidence level above 90% (95%), and the green # in the upper left corner is the multi-year average EMO

图 5 1979−2021年3月27日至7月16日周平均RPR与EMO相关性空间分布
图中彩色所示区域置信水平高于90%;a图中绿色轮廓线为研究海区分界线
Fig. 5 Spatial distribution of the correlation between weekly average RPR and EMO from March 27 to July 16 during 1979−2021
The colored part has passed the two-sided test at a confidence level of 90%; the green contour in figure a is the boundary of the study sea area
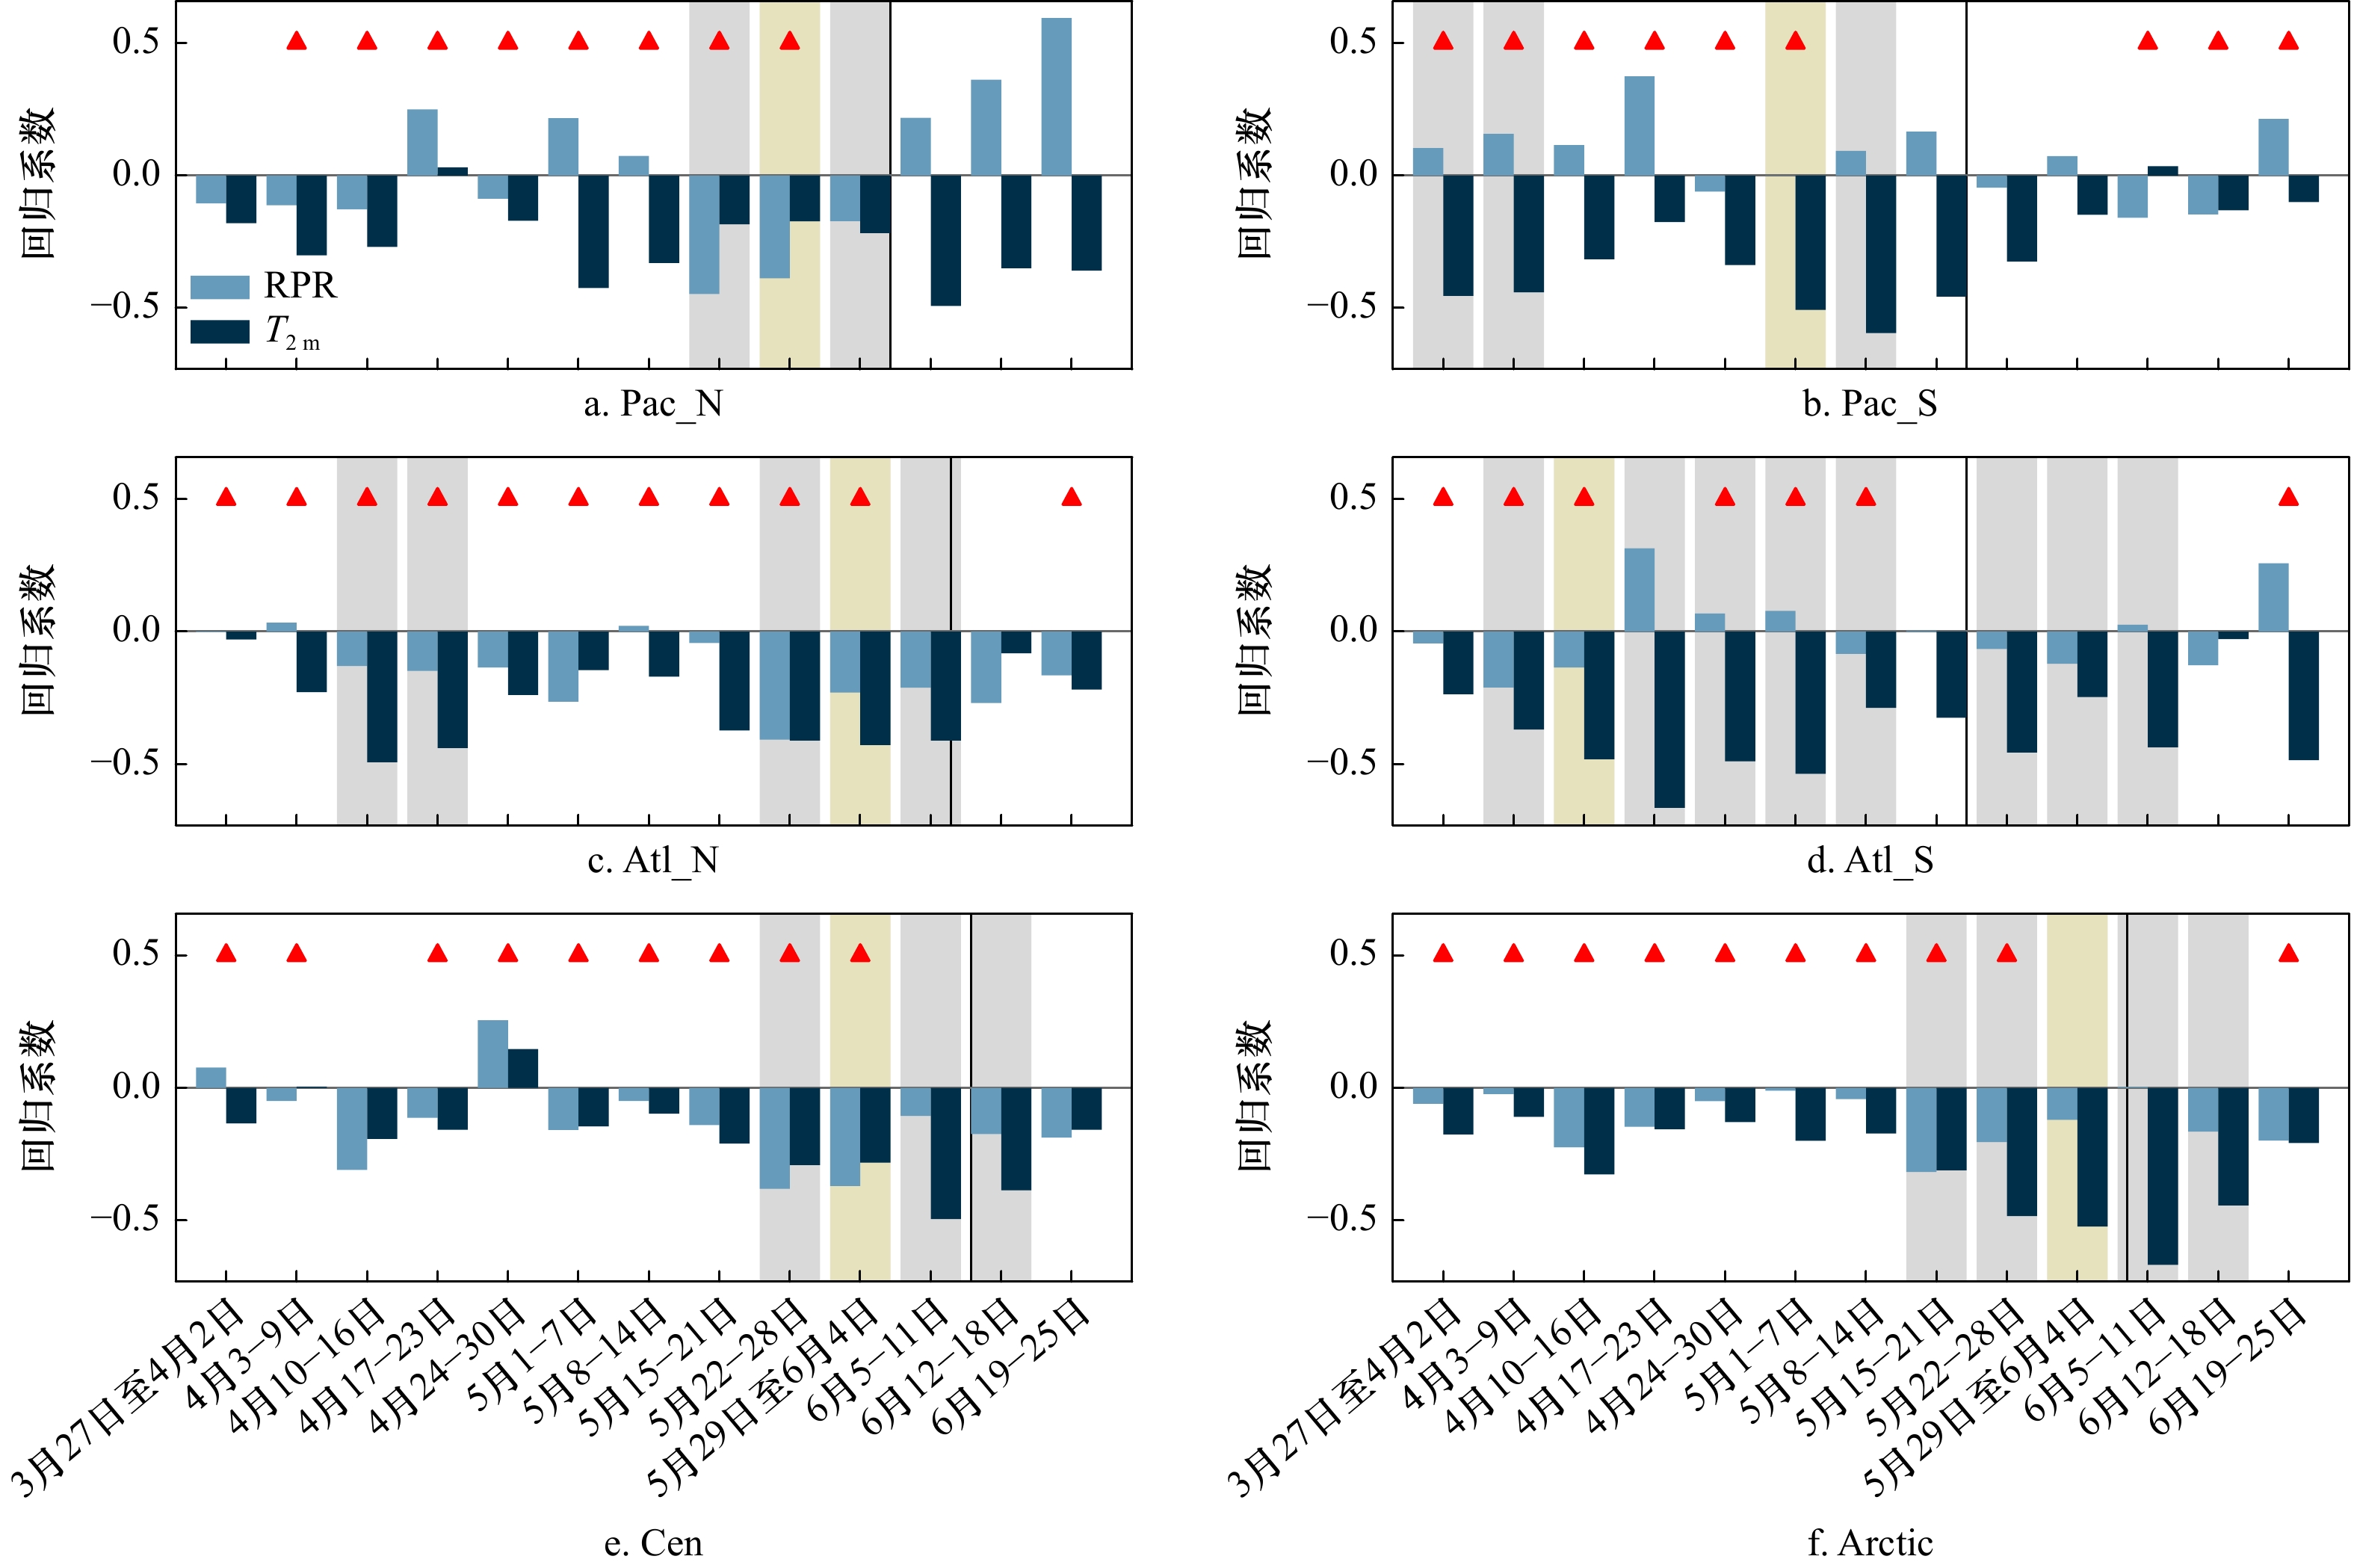
图 6 各海区回归方程中T2 m和RPR的回归系数
灰色阴影时段方程置信水平高于90%,黄色时段方程拟合优度(R2)最佳,红色三角所在时段表明此时T2 m和RPR相互独立,黑色竖线为各海区1979−2021年多年平均EMO时间节点
Fig. 6 The regression coefficients of T2 m and RPR for each sea area
The grey shows confidence levels above 90%, and best fit (R2) is shaded in yellow, the red triangle represents that T2 m and RPR are independent of one another at this period. The black vertical line is the multi-year average EMO from 1979 to 2021
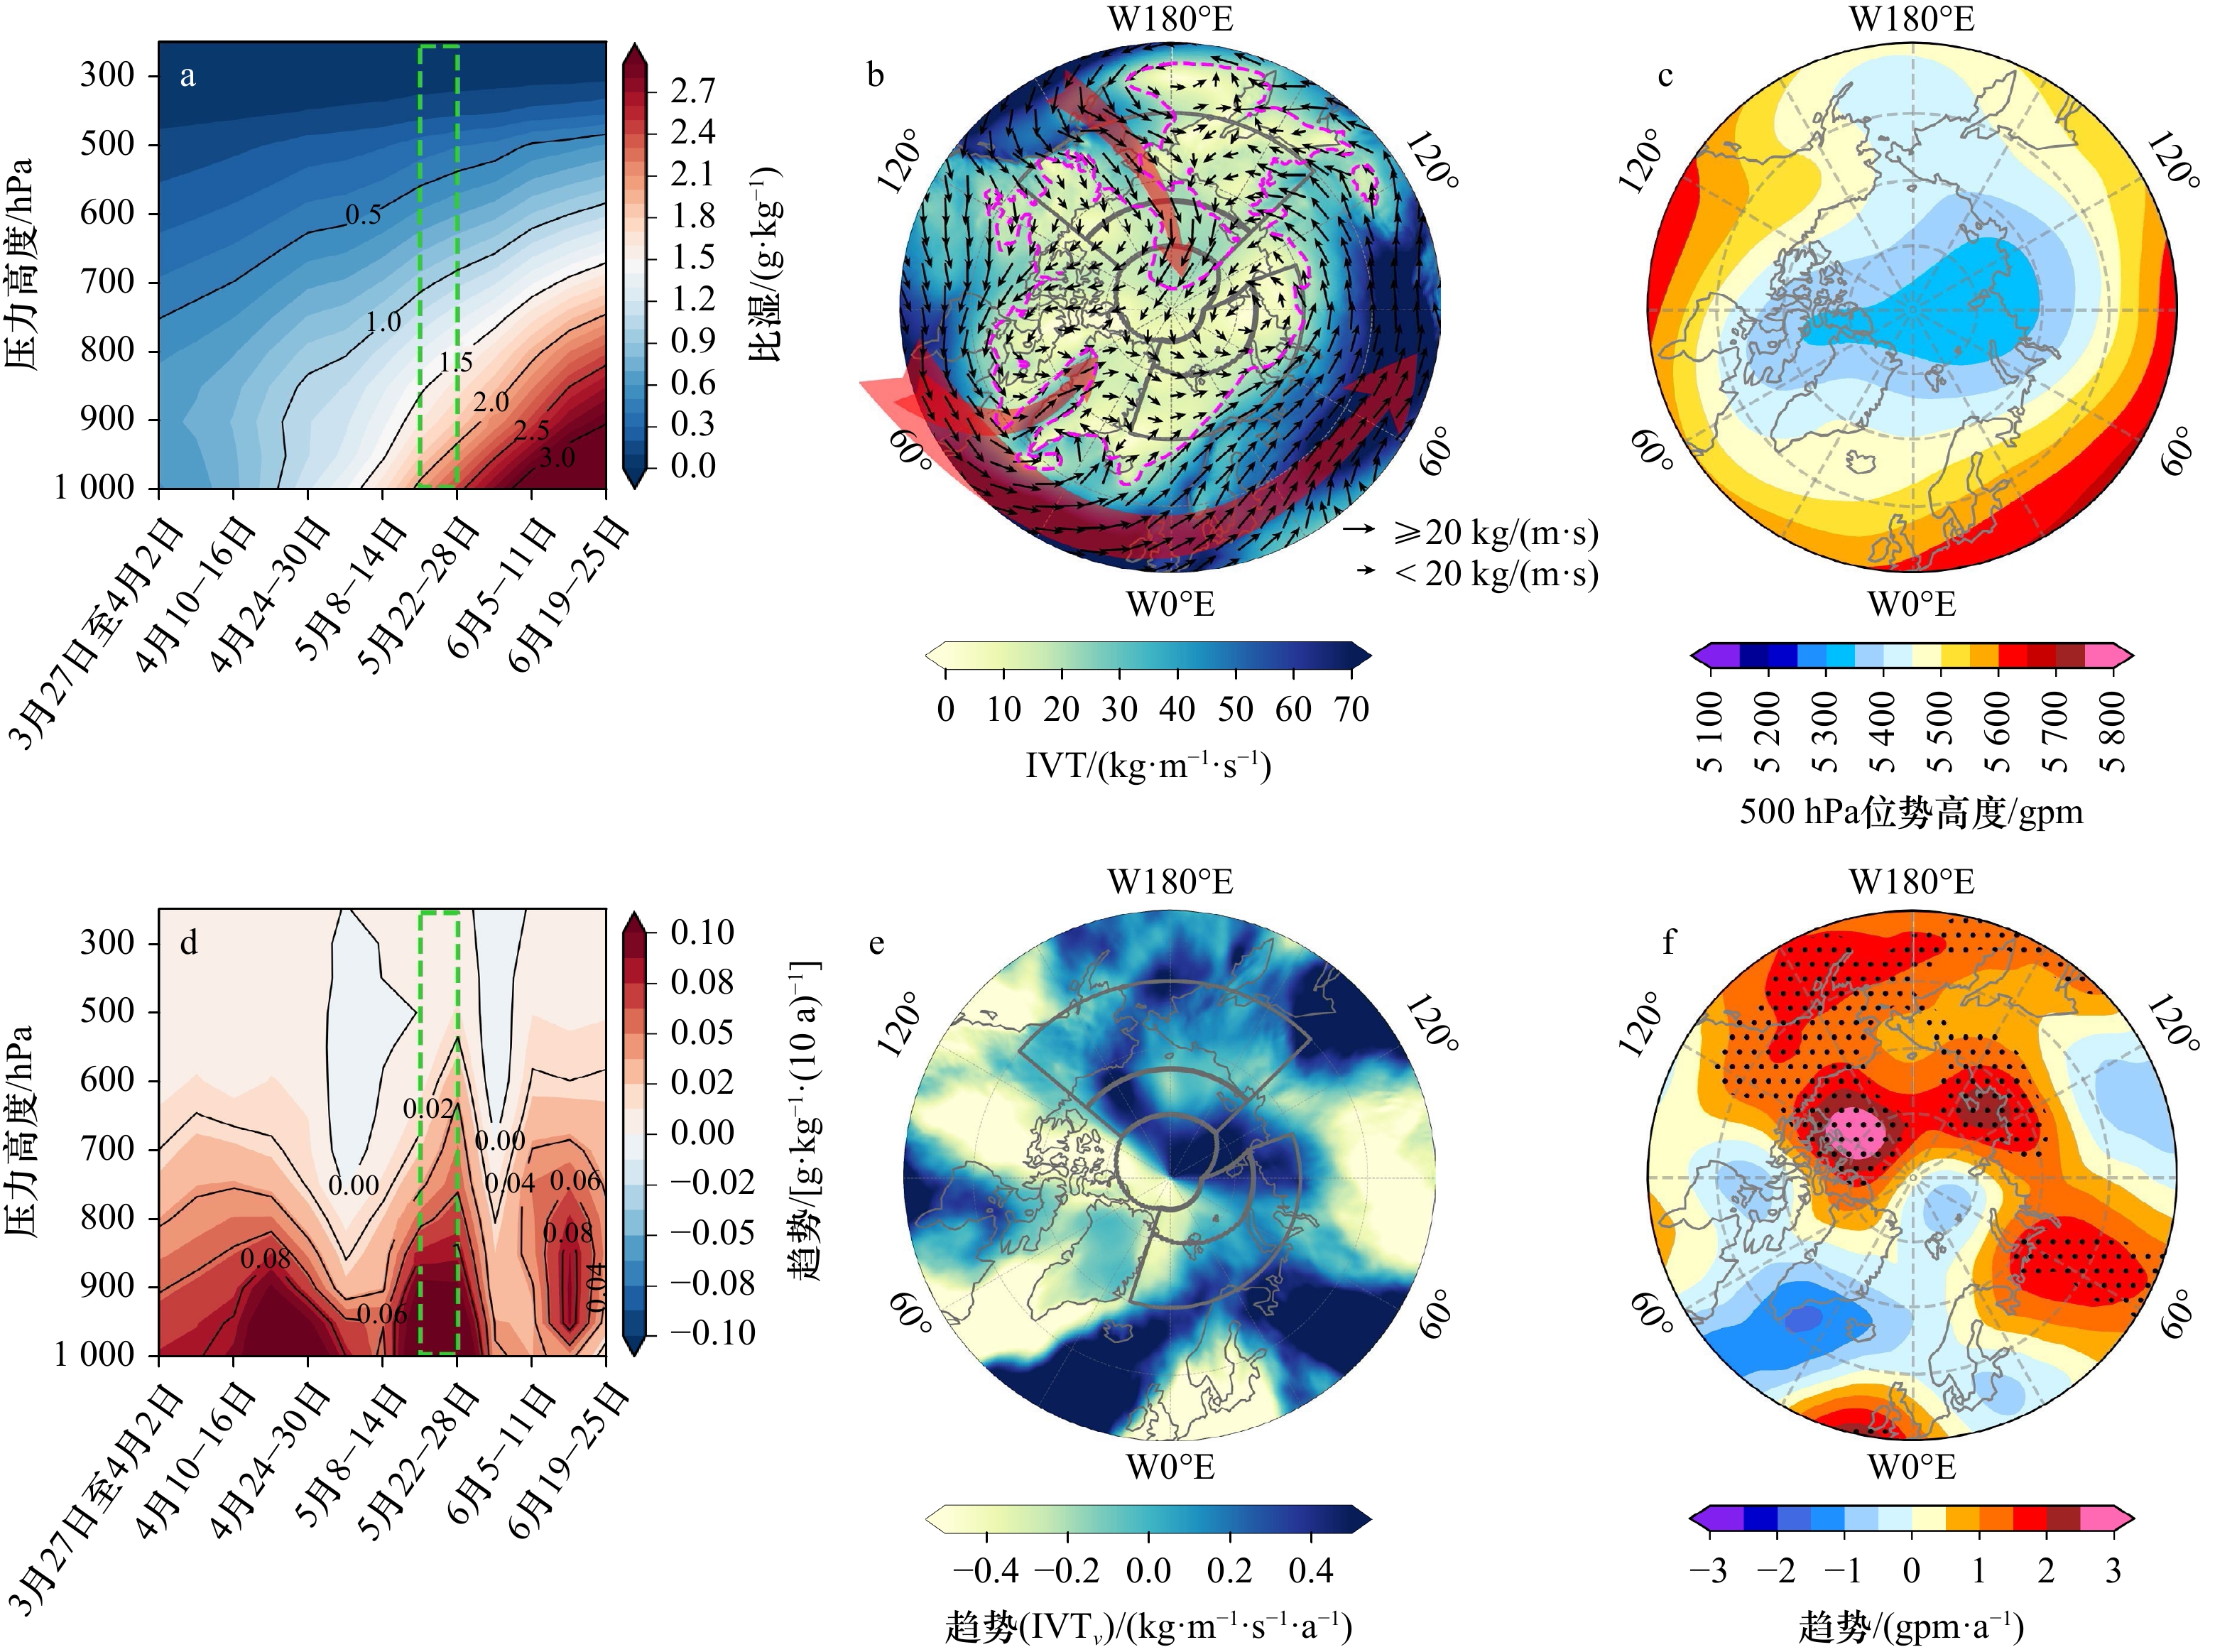
图 7 1979−2021年太平洋扇区北区各时段区域平均比湿垂向结构气候态及趋势(a、d)、北极气候态IVT分布(b)、经向水汽输送IVTv的变化趋势(e)和500 hPa位势高度气候态及趋势的分布(c、f)
图a、d中绿色矩形所框的5月15−28日为RPR起更高贡献的时段;图b品红色虚线为强水汽输送判别阈值[IVT = 20 kg/(m·s)]的等值线,红色箭头为该时段北极强水汽输送系统;图b、e中灰色轮廓线为海区分界线
Fig. 7 The climatology (a) and trend (d) of regional average specific humidity vertical structure in the northern Pacific sector from 1979 to 2021, the distribution of the climatological IVT for the period (b), the trend of IVTv (e) and the distribution of climatological 500 hPa potential height (c) and trend for the period (f)
The green rectangle of figure a and figure d represent the period dominated by RPR, which is May 15 to May 28; the magenta dashed line in figure b represents that IVT = 20 kg/(m·s), which is the discriminant threshold for strong IVT, and the red arrows are the Arctic strong IVT system; the grey contours in figure b and figure e are the sea area boundaries for the period
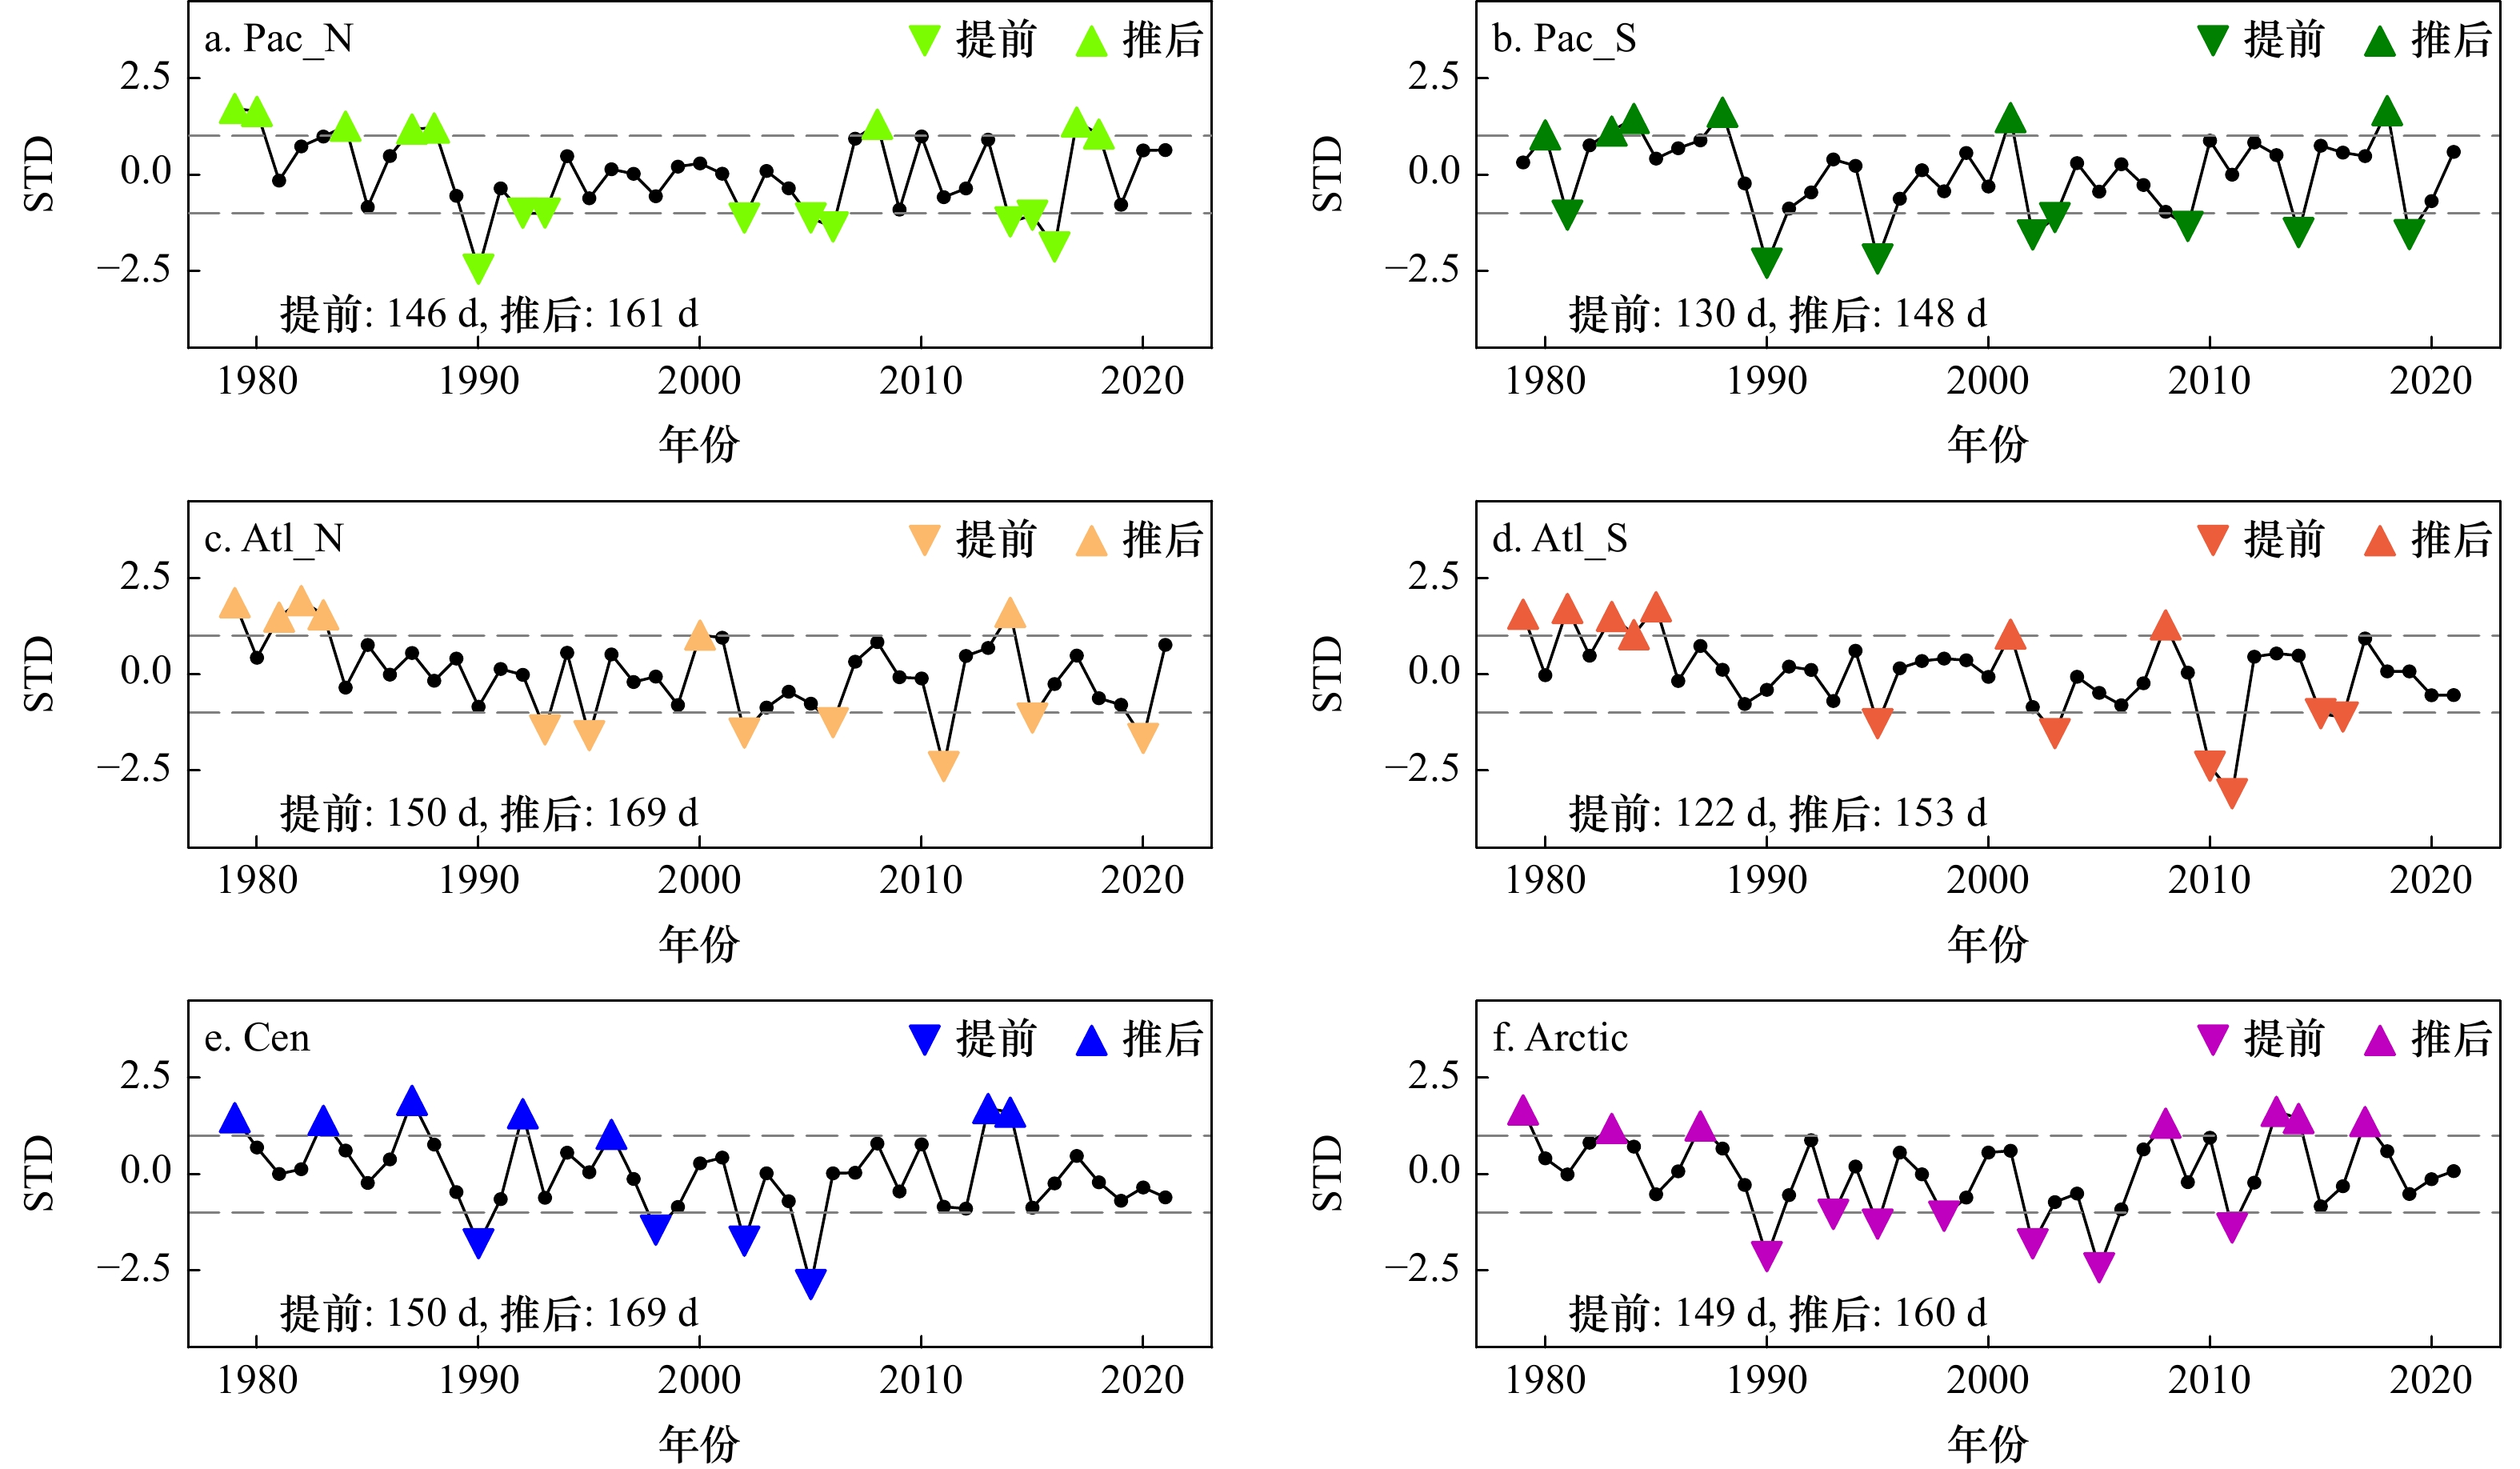
图 8 各海区标准化EMO时间序列
▼(▲)代表EMO提前(推后)的年份,左下方为提前(推后)年份EMO均值
Fig. 8 Standardized EMO time series for each sea area
▼ (▲) represents advance (pushback) years of EMO and the mean value of EMO for advance (pushback) years are labeled on the lower left
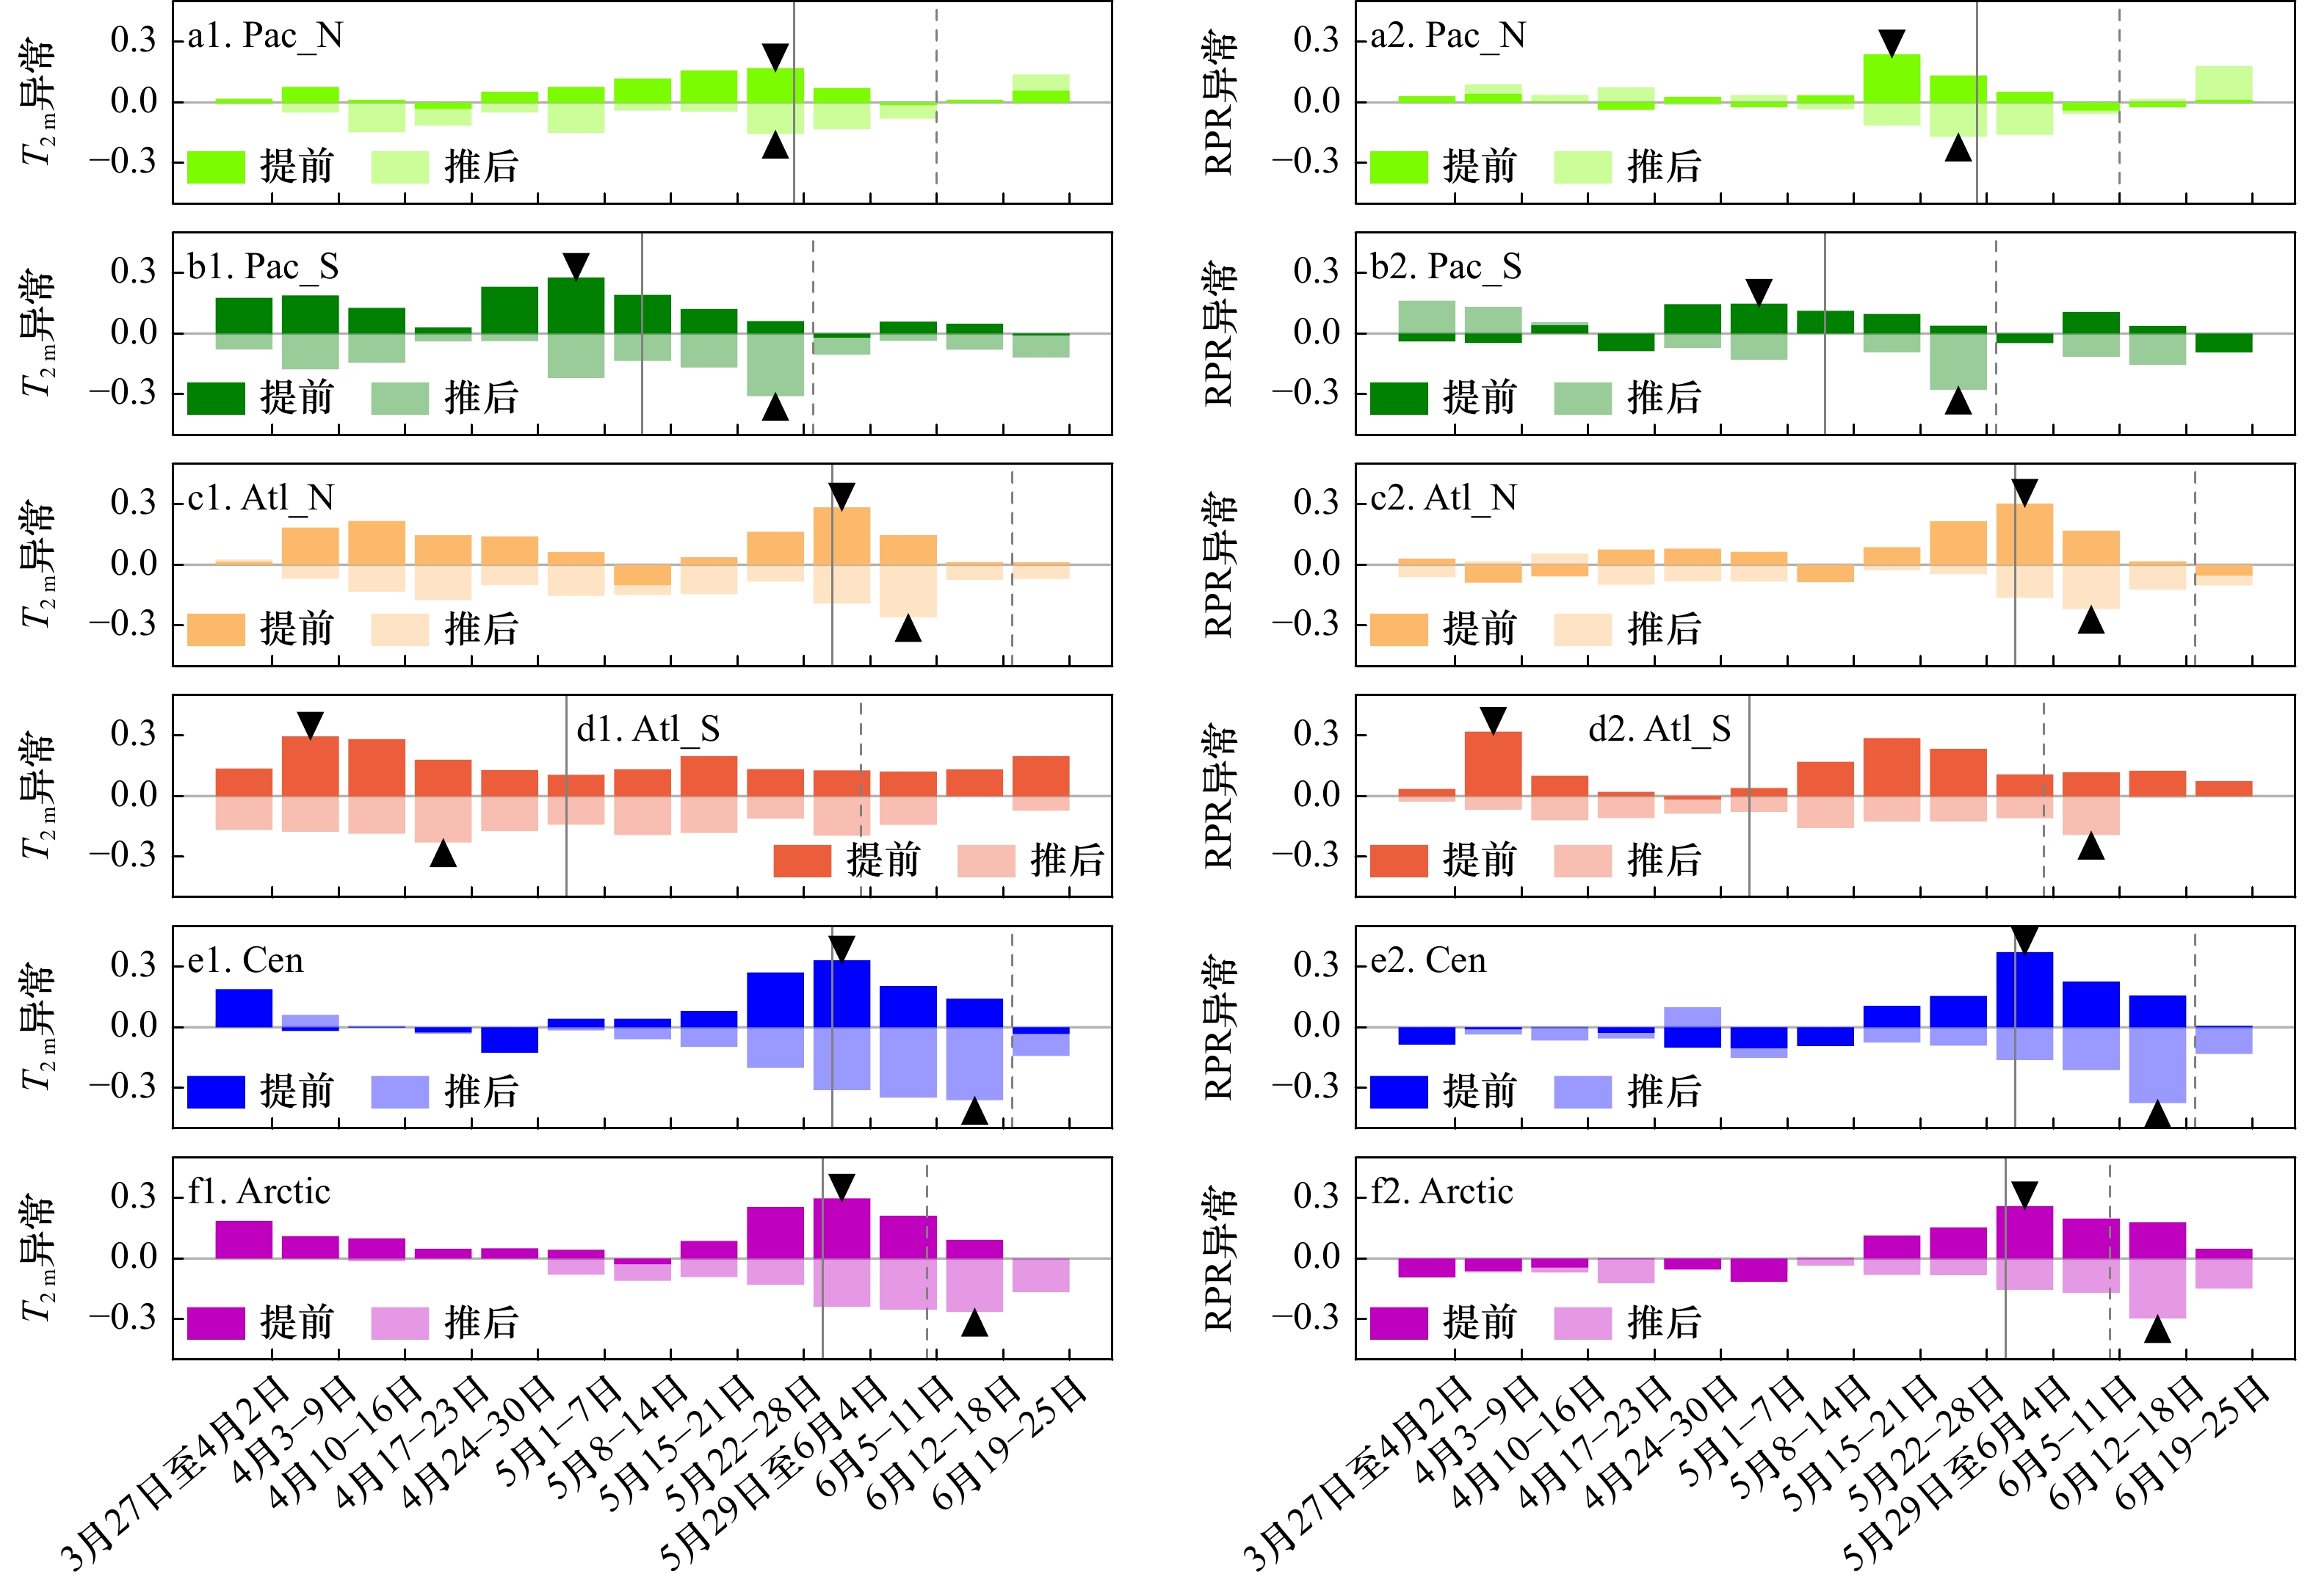
图 9 各海区融化提前和推后年份T2 m(a1、b1、c1、d1、e1、f1)与RPR(a2、b2、c2、d2、e2、f2)的合成特征
灰色竖线中实线和虚线分别代表EMO提前和推后年份平均值,▼(▲)代表T2 m和RPR正(负)异常最大对应时段
Fig. 9 Composite features of T2 m (a1, b1, c1, d1, e1, f1) and RPR (a2, b2, c2, d2, e2, f2) for melt advance and pushback years for each sea area
The solid gaxy line and the dashed black line represent the average EMO in advance and pushback years, respectively, and ▼ (▲) represents the period corresponding to the maximum positive (negative) anomaly of T2 m and RPR

图 10 1979−2021年5月15日至6月4日北极气候态T2 m、RPR和IVT空间分布(a1、b1、c1),以及对应时段太平洋扇区北区(a2、b2、c2)、大西洋扇区北区(a3、b3、c3)以及北极中央区(a4、b4、c4)EMO提前年份以上变量的合成场特征
图c1−c4中红色数字代表各分海区IVT强度值,品红色虚线与图7b含义一致,灰色/红色轮廓线为研究海区分界线
Fig. 10 Spatial distributions of Arctic climatological T2 m, RPR, and IVT (a1, b1, c1) from May 15 to June 4 during 1979−2021, and composite characteristics of the above variables in the northern Pacific sector (a2, b2, c2), the northern Atlantic sector (a3, b3, c3), and the central Arctic (a4, b4, c4) in the EMO advanced years
with the red numbers in figure c1 to figure c4 representing the subsectors IVT, magenta dashed line consistent with figure 7b, grey/red contour represents the study area boundaries
表 1 各海区拟合效果显著时段及对应回归系数
Tab. 1 The significant periods and corresponding regression coefficients of fitting for each sea area
Pac_N Pac_S Alt_N Atl_S Cen Arctic 最佳时段 5月22−28日 5月1−7日 5月29日至6月4日 4月10−16日 5月29日至6月4日 5月22−28日 RPR回归系数 −0.39 0.00 −0.23 −0.13 −0.37 −0.12 T2 m回归系数 −0.17 −0.51 −0.43 −0.48 −0.28 −0.52 RPR/T2 m系数比 2.25 0.00 0.54 0.28 1.32 0.23 R2 0.28* 0.25* 0.42* 0.34* 0.52* 0.46* 注:*表示方程拟合优度高于90%。  下载: 导出CSV
-
[1] Cavalieri D J, Parkinson C L. Arctic sea ice variability and trends, 1979–2010[J]. The Cryosphere, 2012, 6(4): 881−889. doi: 10.5194/tc-6-881-2012 [2] Persson P O G. Onset and end of the summer melt season over sea ice: thermal structure and surface energy perspective from SHEBA[J]. Climate Dynamics, 2012, 39(6): 1349−1371. doi: 10.1007/s00382-011-1196-9 [3] Kwok R. Arctic sea ice thickness, volume, and multiyear ice coverage: losses and coupled variability (1958–2018)[J]. Environmental Research Letters, 2018, 13(10): 105005. doi: 10.1088/1748-9326/aae3ec [4] Horvath S, Stroeve J, Rajagopalan B, et al. Arctic sea ice melt onset favored by an atmospheric pressure pattern reminiscent of the North American-Eurasian Arctic pattern[J]. Climate Dynamics, 2021, 57(7/8): 1771−1787. [5] Perovich D K, Polashenski C. Albedo evolution of seasonal Arctic sea ice[J]. Geophysical Research Letters, 2012, 39(8): L08501. [6] 韩微, 效存德, 窦挺峰, 等. 北极地区春季降水呈现固态向液态转变的态势[J]. 科学通报, 2018, 63(12): 1154−1162. doi: 10.1360/N972018-00088Han Wei, Xiao Cunde, Dou Tingfeng, et al. Arctic has been going through a transition from solid precipitation to liquid precipitation in spring[J]. Chinese Science Bulletin, 2018, 63(12): 1154−1162. doi: 10.1360/N972018-00088 [7] Mahmud M S, Howell S E L, Geldsetzer T, et al. Detection of melt onset over the northern Canadian Arctic Archipelago sea ice from RADARSAT, 1997–2014[J]. Remote Sensing of Environment, 2016, 178: 59−69. doi: 10.1016/j.rse.2016.03.003 [8] Meier W N, Hovelsrud G K, van Oort B E H, et al. Arctic sea ice in transformation: A review of recent observed changes and impacts on biology and human activity[J]. Reviews of Geophysics, 2014, 52(3): 185−217. doi: 10.1002/2013RG000431 [9] Markus T, Stroeve J C, Miller J. Recent changes in Arctic sea ice melt onset, freezeup, and melt season length[J]. Journal of Geophysical Research: Oceans, 2009, 114(C12): C12024. doi: 10.1029/2009JC005436 [10] Stroeve J C, Markus T, Boisvert L, et al. Changes in Arctic melt season and implications for sea ice loss[J]. Geophysical Research Letters, 2014, 41(4): 1216−1225. doi: 10.1002/2013GL058951 [11] Mortin J, Svensson G, Graversen R G, et al. Melt onset over Arctic sea ice controlled by atmospheric moisture transport[J]. Geophysical Research Letters, 2016, 43(12): 6636−6642. doi: 10.1002/2016GL069330 [12] Liang H J, Su J. Variability in sea ice melt onset in the arctic northeast passage: seesaw of the Laptev Sea and the east Siberian Sea[J]. Journal of Geophysical Research: Oceans, 2021, 126(10): e2020JC016985. doi: 10.1029/2020JC016985 [13] Bliss A C, Steele M, Peng G, et al. Regional variability of Arctic sea ice seasonal change climate indicators from a passive microwave climate data record[J]. Environmental Research Letters, 2019, 14(4): 045003. doi: 10.1088/1748-9326/aafb84 [14] Kay J E, Gettelman A. Cloud influence on and response to seasonal Arctic sea ice loss[J]. Journal of Geophysical Research: Atmospheres, 2009, 114(D18): D18204. doi: 10.1029/2009JD011773 [15] Huang Y Y, Dong X Q, Xi B K, et al. A survey of the atmospheric physical processes key to the onset of Arctic sea ice melt in spring[J]. Climate Dynamics, 2019, 52(7/8): 4907−4922. [16] Pavlova O, Pavlov V, Gerland S. The impact of winds and sea surface temperatures on the Barents Sea ice extent, a statistical approach[J]. Journal of Marine Systems, 2014, 130: 248−255. doi: 10.1016/j.jmarsys.2013.02.011 [17] Serreze M C, Barrett A P, Cassano J J. Circulation and surface controls on the lower tropospheric air temperature field of the Arctic[J]. Journal of Geophysical Research: Atmospheres, 2011, 116(D7): D07104. [18] Bintanja R, Selten F M. Future increases in Arctic precipitation linked to local evaporation and sea-ice retreat[J]. Nature, 2014, 509(7501): 479−482. doi: 10.1038/nature13259 [19] McCrystall M R, Stroeve J, Serreze M, et al. New climate models reveal faster and larger increases in Arctic precipitation than previously projected[J]. Nature Communications, 2021, 12(1): 6765. doi: 10.1038/s41467-021-27031-y [20] Dou Tingfeng, Xiao Cunde, Liu Jiping, et al. Trends and spatial variation in rain-on-snow events over the Arctic Ocean during the early melt season[J]. The Cryosphere, 2021, 15(2): 883−895. doi: 10.5194/tc-15-883-2021 [21] Oltmanns M, Straneo F, Tedesco M. Increased Greenland melt triggered by large-scale, year-round cyclonic moisture intrusions[J]. The Cryosphere, 2019, 13(3): 815−825. doi: 10.5194/tc-13-815-2019 [22] Xu M, Yang Q H, Hu X M, et al. Record-breaking rain falls at Greenland summit controlled by warm moist-air intrusion[J]. Environmental Research Letters, 2022, 17(4): 044061. doi: 10.1088/1748-9326/ac60d8 [23] Dou Tingfeng, Xiao Cunde, Liu Jiping, et al. A key factor initiating surface ablation of Arctic sea ice: earlier and increasing liquid precipitation[J]. The Cryosphere, 2019, 13(4): 1233−1246. doi: 10.5194/tc-13-1233-2019 [24] Thompson D W J, Wallace J M. The Arctic oscillation signature in the wintertime geopotential height and temperature fields[J]. Geophysical Research Letters, 1998, 25(9): 1297−1300. doi: 10.1029/98GL00950 [25] Drobot S D, Anderson M R. An improved method for determining snowmelt onset dates over Arctic sea ice using scanning multichannel microwave radiometer and Special Sensor Microwave/Imager data[J]. Journal of Geophysical Research: Atmospheres, 2001, 106(D20): 24033−24049. doi: 10.1029/2000JD000171 [26] Cox C J, Stone R S, Douglas D C, et al. The Aleutian low-Beaufort sea anticyclone: a climate index correlated with the timing of springtime melt in the Pacific Arctic cryosphere[J]. Geophysical Research Letters, 2019, 46(13): 7464−7473. doi: 10.1029/2019GL083306 [27] 纪旭鹏, 赵进平. 北极中央区海冰密集度与云量相关性分析[J]. 海洋学报, 2015, 37(11): 92−104.Ji Xupeng, Zhao Jinping. Analysis of correlation between sea ice concentration and cloudiness in the central Arctic[J]. Haiyang Xuebao, 2015, 37(11): 92−104. [28] Wei Jianfen, Su Jie. Mechanism of an abrupt decrease in sea-ice cover in the pacific sector of the arctic during the late 1980s[J]. Atmosphere-Ocean, 2014, 52(5): 434−445. doi: 10.1080/07055900.2014.970505 [29] Eastwood S, Lavergne T, Tonboe R, et al. Algorithm theoretical basis document for the OSI SAF global sea ice concentration climate data record[EB/OL]. [2023−01−01]. https://osisaf-hl.met.no/sites/osisaf-hl/files/baseline_document/osisaf_cdop3_ss2_atbd_sea-ice-conc-climate-data-ecord_v1p2.pdf (last access: 4 September 2023), 2016. [30] Pedersen R A, Cvijanovic I, Langen P L, et al. The impact of regional arctic sea ice loss on atmospheric circulation and the NAO[J]. Journal of Climate, 2016, 29(2): 889−902. doi: 10.1175/JCLI-D-15-0315.1 [31] Bland J M, Bland D G. Statistics notes: One and two sided tests of significance[J]. BMJ, 1994, 309: 248. doi: 10.1136/bmj.309.6949.248 [32] Babb D G, Galley R J, Asplin M G, et al. Multiyear sea ice export through the Bering Strait during winter 2011–2012[J]. Journal of Geophysical Research: Oceans, 2013, 118(10): 5489−5503. doi: 10.1002/jgrc.20383 [33] Ferrari C P, Dommergue A, Boutron C F, et al. Profiles of Mercury in the snow pack at Station Nord, Greenland shortly after polar sunrise[J]. Geophysical Research Letters, 2004, 31(3): L03401. [34] Spielhagen R F, Werner K, Sørensen S A, et al. Enhanced modern heat transfer to the arctic by warm atlantic water[J]. Science, 2011, 331(6016): 450−453. doi: 10.1126/science.1197397 [35] Liu Zheng, Schweiger A. Synoptic conditions, clouds, and sea ice melt onset in the Beaufort and Chukchi seasonal ice zone[J]. Journal of Climate, 2017, 30(17): 6999−7016. doi: 10.1175/JCLI-D-16-0887.1 [36] Francis D, Fonseca R, Nelli N, et al. Atmospheric rivers drive exceptional Saharan dust transport towards Europe[J]. Atmospheric Research, 2022, 266: 105959. doi: 10.1016/j.atmosres.2021.105959 [37] Xu Daohuan, Du Ling, Ma Jingkai, et al. Pathways of meridional atmospheric moisture transport in the central Arctic[J]. Acta Oceanologica Sinica, 2020, 39(5): 55−64. doi: 10.1007/s13131-020-1598-9 [38] 郝光华, 苏洁, 黄菲. 北极冬季季节性海冰双模态特征分析[J]. 海洋学报, 2015, 37(11): 11−22.Hao Guanghua, Su Jie, Huang Fei. Analysis of the dual-mode feature of Arctic seasonal sea ice[J]. Haiyang Xuebao, 2015, 37(11): 11−22. -


计量
- 文章访问数: 623
- HTML全文浏览量: 273
- PDF下载量: 76
- 被引次数: 0
