

An assessment of North Pacific interdecadal climate change simulations using the FIO-ESM v2.0
-
摘要: 数值模拟方法在研究长时间的气候变化上扮演着重要角色。一直以来,数值模式模拟年代际气候变化如太平洋年代际震荡(PDO)的位相转换存在巨大挑战。本文利用自然资源部第一海洋研究所研发的地球系统模式(First Institute of Oceanography-Earth System Model Version 2,FIO-ESM v2.0)145年(1870–2014年)历史气候模拟试验结果,结合再分析资料和另外两个地球系统模式结果,分析评估了该模式对太平洋年代际振荡的模拟能力。研究发现,FIO-ESM v2.0能够再现历史时期PDO的空间模态分布特征,其PDO指数具有10~30年的周期变化特征,同时于1960年以后能刻画出与再分析数据结果相近的PDO位相转变特征。研究表明,FIO-ESM v2.0能够较为准确地模拟出PDO的位相转变特征。另外,本文还评估了该模式对大气环流模态的模拟能力及其与PDO之间的关系,以及该模式模拟PDO的可能机制。该模式的PDO与大气环流的阿留申低压模态相关。进一步的分析表明,平流作用和热通量是关键年代际海域海温异常振幅的主要因素,而罗斯贝波西传时间则可能是影响PDO位相转变的关键因素。
-
关键词:
- FIO-ESM v2.0 /
- 太平洋年代际震荡 /
- 海气相互作用
Abstract: Numerical simulation play an important role in studying long-term climate change. For a long time, it has meted great challenges in characterizing the phase transitions of interdecadal climate changes like Pacific Decadal Oscillation (PDO). This study evaluates 145-year (1870–2014) historical PDO simulation results produced by the First Institute of Oceanography’s Earth System Model Version 2 (FIO-ESM v2.0) of Ministry of Natural Resources, in a comparison with reanalysis datasets and two other earth system model results. Results indicate that the FIO-ESM v2.0 can recreate the spatial modal distribution characteristics of the PDO from the historical period. The model’s PDO index has a period of 10 to 30 years and can describe the phase transition characteristics that resembles reanalysis datasets after 1960. Research shows that the FIO-ESM v2.0 can describe the phase transition features of PDO well. In addition, the model performance to simulate atmospheric circulation modes and relationship with PDO, as well as the possible mechanism for the model to simulate PDO are also discussed. The PDO of the model is related to the Aleutian Mode of atmospheric circulation. Further analysis shows that advection and heat flux are the main factors affecting the amplitude of SST anomalies in key decadal area, and the Rossby wave westward time may be the key factor affecting the phase transition of PDO.-
Key words:
- FIO-ESM v2.0 /
- Pacific Decadal Oscillation /
- air-sea interactions
-
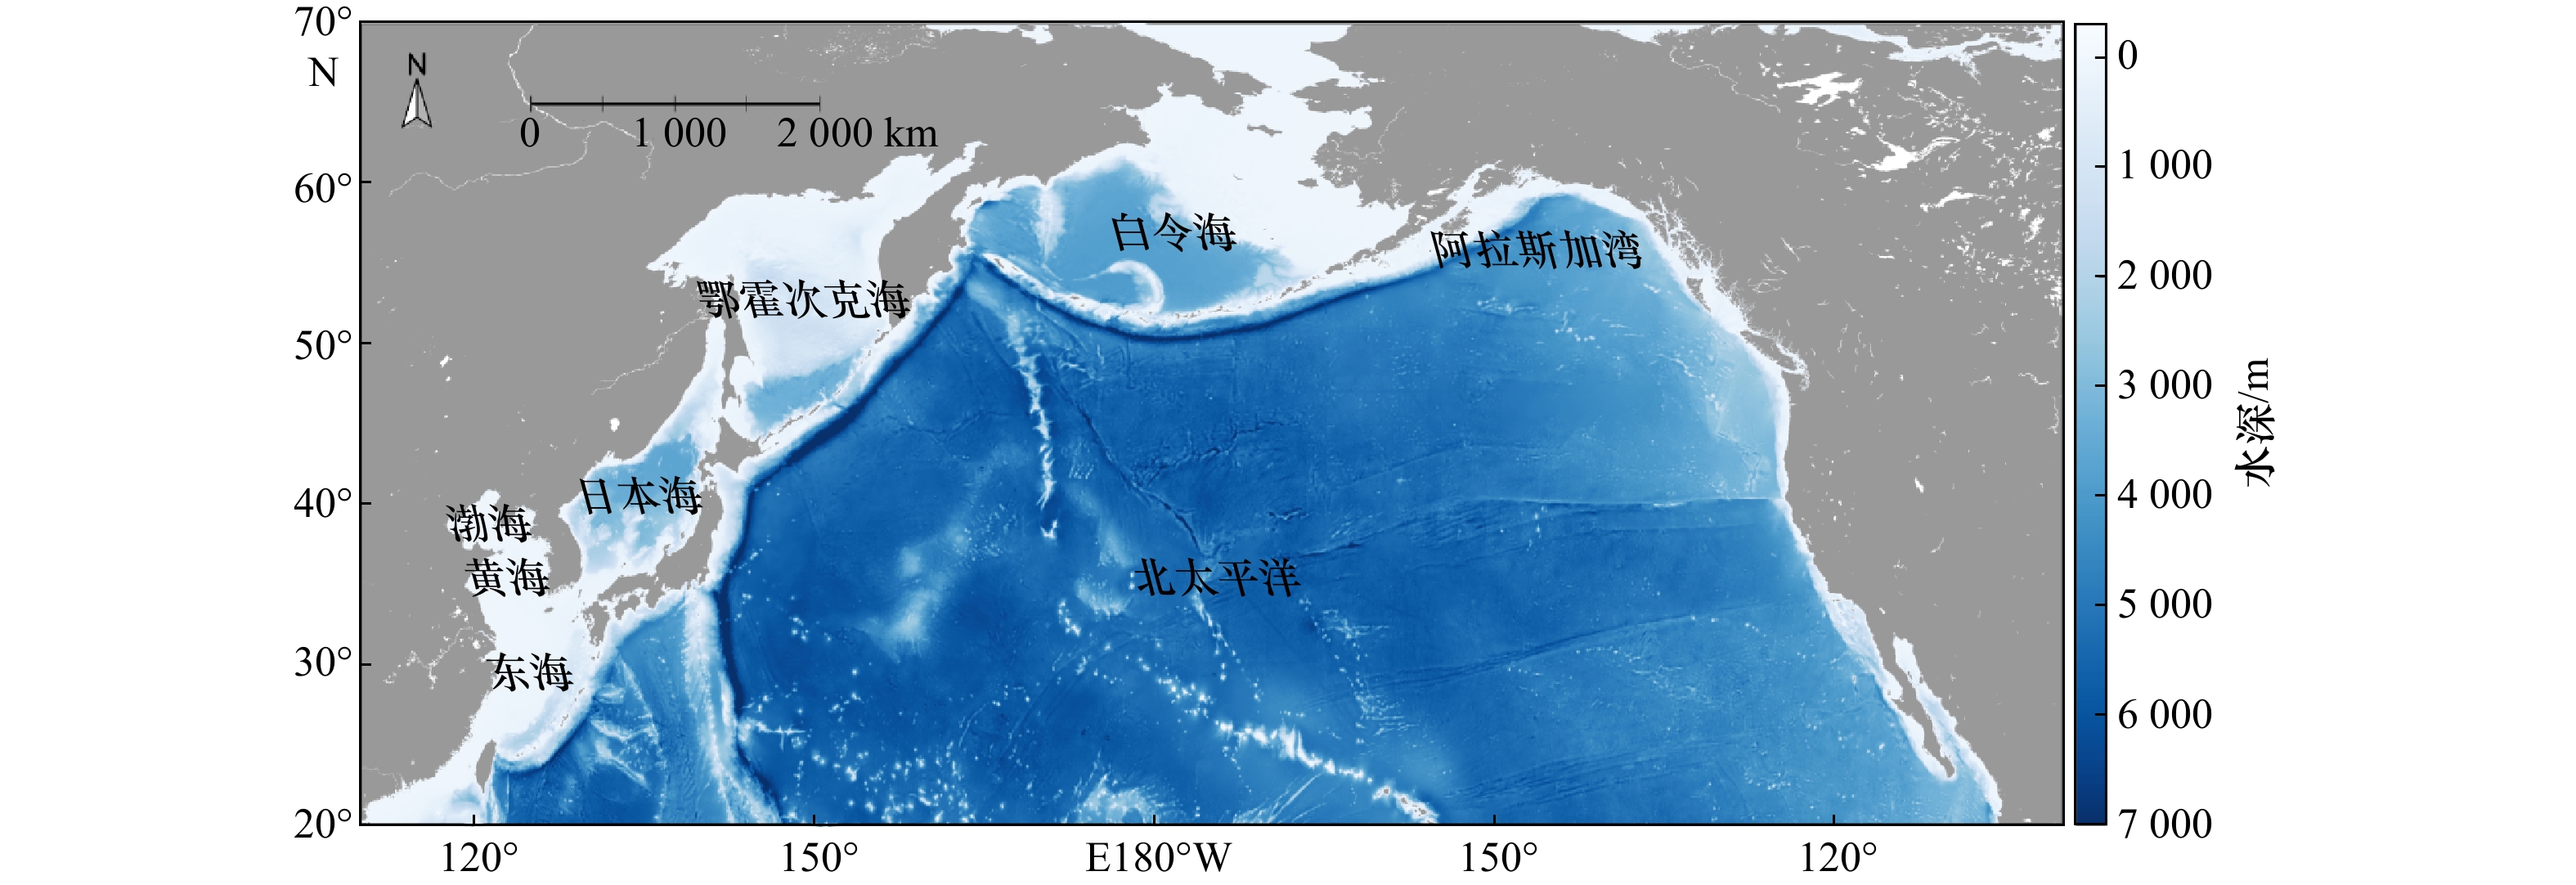
图 1 北太平洋海域水深
数据来自ETOPO2
Fig. 1 The water depth map of the North Pacific Ocean
The data comes from ETOPO2
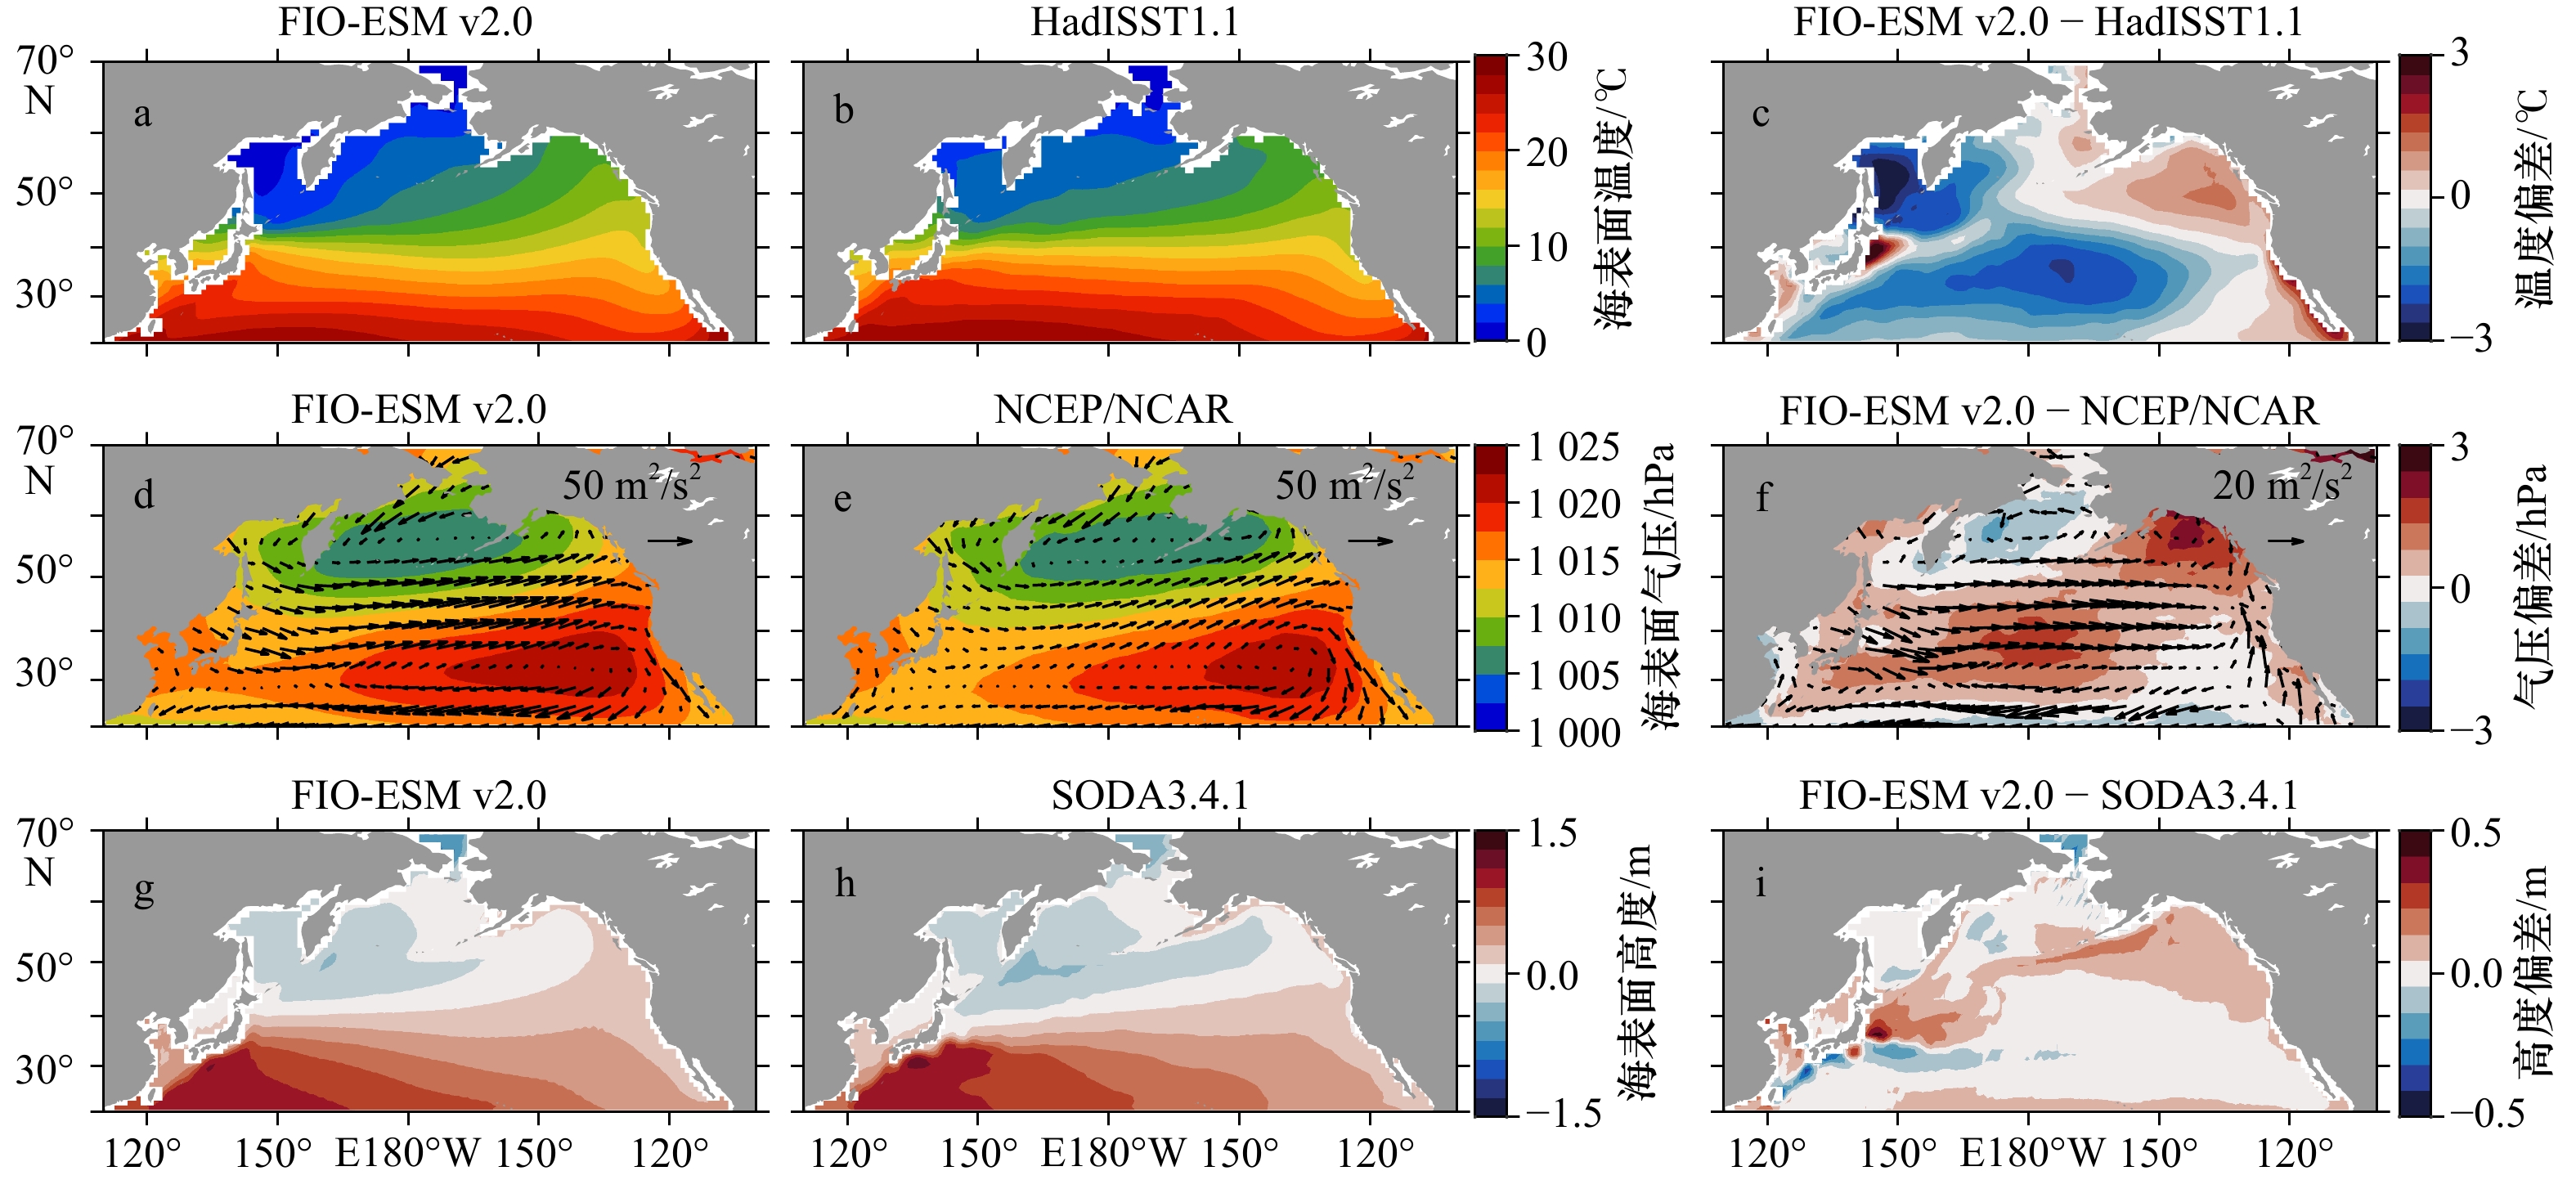
图 2 FIO-ESM v2.0模拟的和再分析数据的海表面温度(a,b)、海平面气压和海表面风应力(d,e)、海表面高度(g,h)1981−2010年气候态年平均空间分布以及两者的偏差分布(c,f,i)
Fig. 2 FIO-ESM v2.0 simulated and reanalysis data’s, annual average spatial distribution of climate states from 1981 to 2010 of theirs sea surface temperature (a, b), sea level pressure and sea surface wind stress (d, e), sea surface height (g, h), and, as well as theirs deviation distributions (c, f, i)
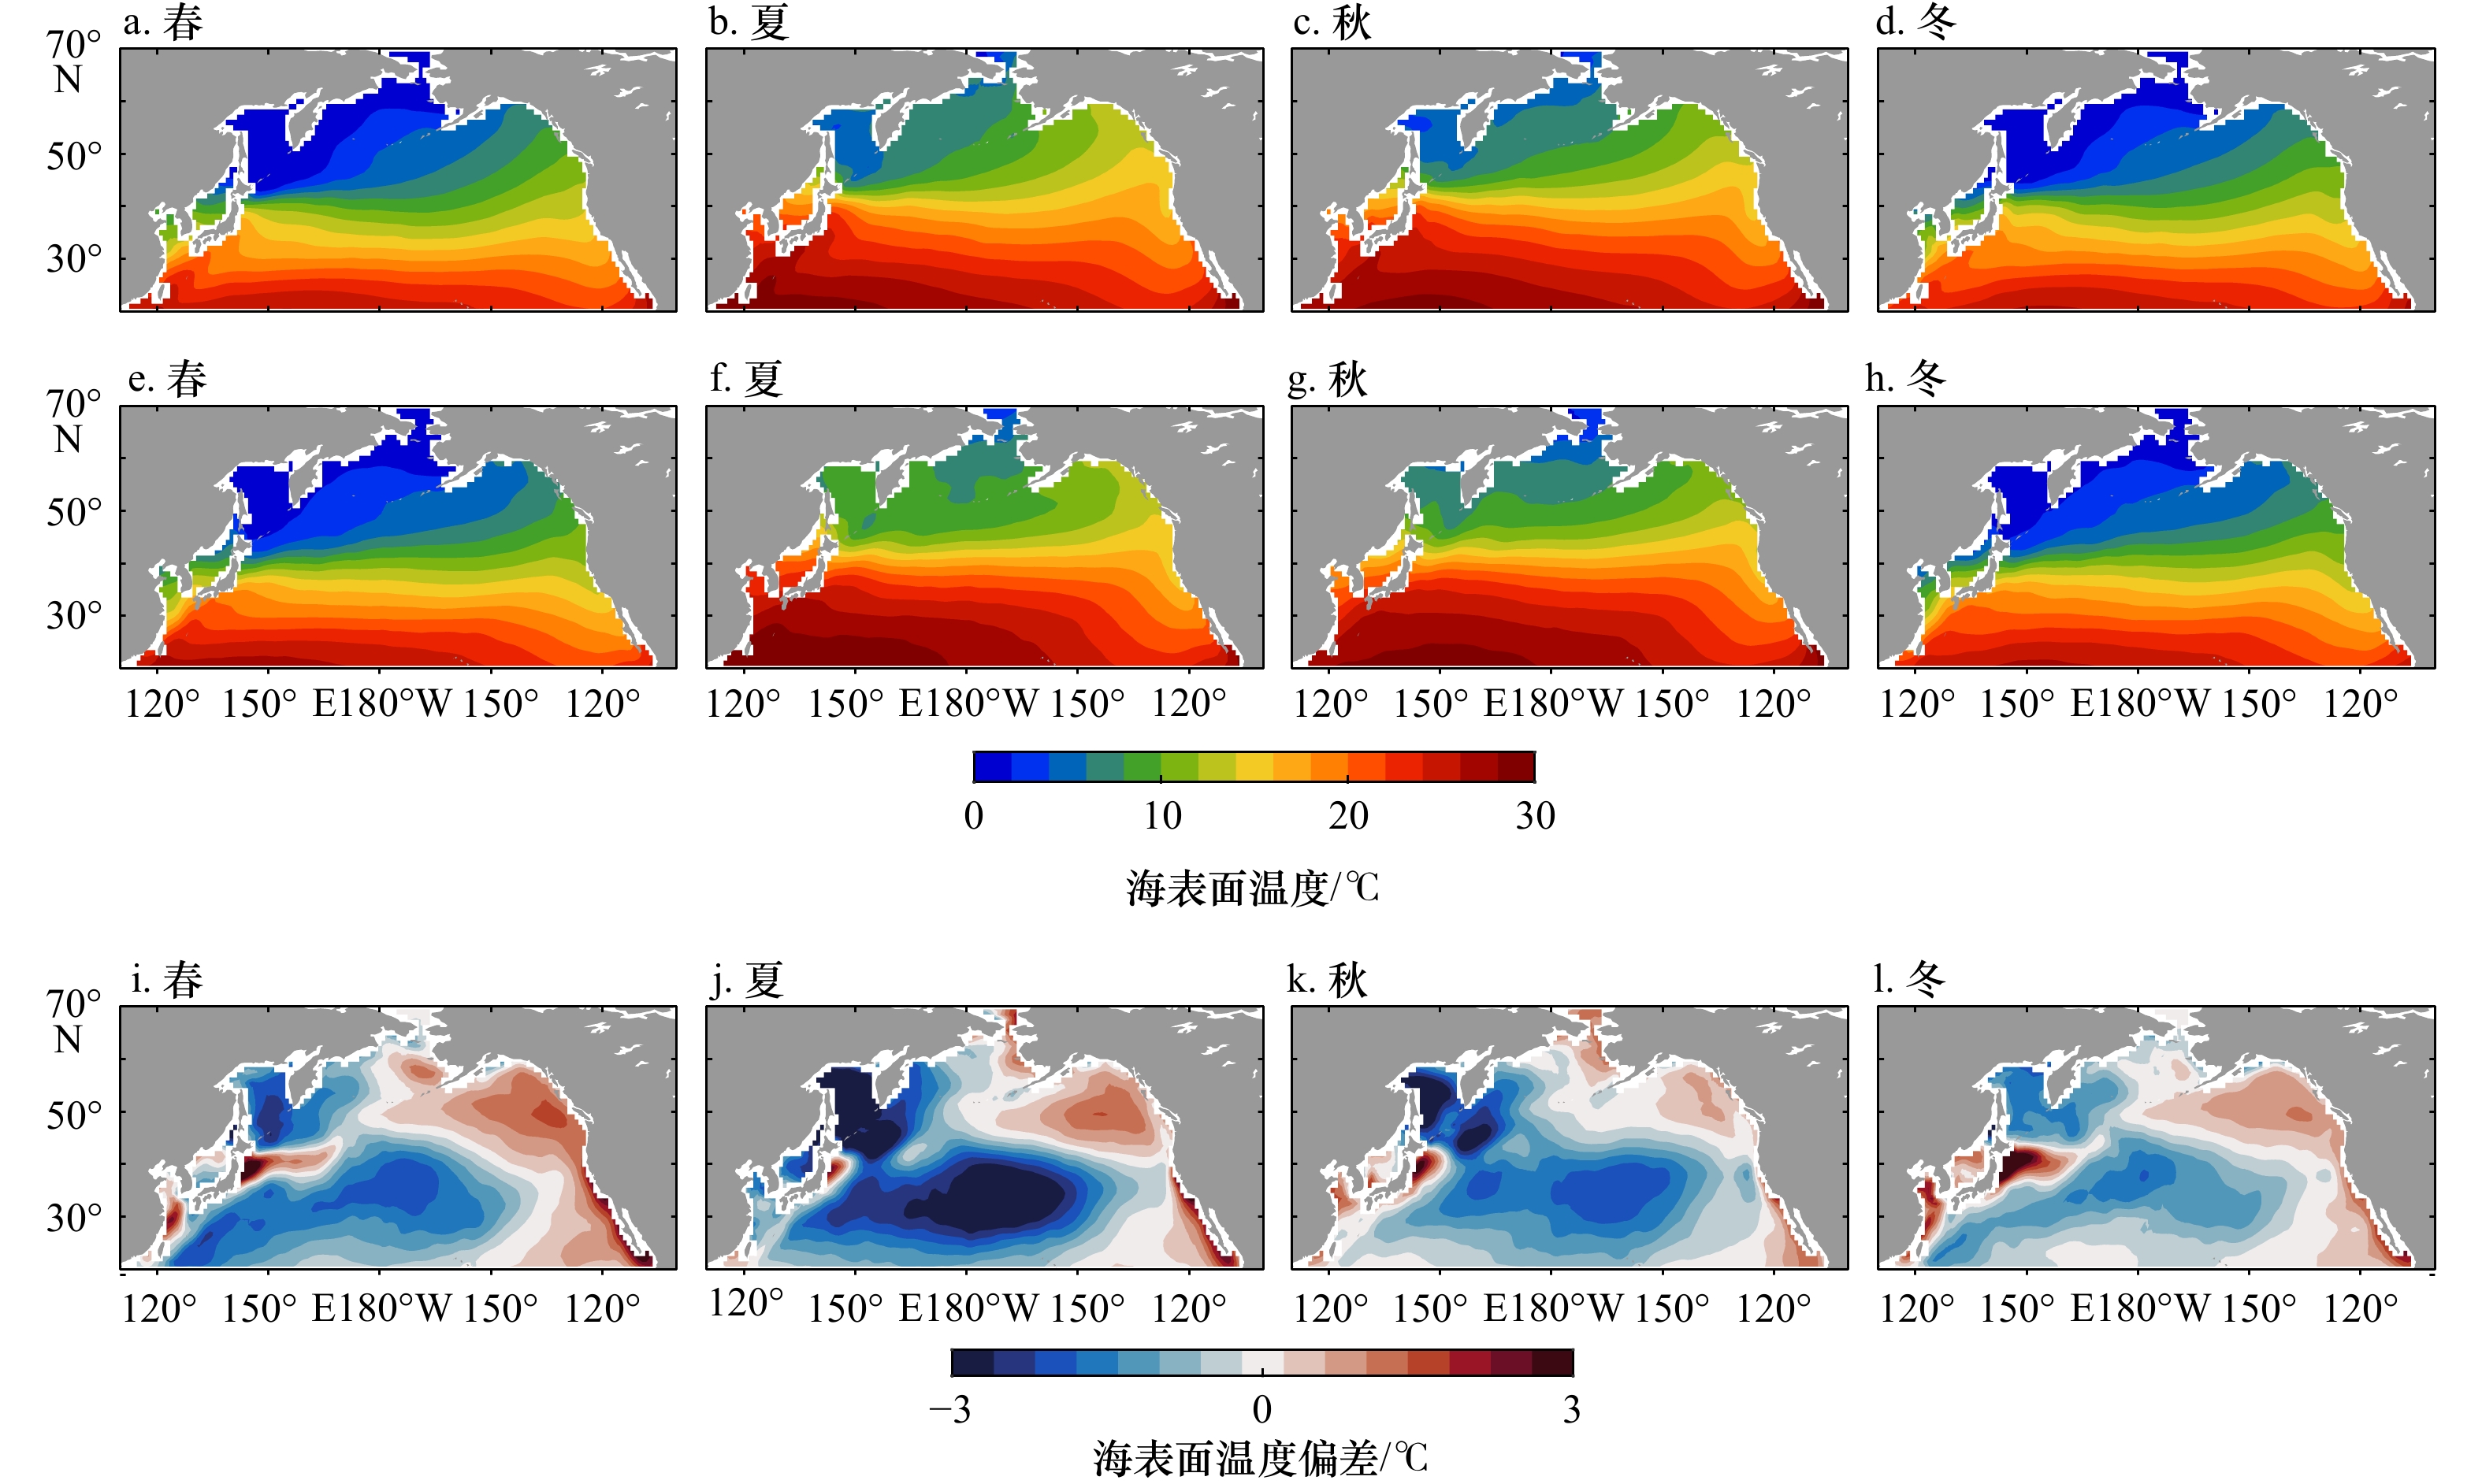
图 3 FIO-ESM v2.0模拟(a−d)与HadISST再分析数据(e−h)的海表面温度春、夏、秋和冬季的空间分布及偏差(i−l)
Fig. 3 Spatial distribution and deviation (i−l) of sea surface temperature in spring, summer, autumn, and winter using FIO-ESM v2.0 (a−d) and HadISST reanalysis data (e−h)
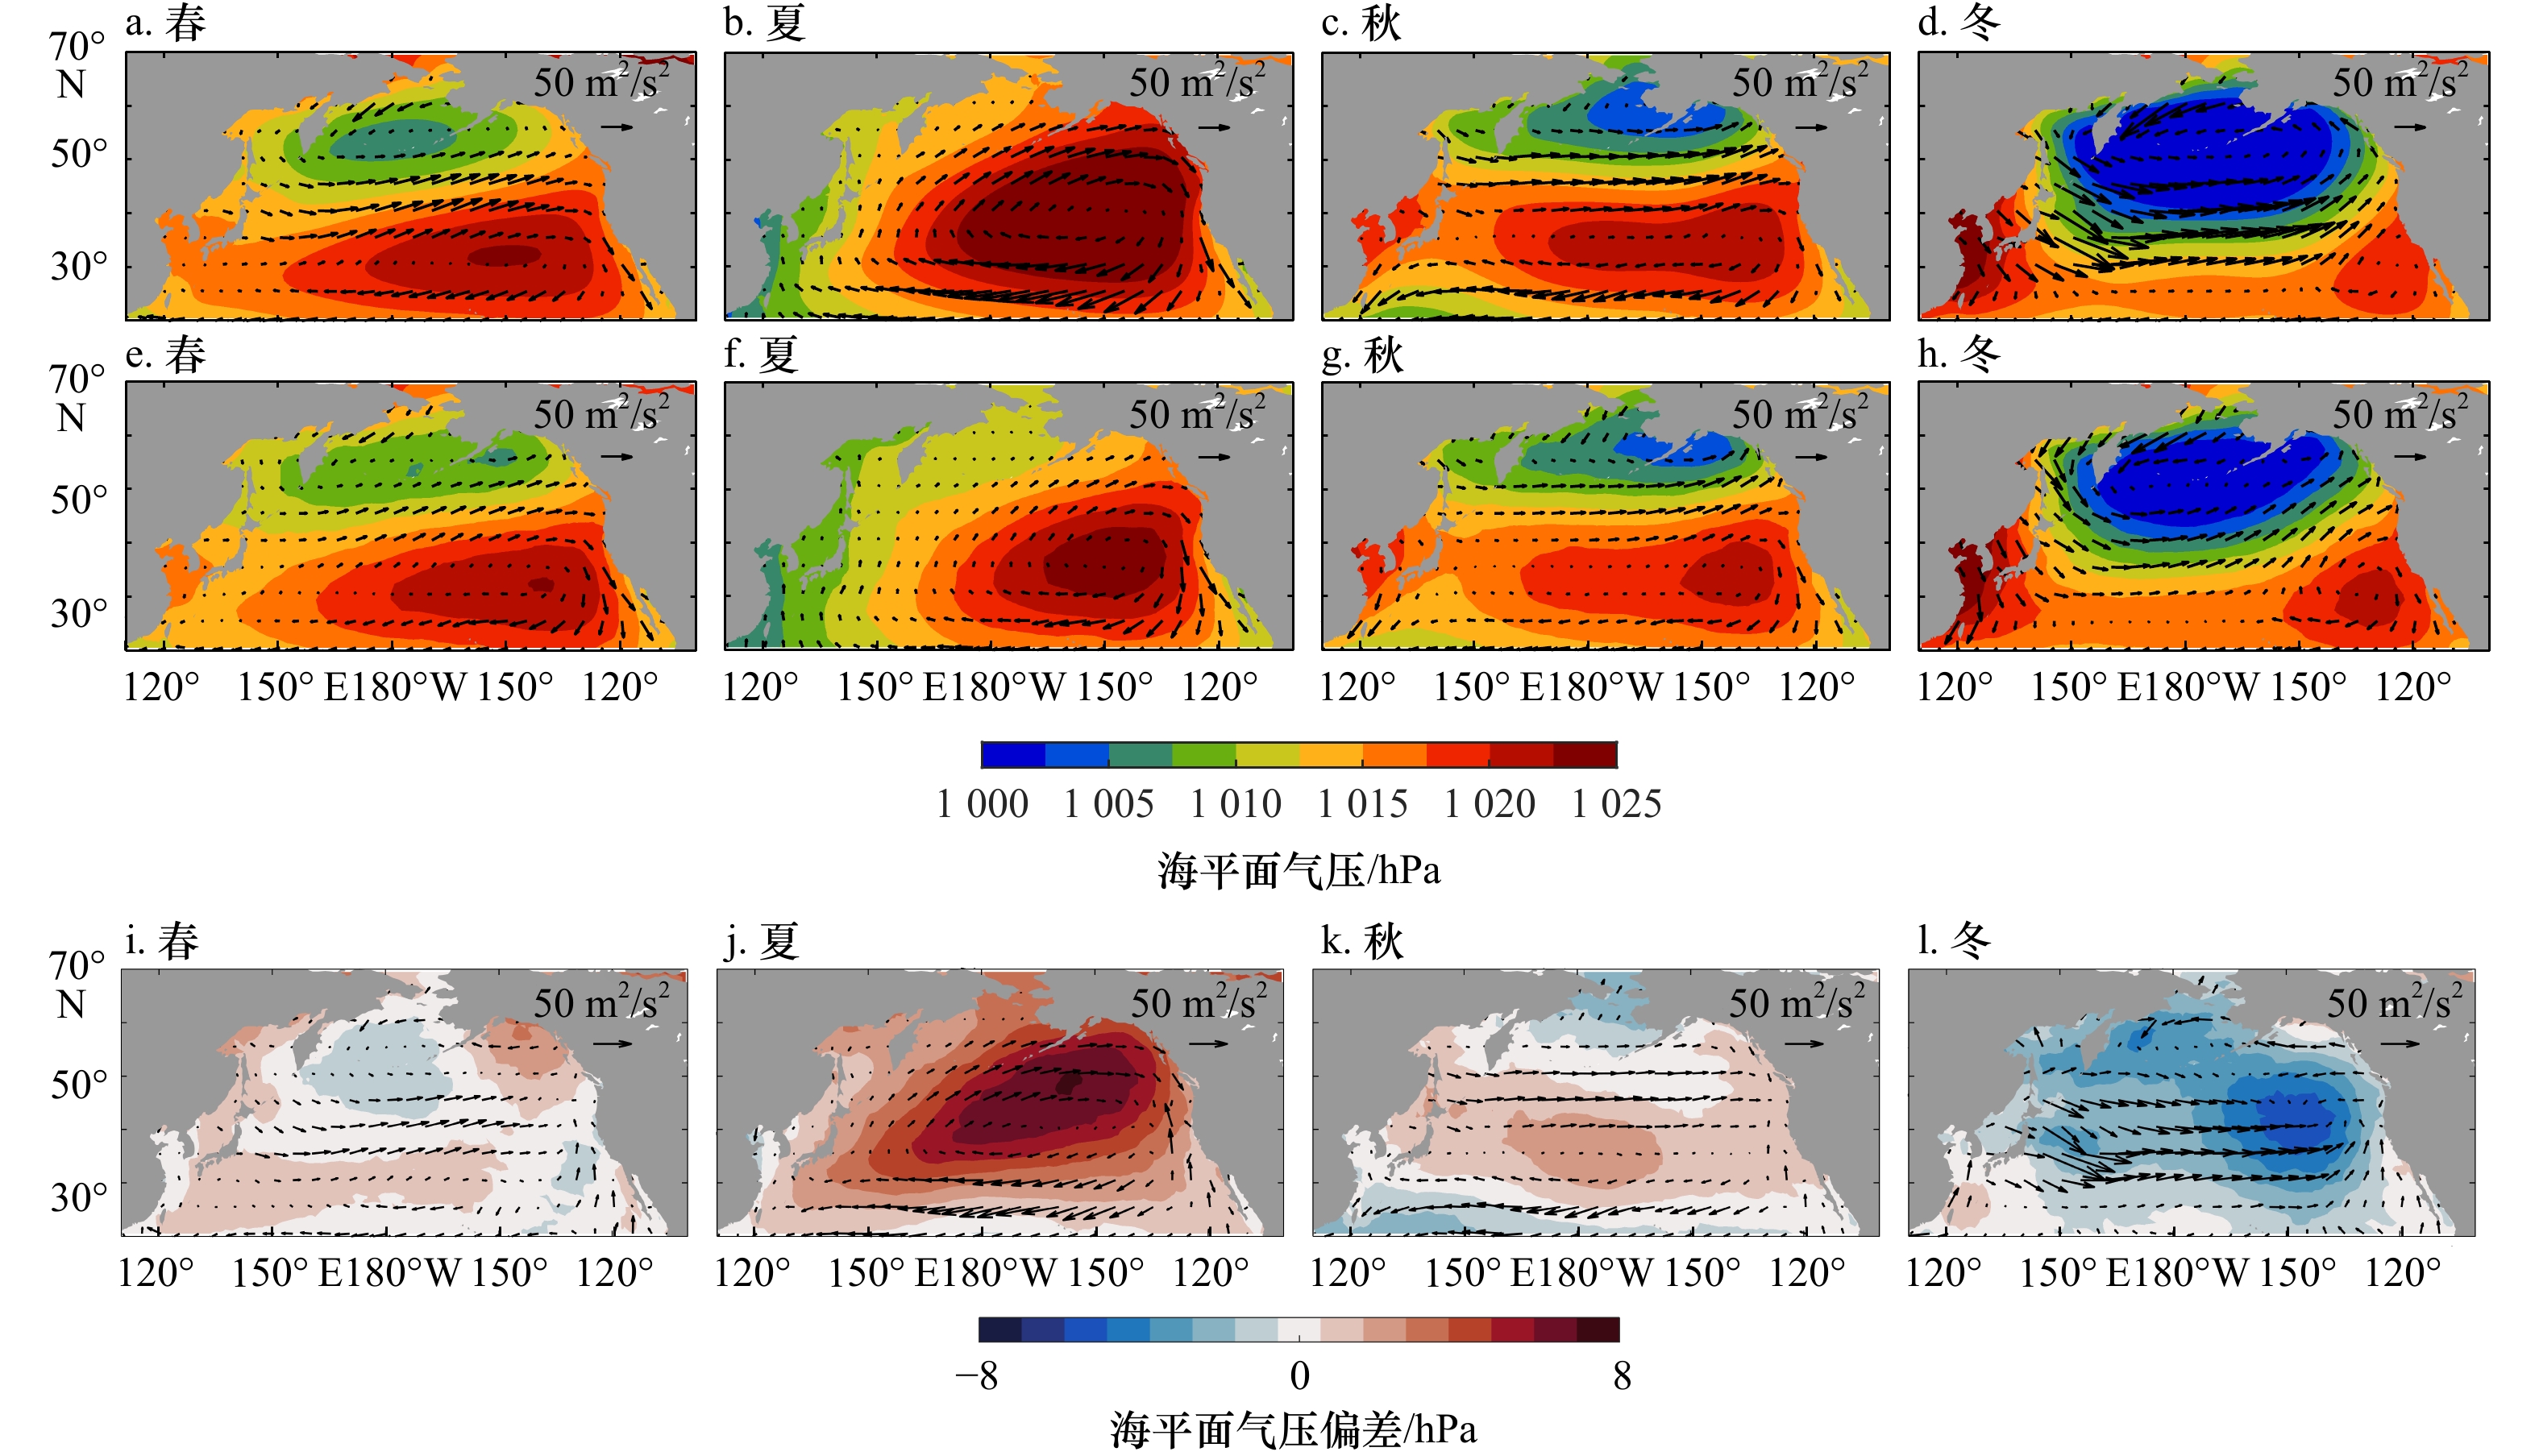
图 4 FIO-ESM v2.0模拟(a−d)与NCEP/NCAR再分析数据集(e−h)的海平面气压和风应力春、夏、秋和冬季的空间分布及偏差(i−l)
Fig. 4 Spatial distribution of sea level pressure and wind stress in spring, summer, autumn, and winter using FIO-ESM v2.0 (a−d) and NCEP/NCAR reanalysis dataset (e−h) and deviation (i−l)
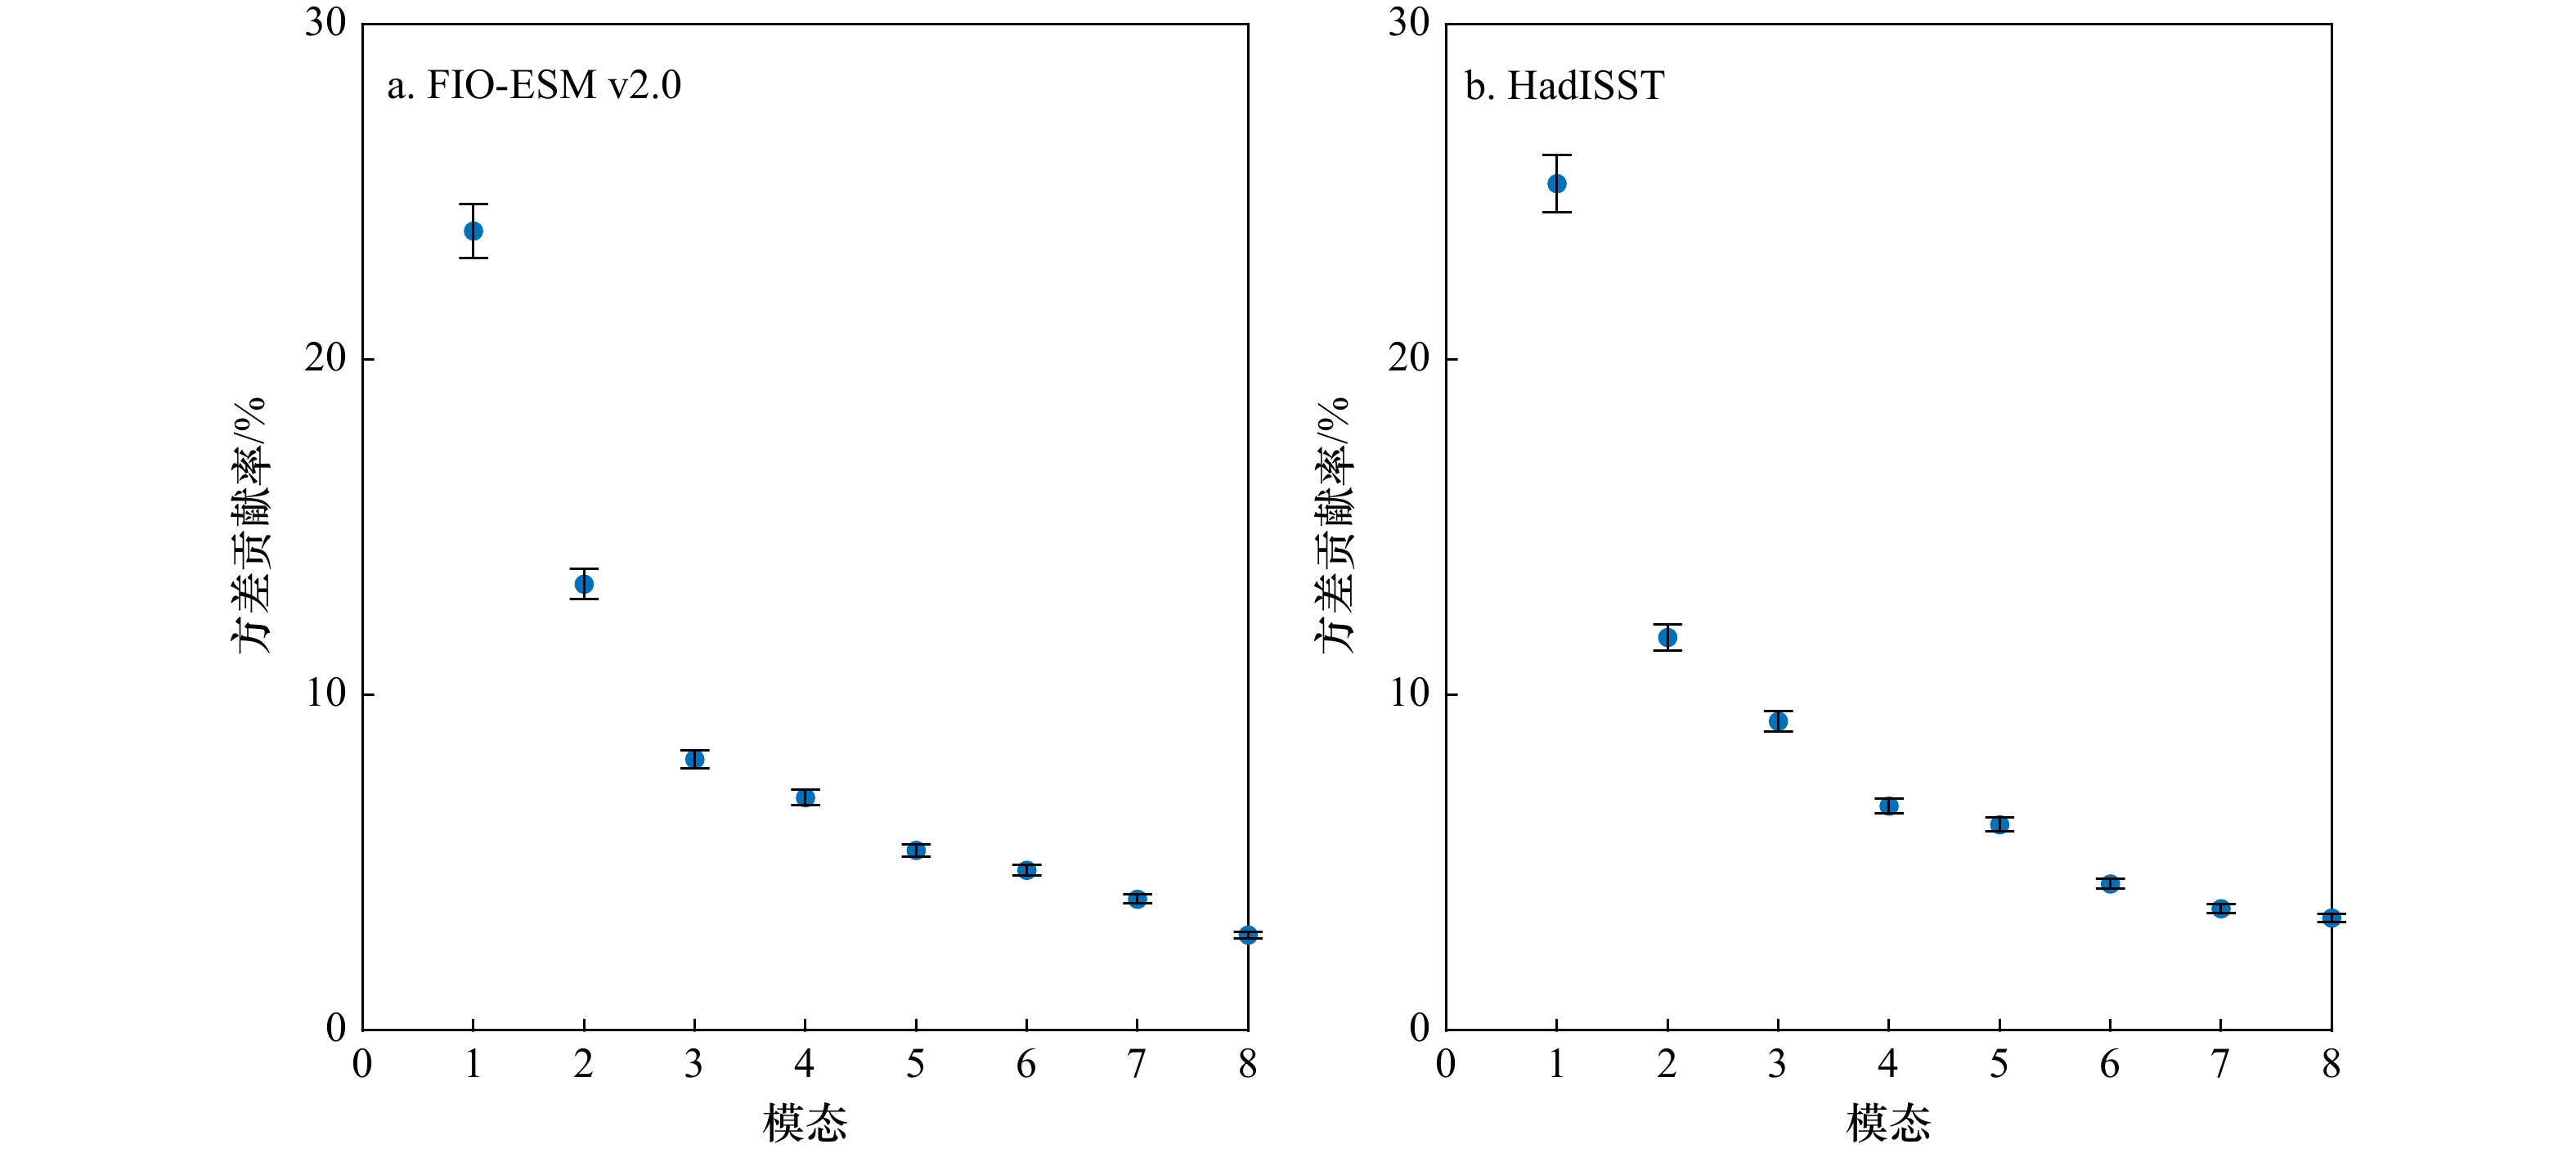
图 5 FIO-ESM v2.0模拟(a)与HadISST再分析数据(b)的海表面温度异常经过EOF分解的前8个模态的方差贡献率(蓝色散点)及North检验取样误差(黑色竖线)
Fig. 5 Variance contribution rate (blue dots) and sampling error (black vertical lines) of the first eight EOF modes in North’s test of sea surface temperature anomaly for the FIO-ESM v2.0 model (a) and HadISST reanalysis dataset (b)
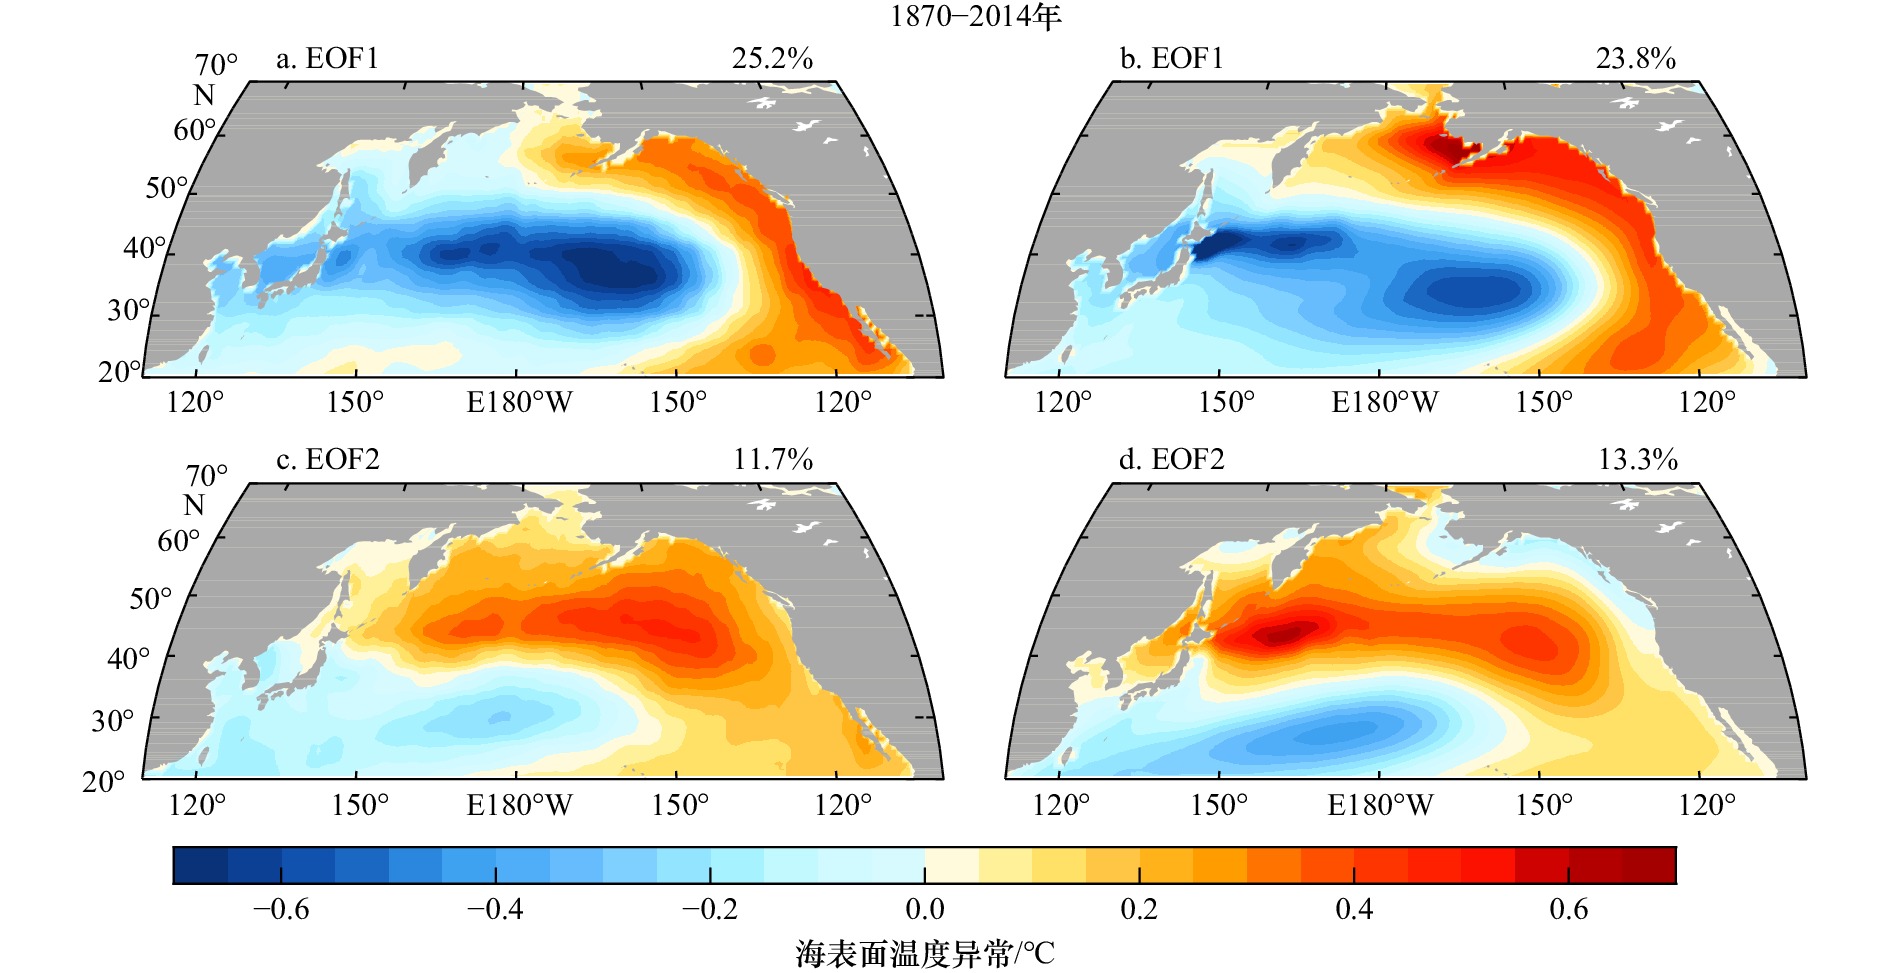
图 6 HadISST再分析数据的海表温度异常经过EOF分解的第一空间模态(a)、第二空间模态(c)和FIO-ESM v2.0模拟的海表温度异常经过EOF分解的第一空间模态(b)、第二空间模态(d)
子图右上角的数值为方差贡献率
Fig. 6 The first special modes (a) and second special modes (c) of sea surface temperature anomaly for HadISST reanalysis dataset after EOF decomposition and the first special modes (b) and second special modes (d) of sea surface temperature anomaly simulated by FIO-ESM v2.0 after EOF decomposition
The value in the upper right corner of the subgraph is the variance contribution rate

图 7 FGOALS-g3模式模拟的海表温度异常经过EOF分解的第一空间模态(a)、第二空间模态(c)和CESM2模式模拟的海表温度异常经过EOF分解的第一空间模态(b)、第二空间模态(d)
子图右上角的数值为方差贡献率
Fig. 7 The first special modes (a) and second special modes (c) of sea surface temperature anomaly simulated by FGOALS-g3 model after EOF decomposition and the first special modes (b) and second special modes (d) of sea surface temperature anomaly simulated by CESM2 model after EOF decomposition
The value in the upper right corner of the subgraph is the variance contribution rate
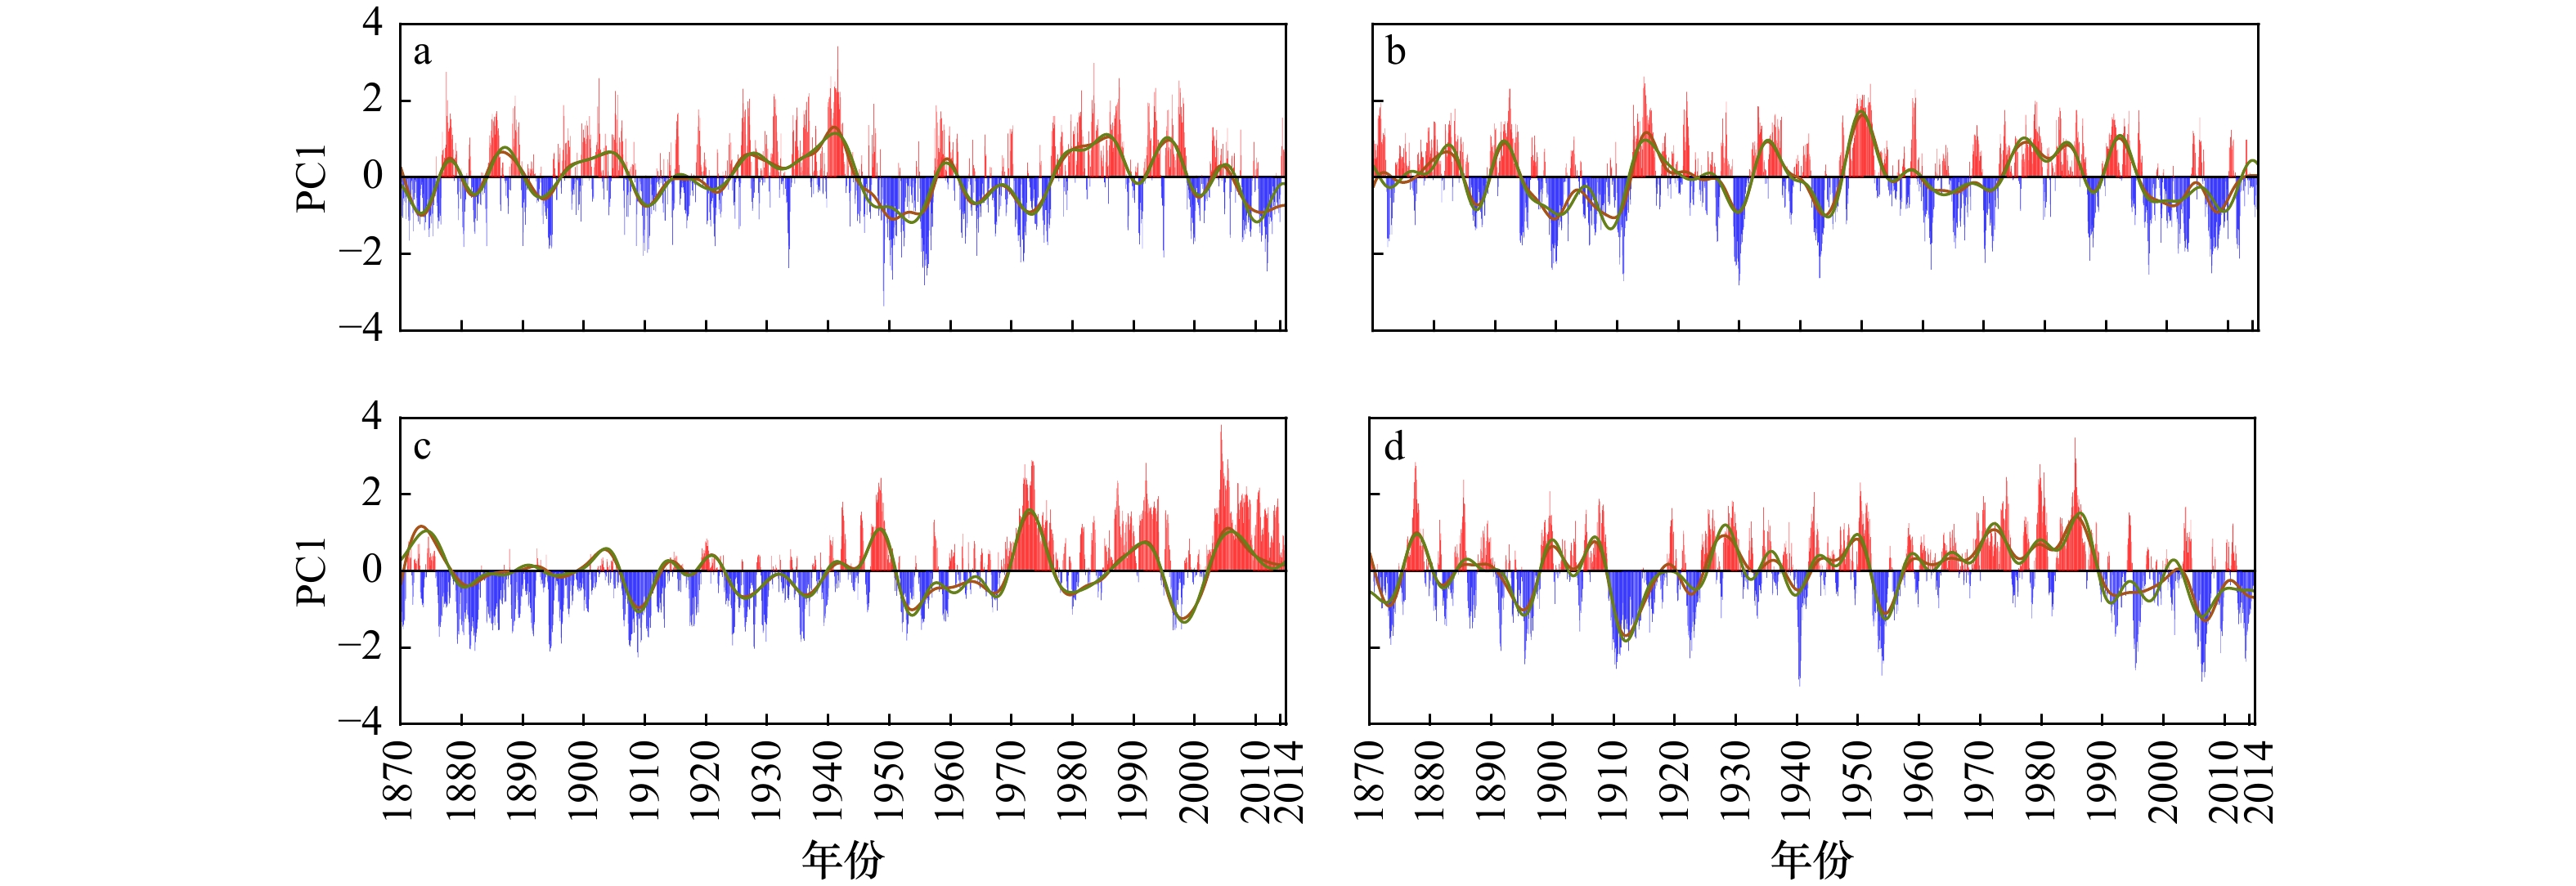
图 8 HadISST再分析数据(a)、FIO-ESM v2.0(b)、FGOALS-g3模式(c)和CESM2模式(d)计算的PDO指数
图中绿色实线为通过傅里叶变换进行7年低通滤波的结果,红色和蓝色柱状分别代表PDO指数的正值和负值,红色实线为通过4阶巴特沃斯进行7年低通滤波的结果
Fig. 8 The PDO indexes of HadISST reanalysis dataset (a), FIO-ESM v2.0 (b), FGOALS-g3 model (c) and CESM2 model (d)
The green solid line in the figure is the result of 7-year low-pass filtering by Fourier transform, the red and blue bars respectively represent positive and negative values of the PDO index, the red solid line is the result of 7-year low-pass filtering by 4-order Butterworth
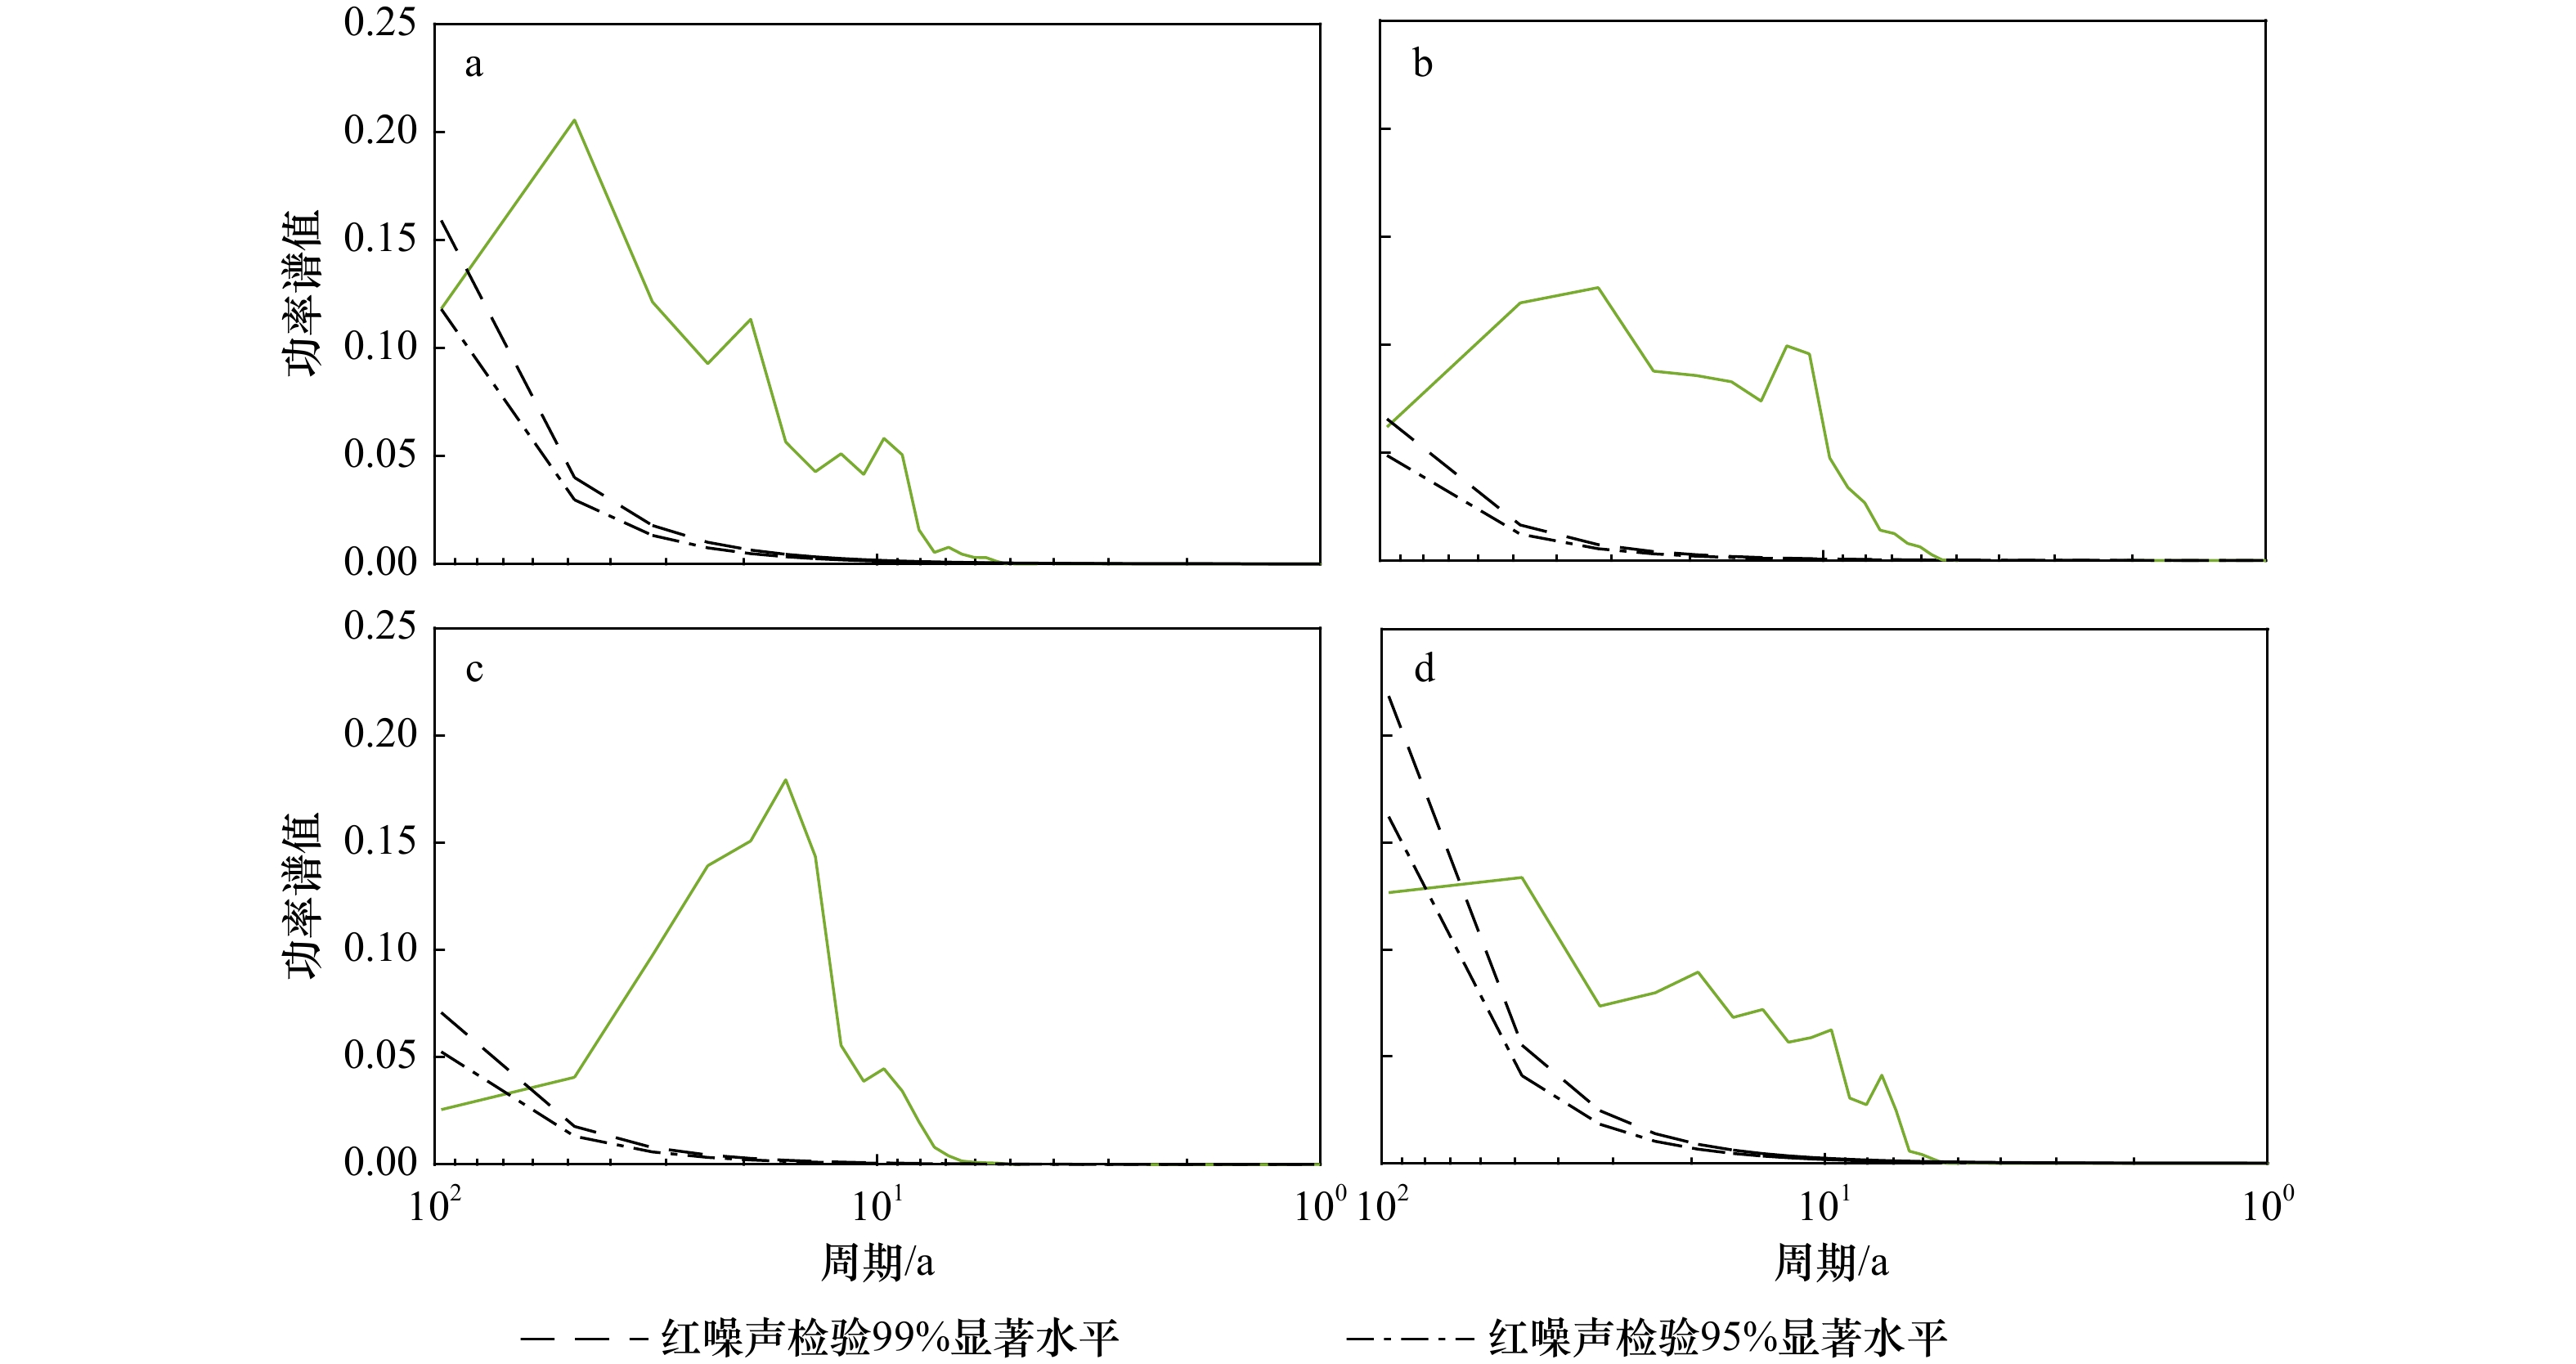
图 9 HadISST再分析数据集(a)、FIO−ESM v2.0(b)、FGOALS-g3模式(c)和CESM2模式(d)PDO指数的功率谱值
Fig. 9 The power spectra of the PDO index for HadISST reanalysis dataset (a), FIO-ESM v2.0 (b), FGOALS-g3 model (c) and CESM2 model (d)

图 10 HadISST再分析数据(a)、FIO-ESM v2.0(b)、FGOALS-g3模式(c)和CESM2模式(d)PDO指数的滑动t检验图
蓝色实线为滑动t检验统计量,红色虚线为显著性水平
Fig. 10 The moving t-test graphs of the PDO index for HadISST reanalysis dataset (a), FIO-ESM v2.0 model (b), FGOALS-g3 model (c) and CESM2 model (d)
The solid blue line is the moving t-test statistic, the dotted red line is the significance level
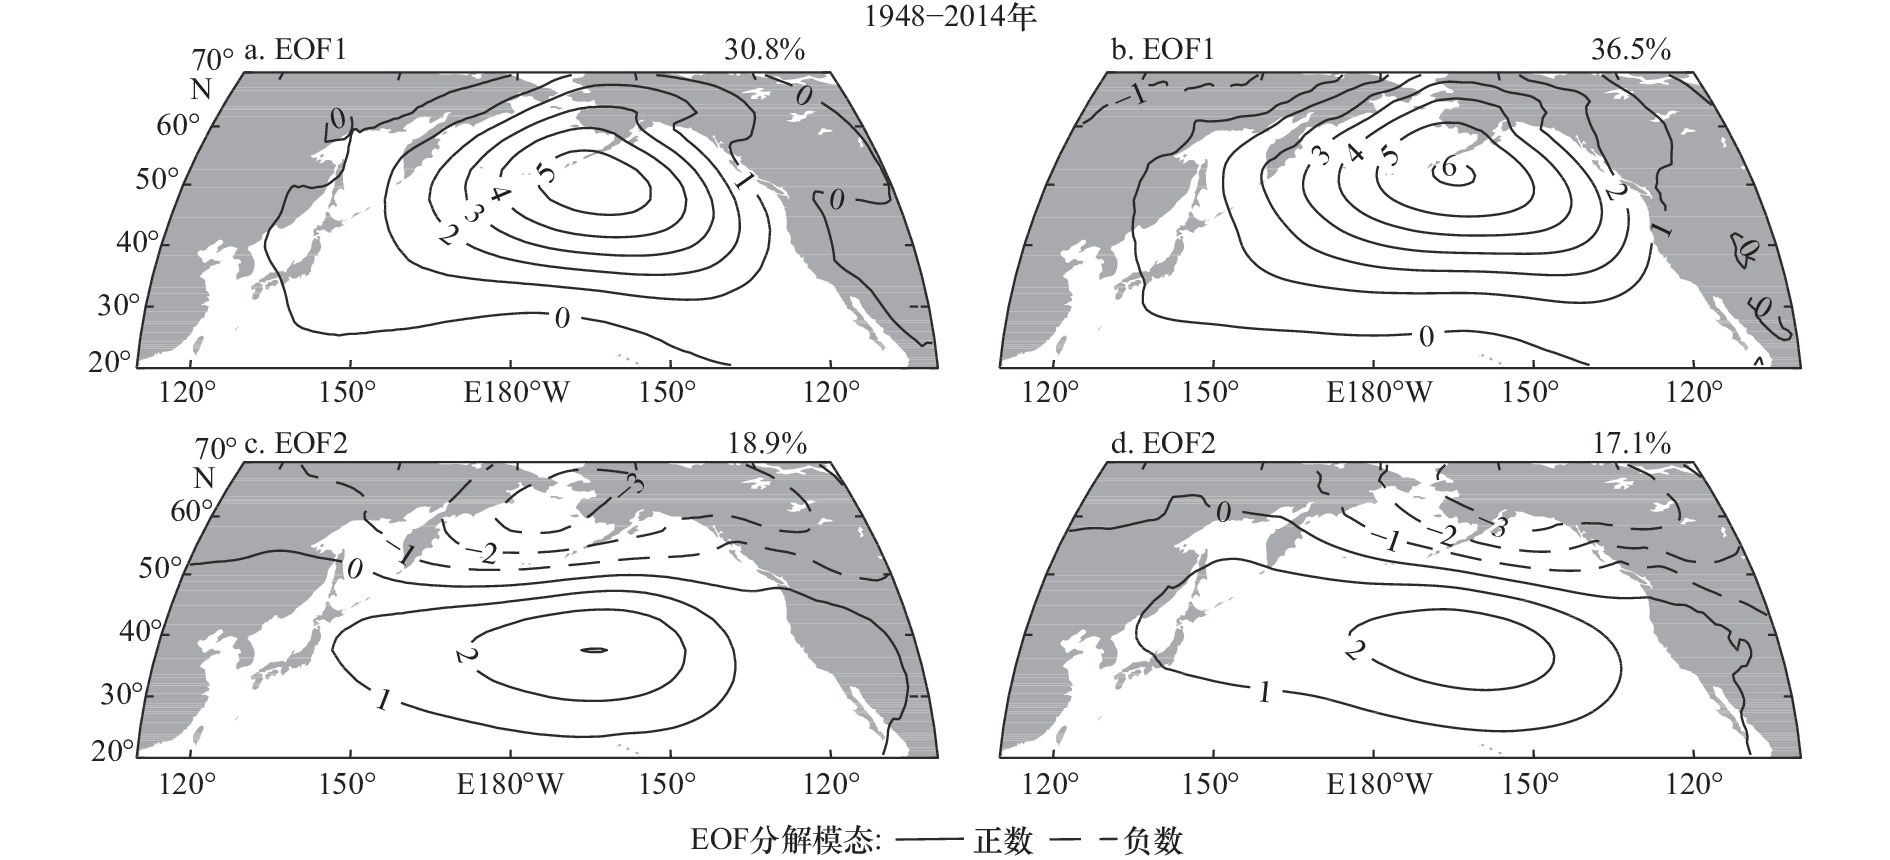
图 11 NCEP/NCAR再分析数据集海平面气压异常经过EOF分解的第一空间模态(a)、第二空间模态(c)和FIO-ESM v2.0模拟的海平面气压异常的第一空间模态(b)、第二空间模态(d)
子图右上角的数值为方差贡献率
Fig. 11 The first special modes (a) and second special modes (c) of sea level pressure anomaly for NCEP/NCAR reanalysis dataset after EOF decomposition and the first special modes (b), second special modes (d) of sea surface temperature anomaly simulated by the FIO-ESM v2.0 after EOF decomposition
The value in the upper right corner of the subgraph is the variance contribution rate
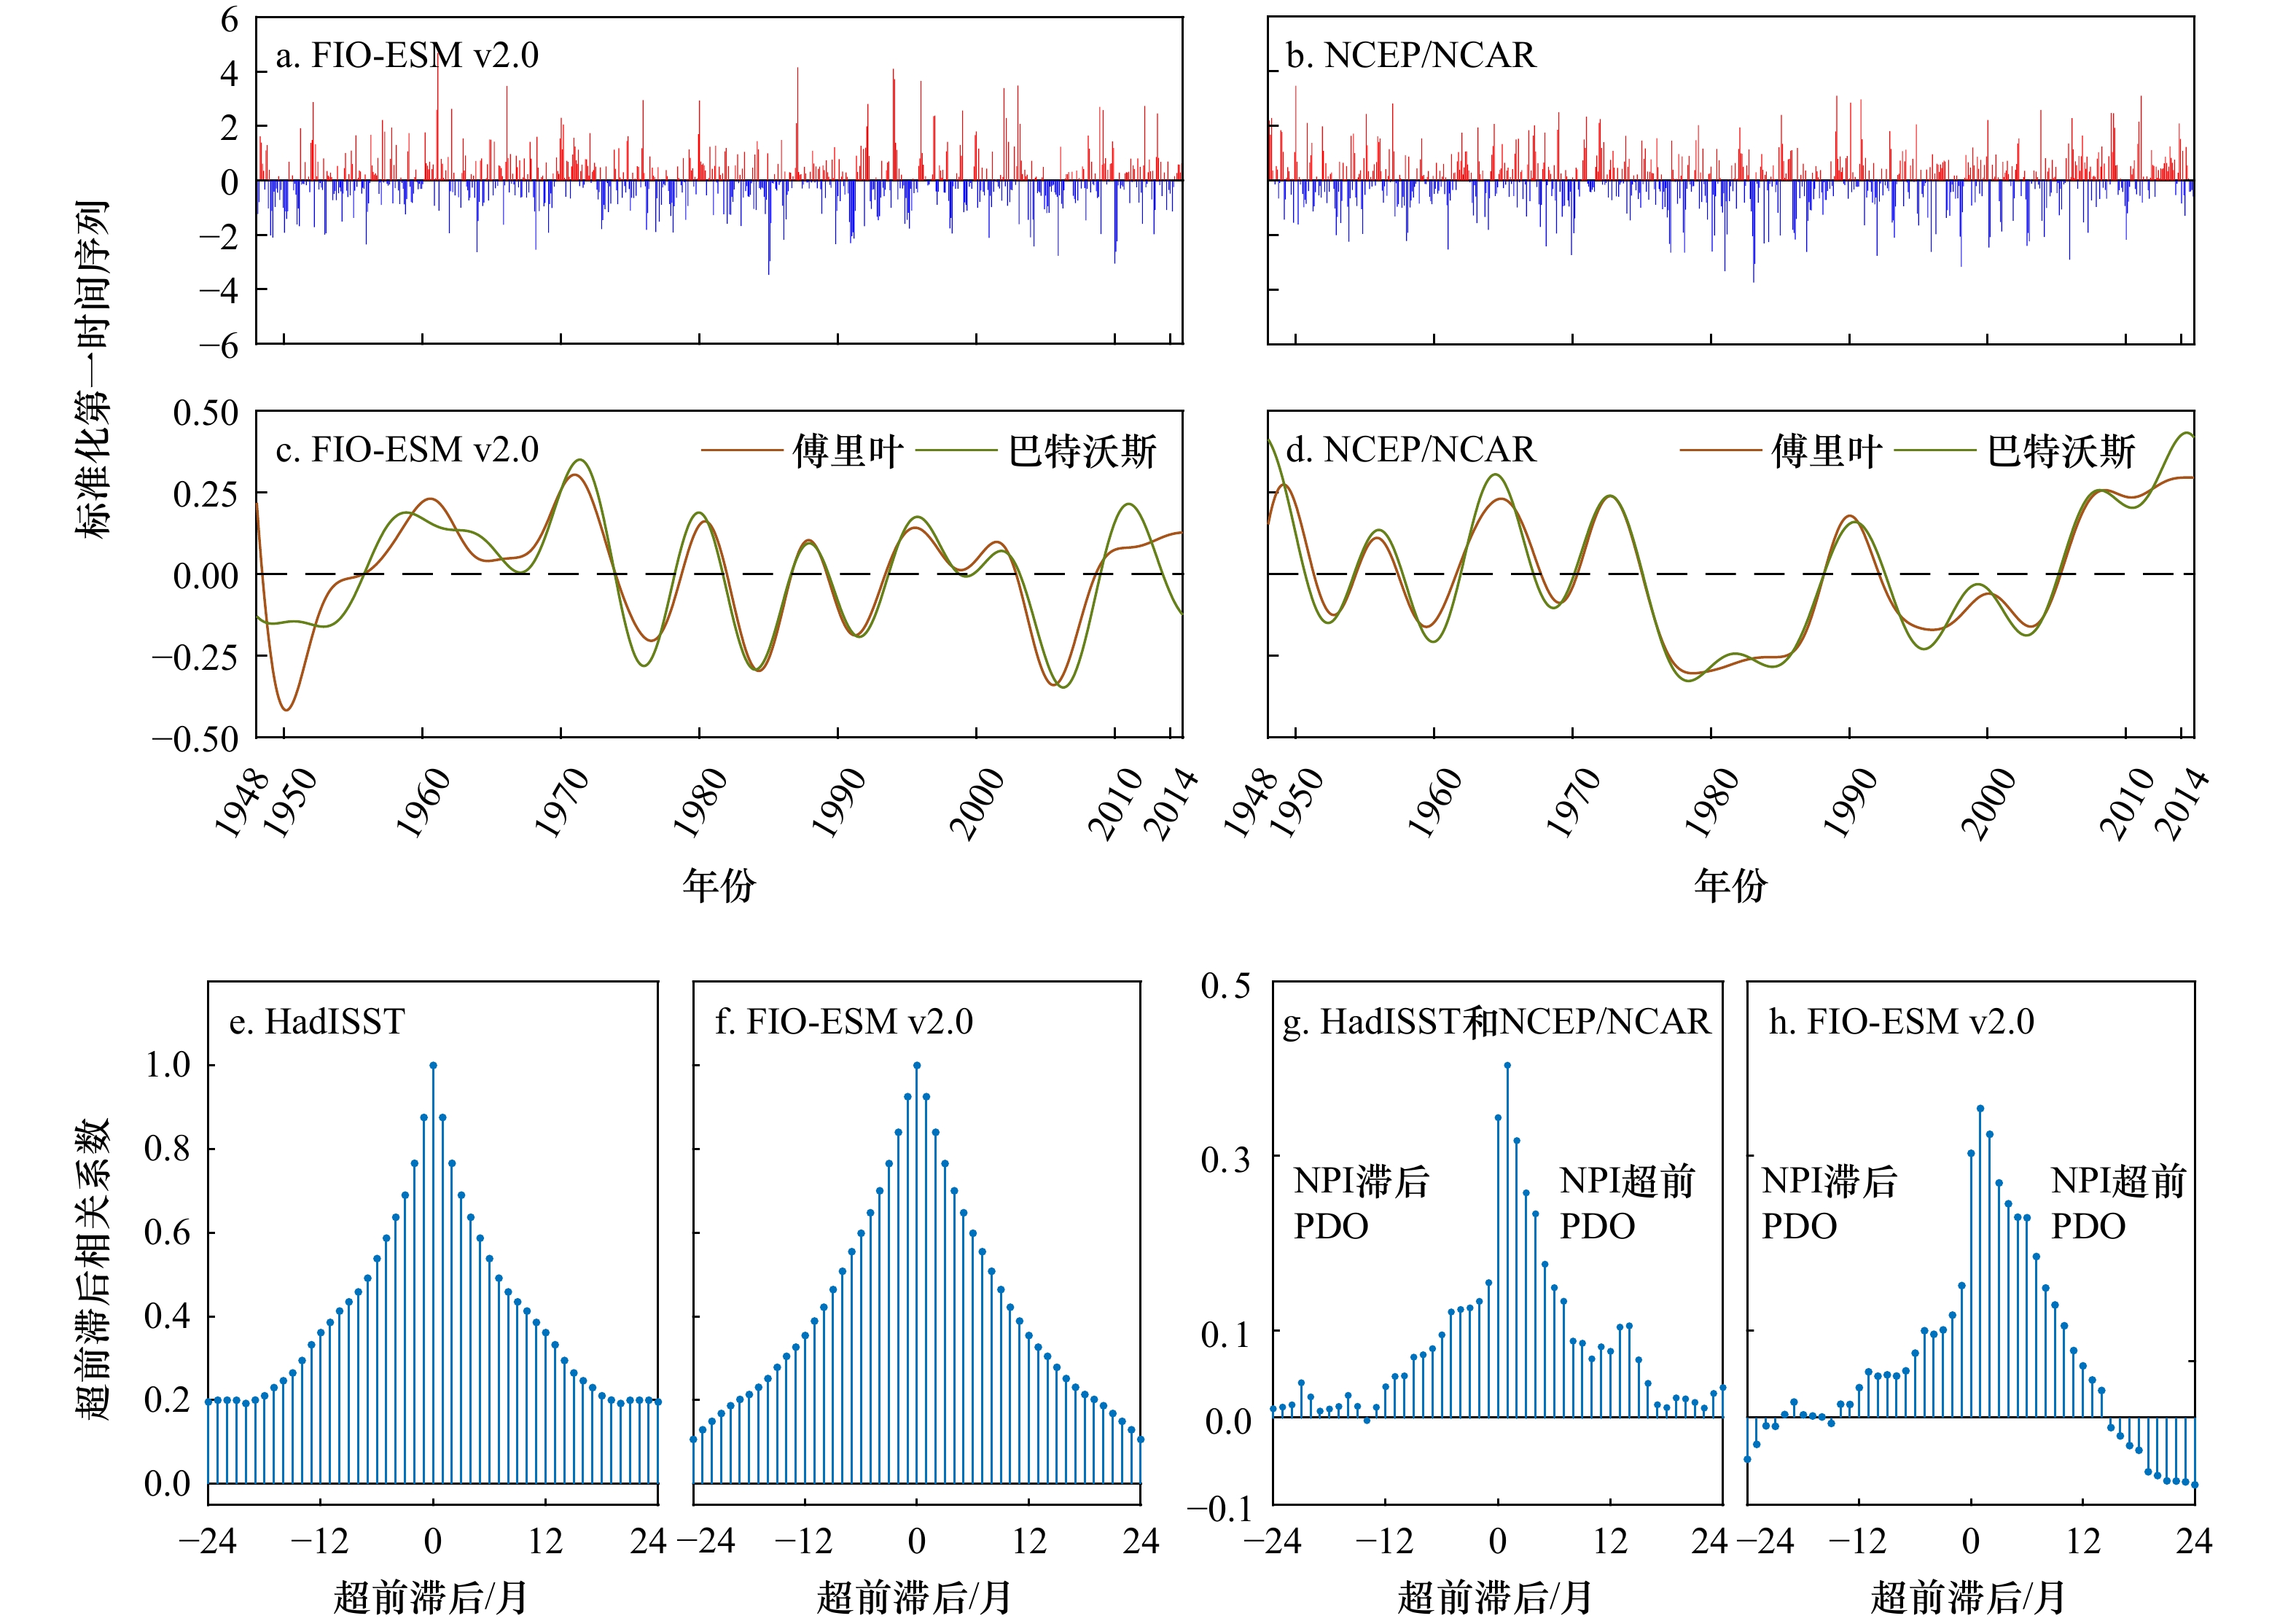
图 12 FIO-ESM v2.0和再分析数据的AL模态、PDO指数和NPI的时间序列分析
a、b为FIO-ESM v2.0和NCEP/NCAR再分析数据集的AL 模态时间序列分析;c、d为时间序列经过7年滤波的结果;e、f为HadISST再分析数据集和FIO-ESM v2.0的PDO指数自相关系数分析;g、h为再分析数据(HadISST和NCEP/NCAR)和FIO-ESM v2.0的PDO指数和NPI的超前滞后相关系数分析;相关系数均通过95%置信度
Fig. 12 Time series analysis of AL mode, PDO index, and NPI between FIO-ESM v2.0 and reanalysis data
Fig. a and Fig. b are the AL modal time series analysis between FIO-ESM v2.0 and NCEP/NCAR reanalysis datasets; Fig. c and Fig. d are the result of a 7-year filtering of the time series; Fig. e and Fig. f are the PDO index autocorrelation coefficient analysis between HadISST reanalysis dataset and FIO-ESM v2.0; Fig. g and Fig. h are the analysis of the lag correlation coefficients of the PDO index and NPI, between the reanalysis data (HadISST and NCEP/NCAR) and FIO-ESM v2.0; the correlation coefficients all pass the 95% confidence level

图 13 再分析数据集和FIO-ESM v2.0的海平面气压异常和风应力异常回归于PDO指数上的回归系数
a和c为NCEP/NCAR再分析数据集海平面气压异常和风应力异常回归于HadISST再分析数据PDO指数的回归系数图;b和d为FIO-ESM v2.0模拟的海平面气压异常和风应力异常回归于FIO-ESM v2.0的PDO指数的回归系数图;a和b中打点区域以及c和d中蓝色箭头为通过95%置信度的数据
Fig. 13 Regression coefficient of sea level pressure anomalies and wind stress anomalies regressing to the PDO index for the reanalysis datasets and FIO-ESM v2.0
Fig. a and Fig. c are the regression coefficient plots of NCEP/NCAR reanalysis dataset sea level pressure anomalies and wind stress anomalies regressing to the PDO index of HadISST reanalysis data; Fig. b and Fig. d are the the regression coefficient plots of sea level pressure anomalies and wind stress anomalies simulated by FIO-ESM v2.0 regressing to the PDO index of FIO-ESM v2.0; the dotted areas in Fig. a and Fig. b and the blue arrows in Fig. c and Fig. d represent data pass the 95% confidence level
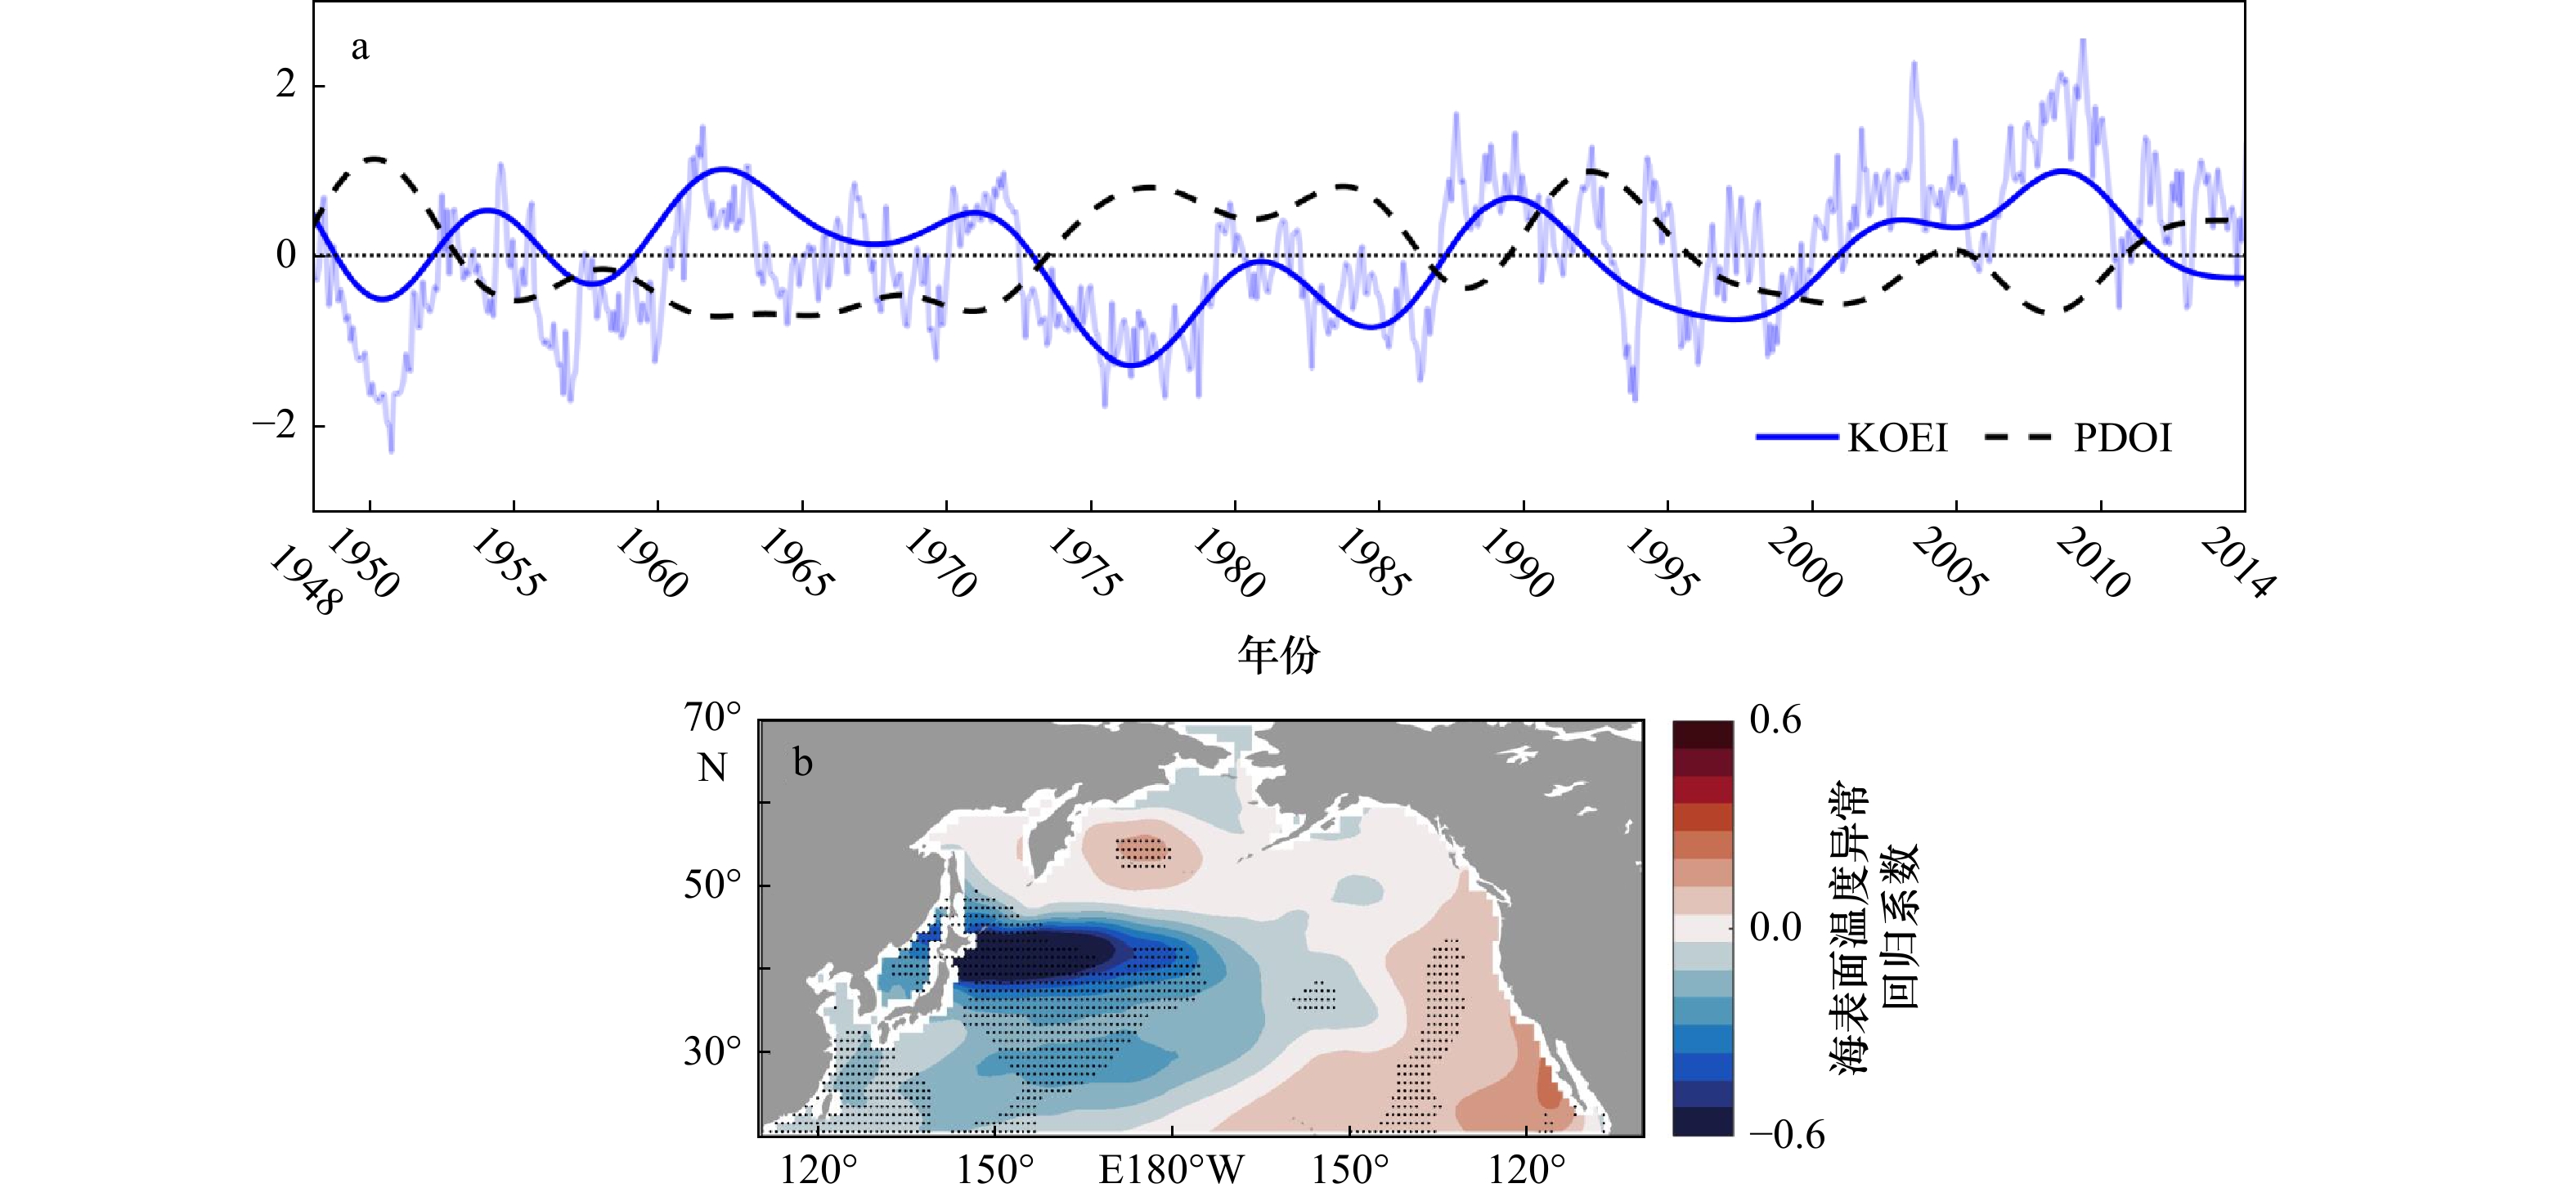
图 14 经过7年低通滤波的1948–2014年KOE海域海表面温度异常时间序列(KOEI,蓝色实线)与PDO指数(PDOI,黑色实线)(a)和北太平洋海表面温度异常回归至KOEI上的回归系数分布(b)
图a中蓝色透明实线为KOE海域未经过滤波的海温异常时间序列;图b中黑色打点区域为通过95%置信度的数据
Fig. 14 The time series of sea surface temperature anomalies (KOEI , blue solid line) and PDO index (PDOI, black solid line) in the KOE sea area from 1948 to 2014 after 7 years of low-pass filtering (a) and the distribution of the regression coefficient of the North Pacific Sea surface temperature anomaly to the KOEI (b)
The blue transparent solid line in Fig. a is the time series of unfiltered SST anomalies in the KOE area; the dotted areas in Fig. b are data that pass the 95% confidence level
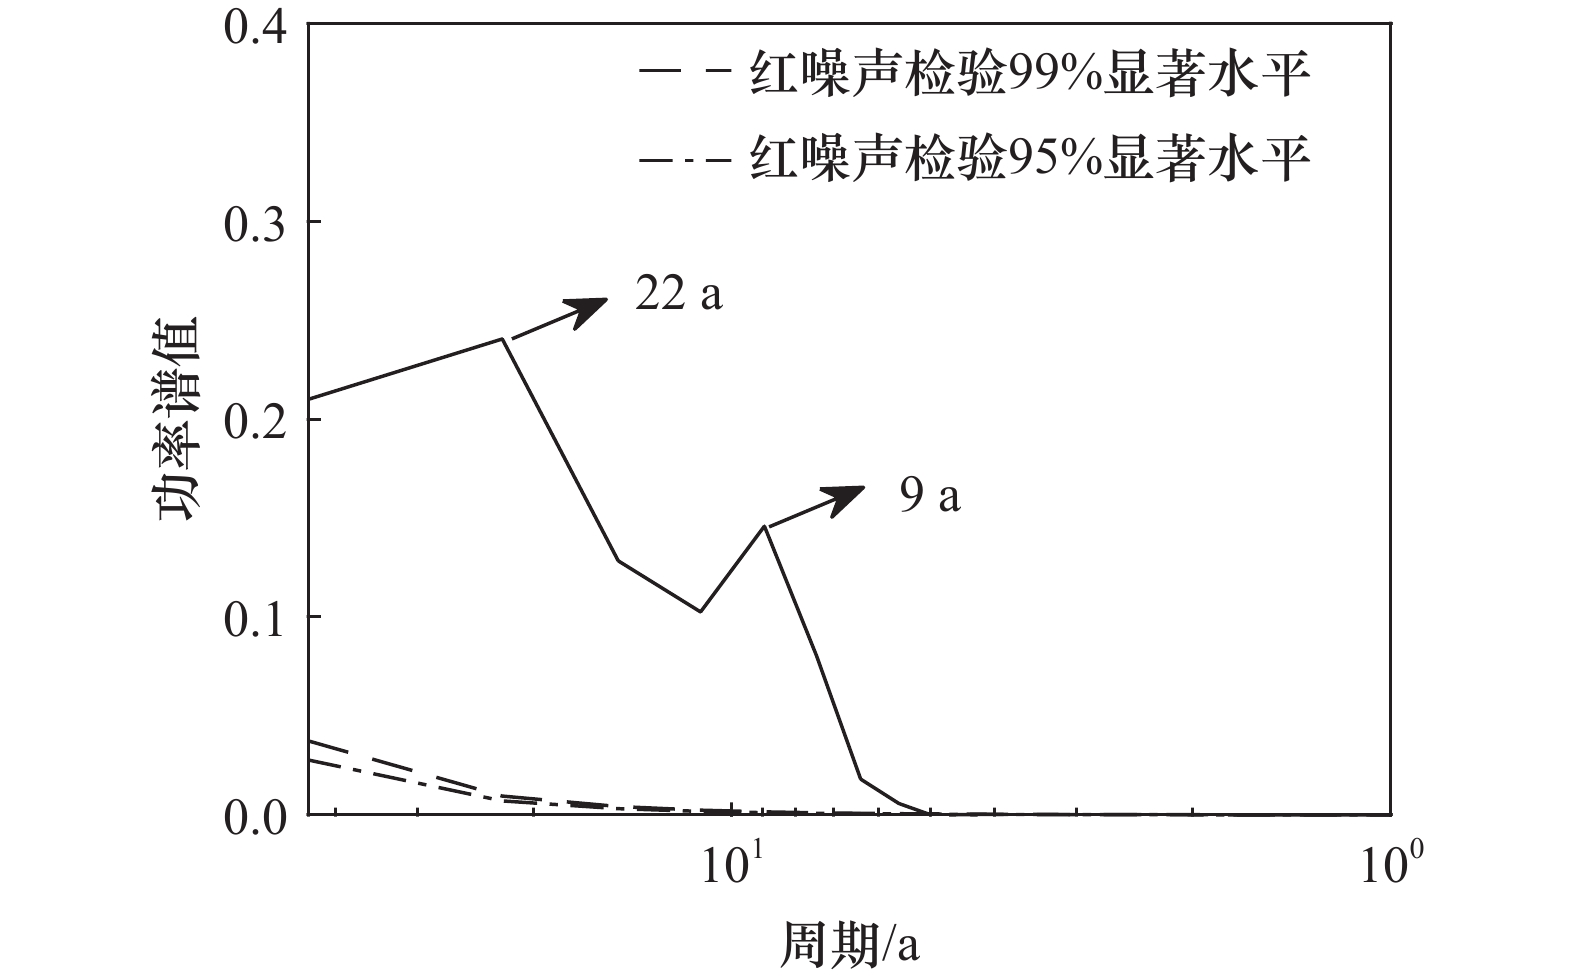
图 15 经过7年低通滤波的KOE海域海温异常时间序列的功率谱
Fig. 15 The power spectrum of the time series of sea temperature anomalies in the KOE area after 7 years of low-pass filtering

图 16 KOE海域1948–2014年年平均的热收支项异常时间序列
红色实线为海温储热率项;蓝色实线为海表面净热通量项;黑色实线为海表面净热通量项、平流项和卷夹作用项之和;黑色虚线为海表面净热通量项、地转平流项、Ekman平流项和卷夹作用项之和
Fig. 16 Time series of annual average heat budget anomalies in the KOE sea area from 1948 to 2014
The red solid line is the heat storage rate term; the blue solid line is the surface net heat flux term; the black solid line is the sum of the surface net heat flux term, the advection term and the entrainment term; the black dashed line is the sum of the surface net heat flux term, geostrophic advection term, Ekman advection term and the entrainment term
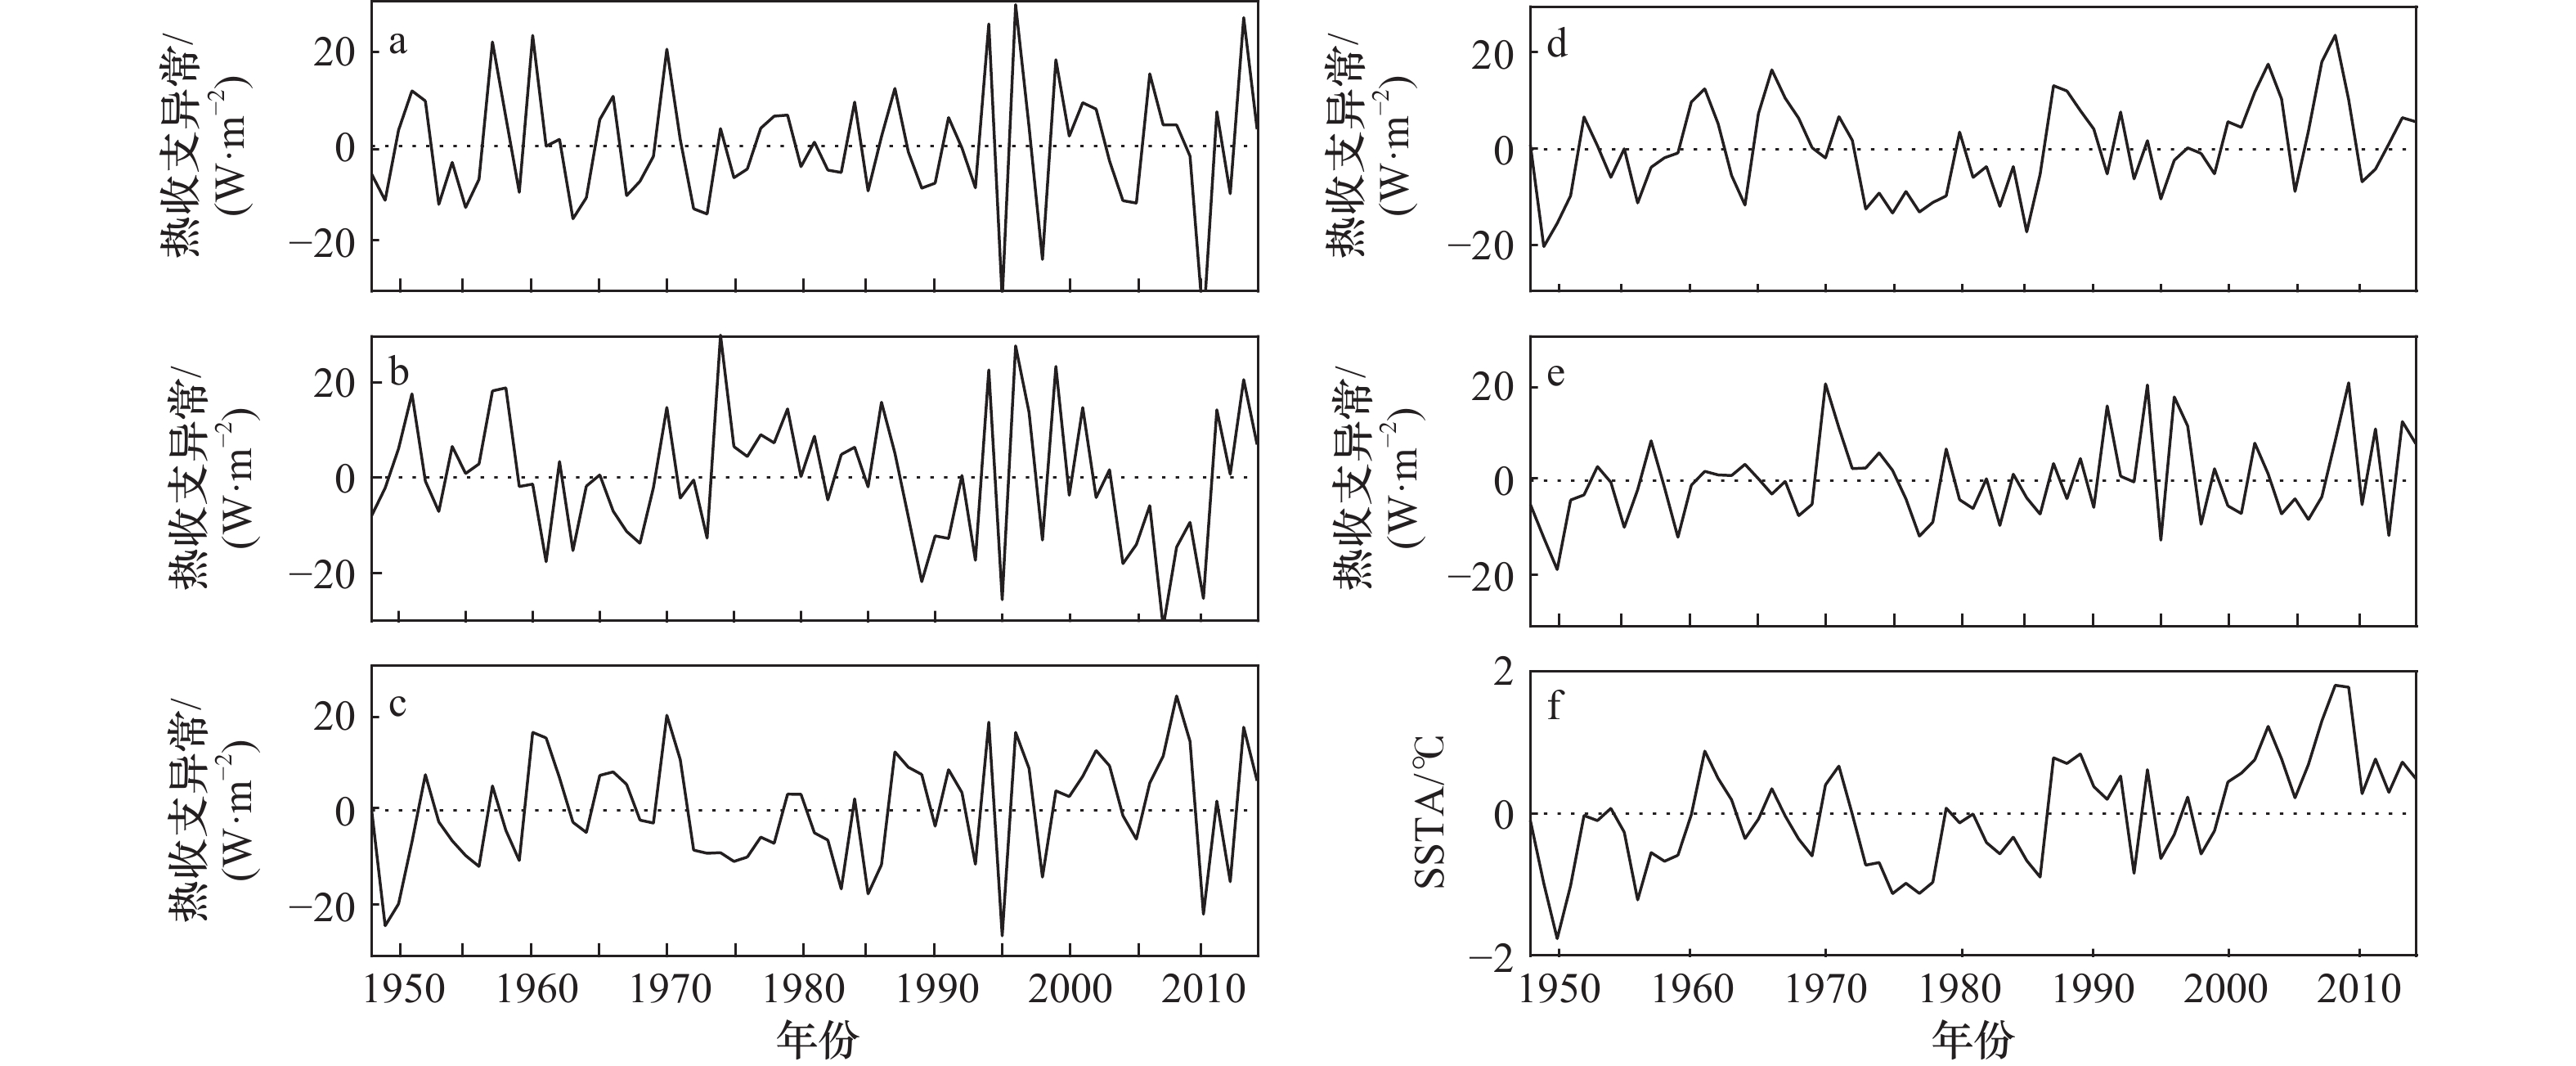
图 17 KOE海域1948−2014年年平均的热收支各项异常时间序列(a−e)和海表面温度异常时间序列(f)
a. 海温储热率项;b. 海表面净热通量项;c. 平流项;d. 地转平流项;e. Ekman平流项
Fig. 17 Time series of annual average heat budget anomalies (a−e) and time series of sea surface temperature anomalies (f) in the KOE sea area from 1948 to 2014
a. Sea surface temperature heat storage rate term; b. sea surface net heat flux term; c. advection term; d. geostrophic advection term; e. Ekman advection term
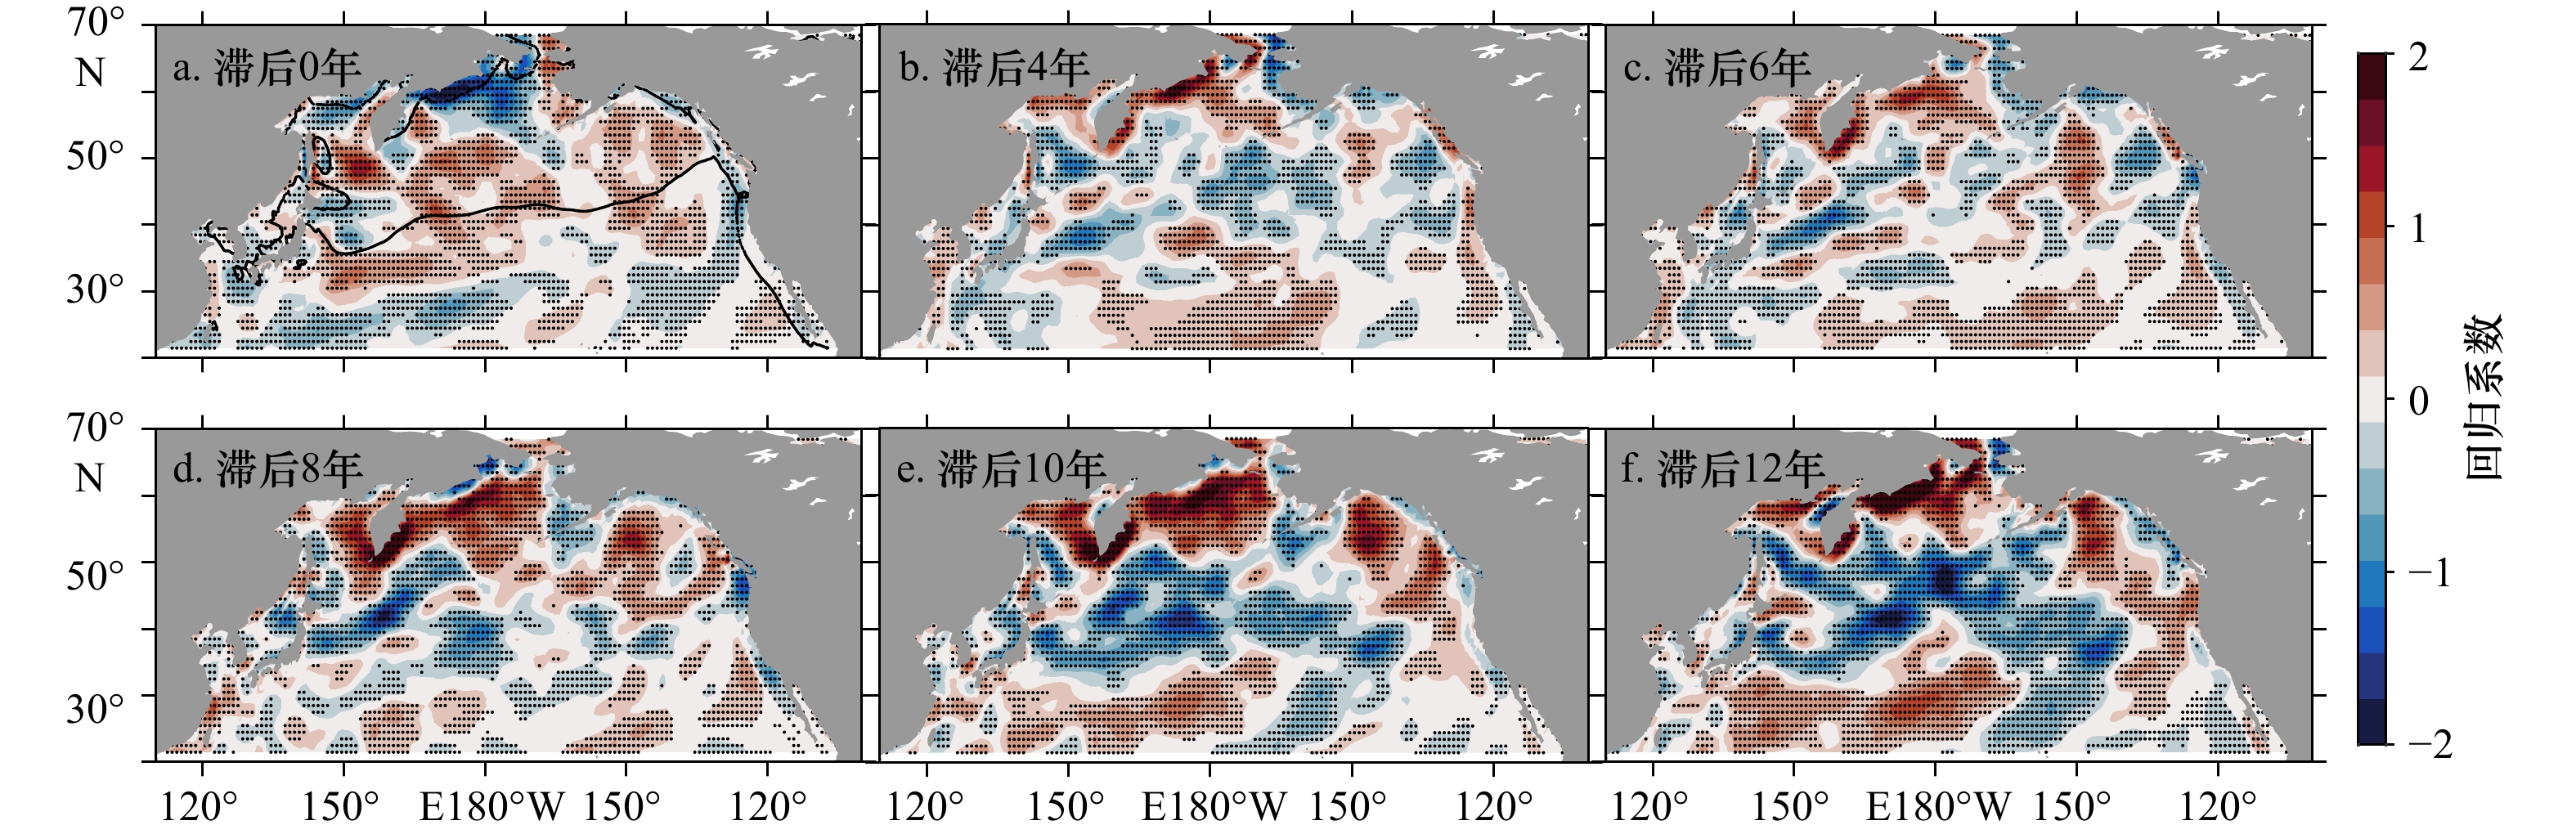
图 18 北太平洋风应力旋度异常回归至不同滞后时间长度(0~12年)的KOEI上的滞后回归系数分布
黑色实线为多年平均的风应力旋度零线;数据回归前进行了7年低通滤波和去趋势
Fig. 18 Distribution of lag regression coefficients on KOEI for wind stress curl anomalies in the North Pacific to different lag time (0−12 years)
The solid black line is the mean wind stress curl zero line for years. Data were low-pass filtered and detrended for 7 years before regression
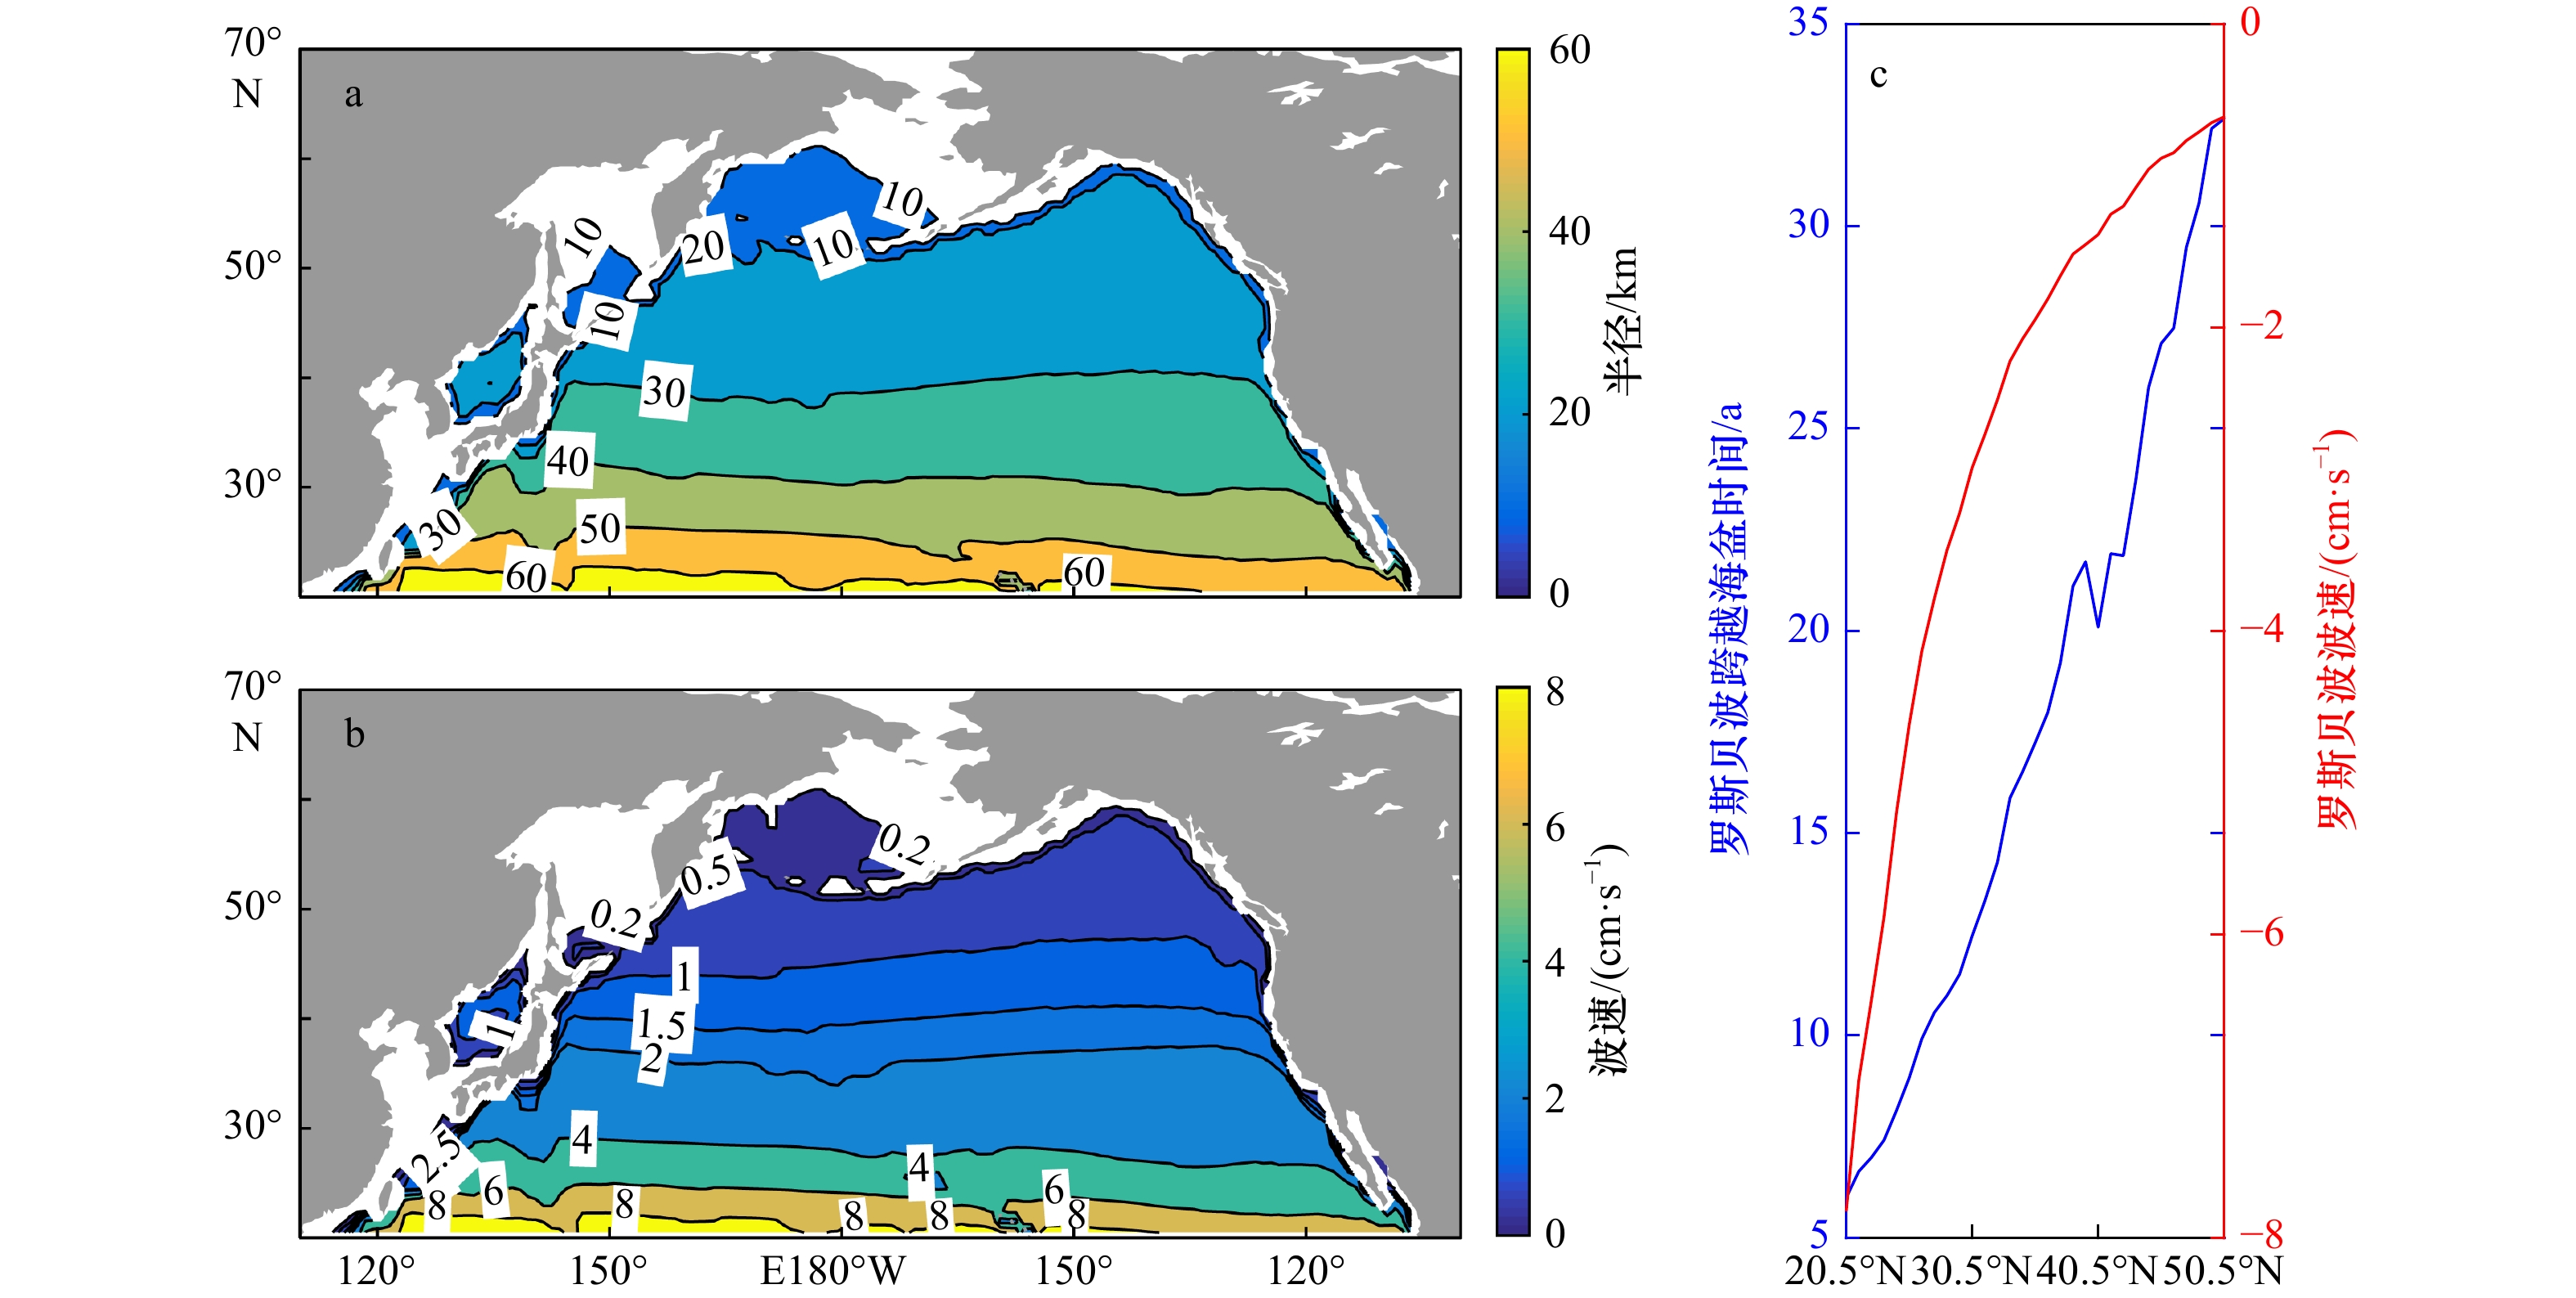
图 19 北太平洋海域基准气候态平均(1981−2010年)的罗斯贝波变形半径(a)、波速(b)以及FIO-ESM V2.0模拟的穿越海盆所需时间(c)
Fig. 19 Rossby waves deformation radius (a), wave velocity (b), and estimated basin crossing time estimated by FIO-ESM V2.0 (c) for the climatological baseline average (1981−2010) in the North Pacific Ocean
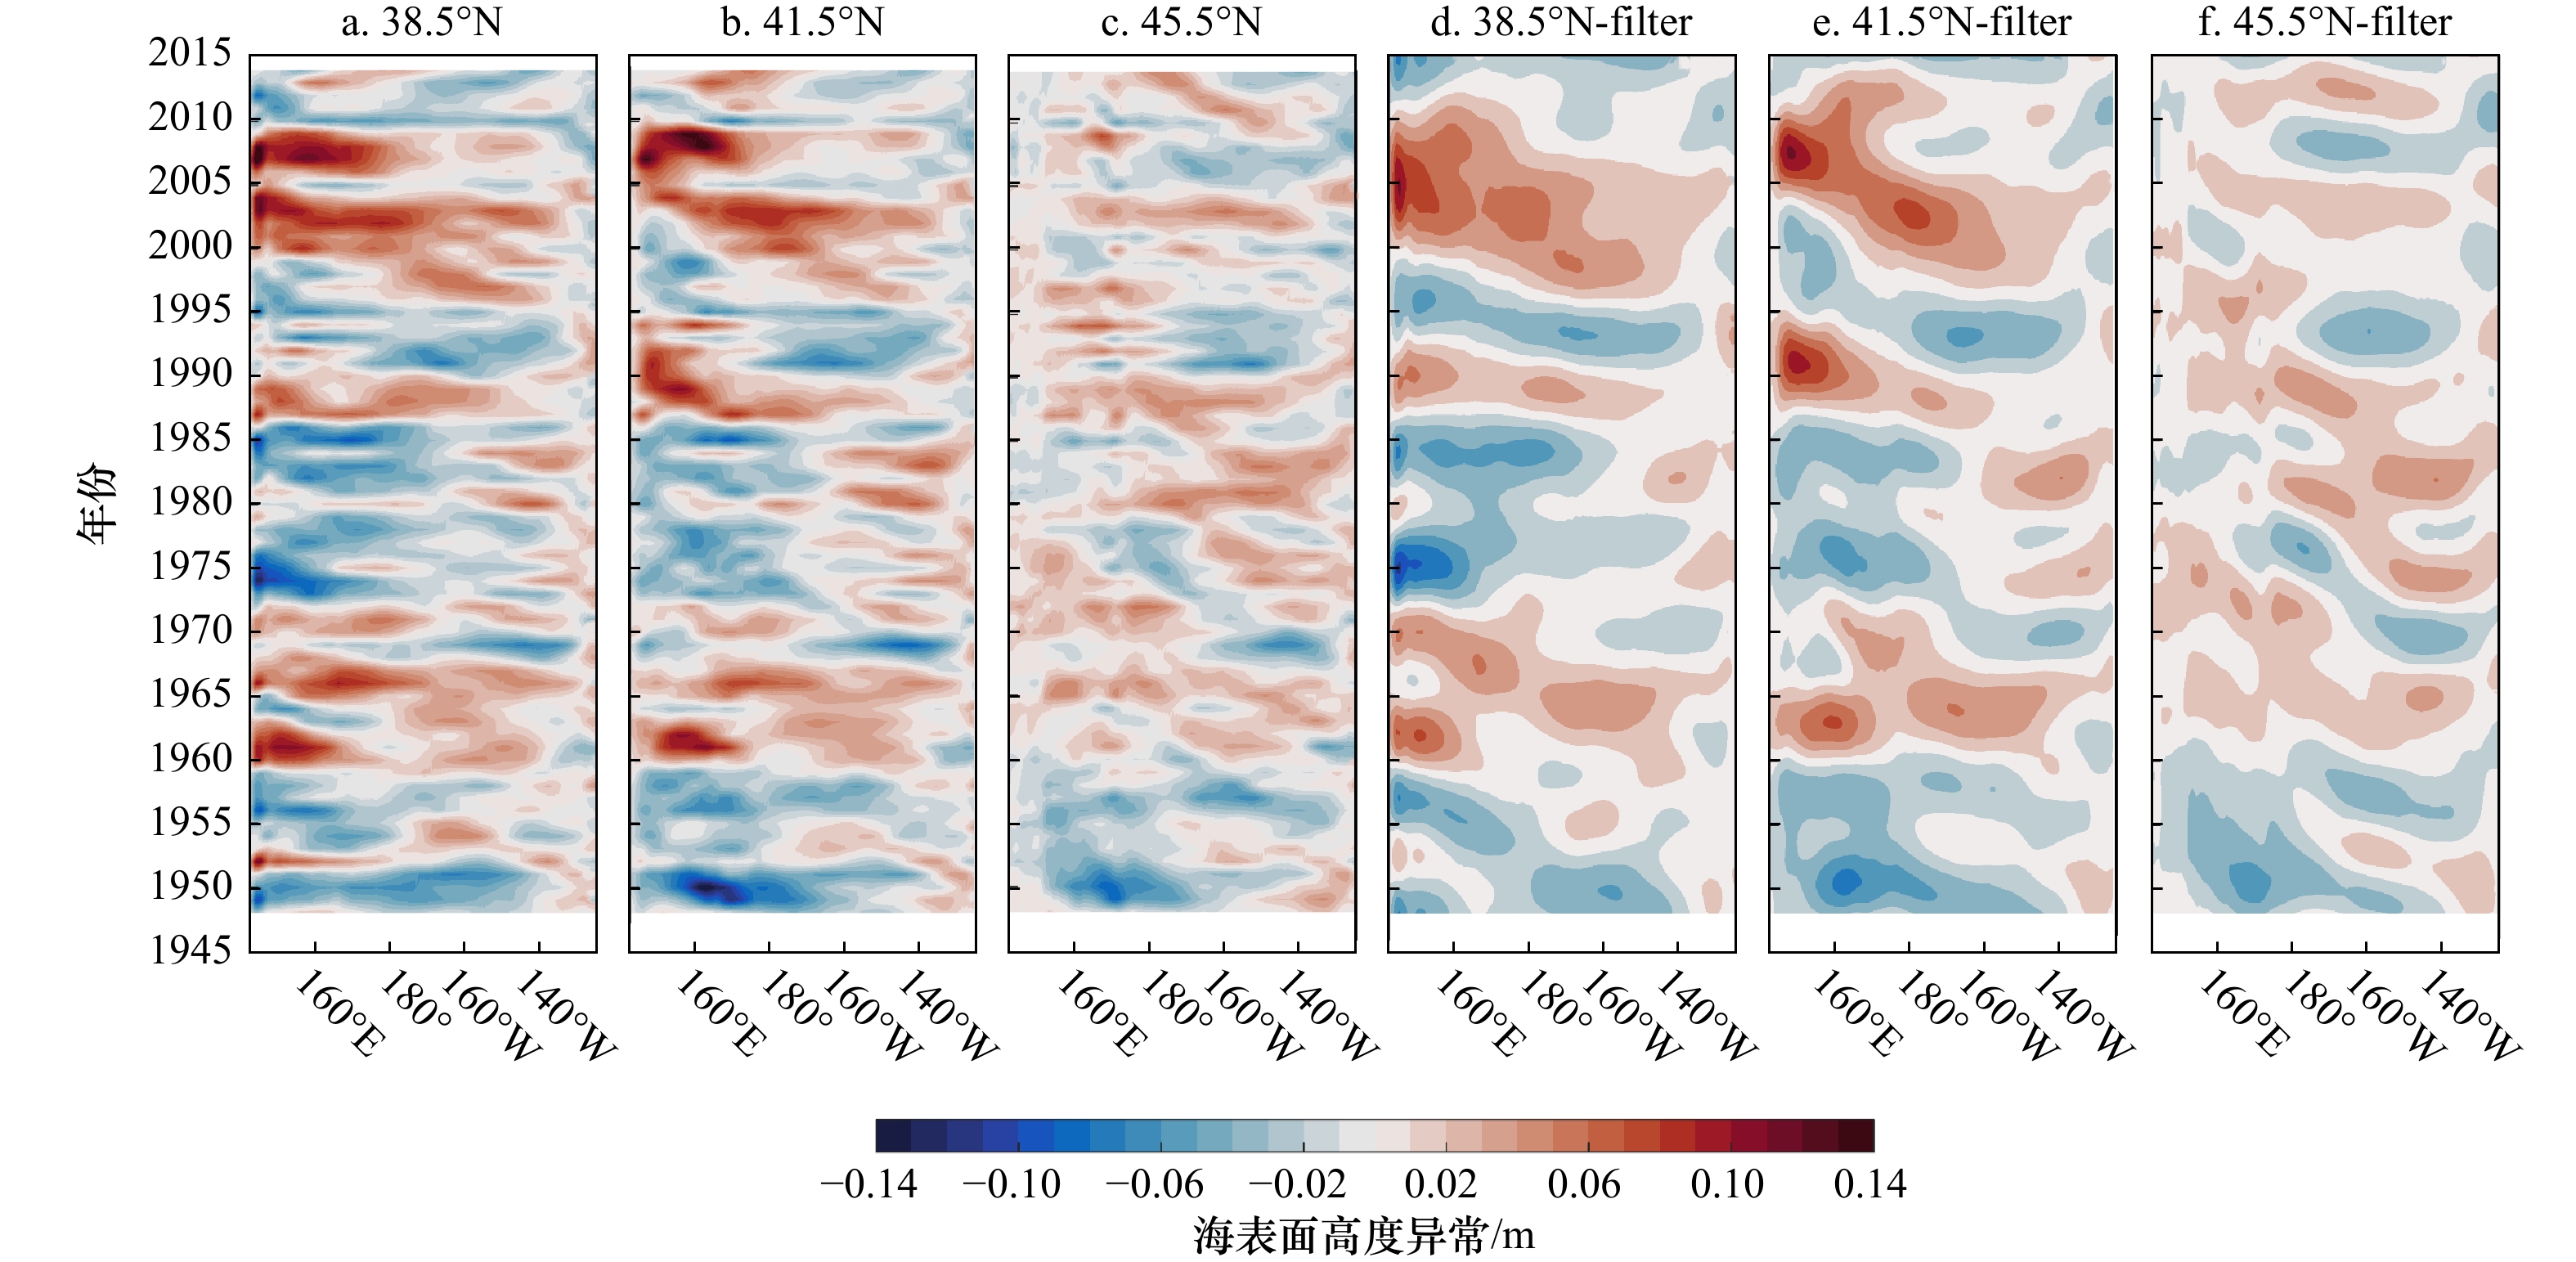
图 20 1948−2014年海表面高度异常在38.5°N、41.5°N和45.5°N处的(单位:m)时间−经度断面
d−f:经过7年低通滤波的结果
Fig. 20 Time-longitude cross-sections of sea surface height anomalies at 38.5°N, 41.5°N, and 45.5°N from 1948 to 2014
d−f: The results after 7 years of low-pass filtering
表 1 FIO-ESM v2.0模拟的与再分析数据的各物理场的统计参数
Tab. 1 Statistical parameters of each physical field simulated by FIO-ESM v2.0 and the reanalysis datasets
海表面
温度/°C海表面气压/
hPa风应力/
(m2·s−2)海表面
高度/m最大偏差 3.80 3.60 75.64 0.46 最小偏差 −2.97 −1.80 −27.86 −0.48 RMSE 1.18 0.97 16.96 0.07 MAE 0.97 0.74 11.67 0.05 R 0.96 0.99 0.89 0.96 注:RMSE为均方根误差,MAE为平均绝对误差,R为空间相关系数。  下载: 导出CSV
-
[1] Mantua N J, Hare S R, Zhang Y, et al. A Pacific interdecadal climate oscillation with impacts on salmon production[J]. Bulletin of the American Meteorological Society, 1997, 78(6): 1069−1080. doi: 10.1175/1520-0477(1997)078<1069:APICOW>2.0.CO;2 [2] Minobe S. A 50−70 year climatic oscillation over the North Pacific and North America[J]. Geophysical Research Letters, 1997, 24(6): 683−686. doi: 10.1029/97GL00504 [3] Ware D M, Thomson R E. Interannual to multidecadal timescale climate variations in the Northeast Pacific[J]. Journal of Climate, 2000, 13(18): 3209−3220. doi: 10.1175/1520-0442(2000)013<3209:ITMTCV>2.0.CO;2 [4] Hare S R. Low frequency climate variability and salmon production[D]. Washington: University of Washington, 1996. [5] 朱益民, 杨修群. 太平洋年代际振荡与中国气候变率的联系[J]. 气象学报, 2003, 61(6): 641−654.Zhu Yimin, Yang Xiuqun. Relationships between Pacific Decadal Oscillation (PDO) and climate variabilities in China[J]. Acta Meteorologica Sinica, 2003, 61(6): 641−654. [6] Yu Wei, Chen Xinjun, Yi Qian, et al. A review of interaction between neon flying squid (Ommastrephes bartramii) and oceanographic variability in the North Pacific Ocean[J]. Journal of Ocean University of China, 2015, 14(4): 739−748. doi: 10.1007/s11802-015-2562-8 [7] Easterbrook D J. Using patterns of recurring climate cycles to predict future climate changes[M]//Easterbrook D J. Evidence-Based Climate Science: Data Opposing CO2 Emissions as the Primary Source of Global Warming. 2nd ed. Amsterdam: Elsevier, 2016: 395−411. [8] Joh Y, Di Lorenzo E. Increasing coupling between NPGO and PDO leads to prolonged marine heatwaves in the Northeast Pacific[J]. Geophysical Research Letters, 2017, 44(22): 11663−11671. doi: 10.1002/2017GL075930 [9] Kundzewicz Z W, Huang Jinlong, Pinskwar I, et al. Climate variability and floods in China—a review[J]. Earth-Science Reviews, 2020, 211: 103434. doi: 10.1016/j.earscirev.2020.103434 [10] Gershunov A, Barnett T P. Interdecadal modulation of ENSO teleconnections[J]. Bulletin of the American Meteorological Society, 1998, 79(12): 2715−2726. doi: 10.1175/1520-0477(1998)079<2715:IMOET>2.0.CO;2 [11] Birk K, Lupo A R, Guinan P, et al. The interannual variability of midwestern temperatures and precipitation as related to the ENSO and PDO[J]. Atmosfera, 2010, 23(2): 95−128. [12] Frankignoul C, Hasselmann K. Stochastic climate models, Part II Application to sea-surface temperature anomalies and thermocline variability[J]. Tellus, 1977, 29(4): 289−305. doi: 10.3402/tellusa.v29i4.11362 [13] Frankignoul C. A cautionary note on the use of statistical atmospheric models in the middle latitudes: comments on “Decadal variability in the North Pacific as simulated by a hybrid coupled model”[J]. Journal of Climate, 1999, 12(6): 1871−1872. doi: 10.1175/1520-0442(1999)012<1871:ACNOTU>2.0.CO;2 [14] Trenberth K E, Branstator G W, Karoly D, et al. Progress during TOGA in understanding and modeling global teleconnections associated with tropical sea surface temperatures[J]. Journal of Geophysical Research, 1998, 103(C7): 14291−14324. doi: 10.1029/97JC01444 [15] Alexander M A, Bladé I, Newman M, et al. The atmospheric bridge: the influence of ENSO teleconnections on air-sea interaction over the global oceans[J]. Journal of Climate, 2002, 15(16): 2205−2231. doi: 10.1175/1520-0442(2002)015<2205:TABTIO>2.0.CO;2 [16] Clarke A J, Van Gorder S. On ENSO coastal currents and sea levels[J]. Journal of Physical Oceanography, 1994, 24(3): 661−680. doi: 10.1175/1520-0485(1994)024<0661:OECCAS>2.0.CO;2 [17] Miller A J, White W B, Cayan D R. North Pacific thermocline variations on ENSO timescales[J]. Journal of Physical Oceanography, 1997, 27(9): 2023−2039. doi: 10.1175/1520-0485(1997)027<2023:NPTVOE>2.0.CO;2 [18] Alexander M. Extratropical air-sea interaction, sea surface temperature variability, and the Pacific decadal oscillation[M]//Sun Dezheng, Bryan F. Climate Dynamics: Why Does Climate Vary. Washington: American Geophysical Union, 2010: 123−148. [19] Namias J, Born R M. Further studies of temporal coherence in North Pacific sea surface temperatures[J]. Journal of Geophysical Research, 1974, 79(6): 797−798. doi: 10.1029/JC079i006p00797 [20] Alexander M A, Deser C. A mechanism for the recurrence of wintertime midlatitude SST anomalies[J]. Journal of Physical Oceanography, 1995, 25(1): 122−137. doi: 10.1175/1520-0485(1995)025<0122:AMFTRO>2.0.CO;2 [21] Schwartz R E, Gershunov A, Iacobellis S F, et al. North American west coast summer low cloudiness: broadscale variability associated with sea surface temperature[J]. Geophysical Research Letters, 2014, 41(9): 3307−3314. doi: 10.1002/2014GL059825 [22] Latif M, Barnett T P. Decadal climate variability over the North Pacific and North America: dynamics and predictability[J]. Journal of Climate, 1996, 9(10): 2407−2423. doi: 10.1175/1520-0442(1996)009<2407:DCVOTN>2.0.CO;2 [23] Miller A J, Schneider N. Interdecadal climate regime dynamics in the North Pacific Ocean: theories, observations and ecosystem impacts[J]. Progress in Oceanography, 2000, 47(2/4): 355−379. [24] Taguchi B, Xie Shangping, Schneider N, et al. Decadal variability of the Kuroshio Extension: observations and an eddy-resolving model hindcast[J]. Journal of Climate, 2007, 20(11): 2357−2377. doi: 10.1175/JCLI4142.1 [25] Zhong Yafang, Liu Zhengyu. On the mechanism of Pacific multidecadal climate variability in CCSM3: The role of the subpolar North Pacific Ocean[J]. Journal of Physical Oceanography, 2009, 39(9): 2052−2076. doi: 10.1175/2009JPO4097.1 [26] Taguchi B, Nakamura H, Nonaka M, et al. Seasonal evolutions of atmospheric response to decadal SST anomalies in the North Pacific subarctic frontal zone: observations and a coupled model simulation[J]. Journal of Climate, 2012, 25(1): 111−139. doi: 10.1175/JCLI-D-11-00046.1 [27] Gu Daifang, Philander S G H. Interdecadal climate fluctuations that depend on exchanges between the tropics and extratropics[J]. Science, 1997, 275(5301): 805−807. doi: 10.1126/science.275.5301.805 [28] Li Yuanlong, Wang Fan, Sun Yan. Low-frequency spiciness variations in the tropical Pacific Ocean observed during 2003−2012[J]. Geophysical Research Letters, 2012, 39(23): L23601. [29] Kleeman R, McCreary Jr J P, Klinger B A. A mechanism for generating ENSO decadal variability[J]. Geophysical Research Letters, 1999, 26(12): 1743−1746. doi: 10.1029/1999GL900352 [30] Zhang Dongxiao, McPhaden M J. Decadal variability of the shallow Pacific meridional overturning circulation: relation to tropical sea surface temperatures in observations and climate change models[J]. Ocean Modelling, 2006, 15(3/4): 250−273. [31] Vimont D J, Wallace J M, Battisti D S. The seasonal footprinting mechanism in the Pacific: implications for ENSO[J]. Journal of Climate, 2003, 16(16): 2668−2675. doi: 10.1175/1520-0442(2003)016<2668:TSFMIT>2.0.CO;2 [32] Landscheidt T. Trends in Pacific Decadal Oscillation subjected to solar forcing[EB/OL]. [2021−10−16]. http://www.john-daly/theodor/pdotrend.htm. [33] Hamamoto M, Yasuda I. Synchronized interdecadal variations behind regime shifts in the Pacific Decadal Oscillation[J]. Journal of Oceanography, 2021, 77(3): 383−392. doi: 10.1007/s10872-021-00592-8 [34] Capotondi A, Wittenberg A T, Newman M, et al. Understanding ENSO diversity[J]. Bulletin of the American Meteorological Society, 2015, 96(6): 921−938. doi: 10.1175/BAMS-D-13-00117.1 [35] L’Heureux M L, Levine A F Z, Newman M, et al. ENSO prediction[M]//McPhaden M J, Santoso A, Cai Wenju. El Niño Southern Oscillation in A Changing Climate. Hoboken: American Geophysical Union, 2020: 227−246. [36] Eyring V, Bony S, Meehl G A, et al. Overview of the Coupled Model Intercomparison Project Phase 6 (CMIP6) experimental design and organization[J]. Geoscientific Model Development, 2016, 9(5): 1937−1958. doi: 10.5194/gmd-9-1937-2016 [37] 顾薇, 李崇银. IPCC AR4中海气耦合模式对中国东部夏季降水及PDO、NAO年代际变化的模拟能力分析[J]. 大气科学学报, 2010, 33(4): 401−411.Gu Wei, Li Chongyin. Evaluation of the IPCC AR4 climate models in simulating the interdecadal variations of the east China summer precipitation, PDO and NAO[J]. Transactions of Atmospheric Sciences, 2010, 33(4): 401−411. [38] Wang Tao, Miao Jiapeng. Twentieth-century Pacific Decadal Oscillation simulated by CMIP5 coupled models[J]. Atmospheric and Oceanic Science Letters, 2018, 11(1): 94−101. doi: 10.1080/16742834.2017.1381548 [39] 陈红. CMIP5耦合模式对太平洋年代际振荡的模拟与预估[J]. 大气科学, 2019, 43(4): 783−795.Chen Hong. Simulation and projection of the Pacific Decadal Oscillation based on CMIP5 coupled models[J]. Chinese Journal of Atmospheric Sciences, 2019, 43(4): 783−795. [40] Mochizuki T, Ishii M, Kimoto M, et al. Pacific decadal oscillation hindcasts relevant to near-term climate prediction[J]. Proceedings of the National Academy of Sciences of the United States of America, 2010, 107(5): 1833−1837. [41] Mochizuki T, Chikamoto Y, Kimoto M, et al. Decadal prediction using a recent series of MIROC global climate models[J]. Journal of the Meteorological Society of Japan, 2012, 90A: 373−383. [42] Alexander M A, Matrosova L, Penland C, et al. Forecasting Pacific SSTs: linear inverse model predictions of the PDO[J]. Journal of Climate, 2008, 21(2): 385−402. doi: 10.1175/2007JCLI1849.1 [43] Wen Caihong, Xue Yan, Kumar A. Seasonal prediction of North Pacific SSTs and PDO in the NCEP CFS hindcasts[J]. Journal of Climate, 2012, 25(17): 5689−5710. doi: 10.1175/JCLI-D-11-00556.1 [44] Furtado J C, Di Lorenzo E, Schneider N, et al. North Pacific decadal variability and climate change in the IPCC AR4 models[J]. Journal of Climate, 2011, 24(12): 3049−3067. doi: 10.1175/2010JCLI3584.1 [45] Henley B J. Pacific decadal climate variability: indices, patterns and tropical-extratropical interactions[J]. Global and Planetary Change, 2017, 155: 42−55. doi: 10.1016/j.gloplacha.2017.06.004 [46] Kim H M, Ham Y G, Scaife A A. Improvement of initialized decadal predictions over the North Pacific Ocean by systematic anomaly pattern correction[J]. Journal of Climate, 2014, 27(13): 5148−5162. doi: 10.1175/JCLI-D-13-00519.1 [47] 和玉君, 刘咪咪, 王斌. 年代际预测和耦合资料同化研究综述[J]. 地球物理学报, 2020, 63(1): 1−18.He Yujun, Liu Mimi, Wang Bin. Review on the study of decadal prediction and coupled data assimilation[J]. Chinese Journal of Geophysics, 2020, 63(1): 1−18. [48] Chen Shangfeng, Yu Bin, Wu Renguang, et al. The dominant North Pacific atmospheric circulation patterns and their relations to Pacific SSTs: historical simulations and future projections in the IPCC AR6 models[J]. Climate Dynamics, 2021, 56(3): 701−725. [49] Qiao Fangli, Yuan Yeli, Yang Yongzeng, et al. Wave-induced mixing in the upper ocean: distribution and application to a global ocean circulation model[J]. Geophysical Research Letters, 2004, 31(11): L11303. [50] Song Zhenya, Qiao Fangli, Song Yajuan. Response of the equatorial basin-wide SST to non-breaking surface wave-induced mixing in a climate model: an amendment to tropical bias[J]. Journal of Geophysical Research, 2012, 117(C11): C00J26. [51] Qiao Fangli, Song Zhenya, Bao Ying, et al. Development and evaluation of an Earth System Model with surface gravity waves[J]. Journal of Geophysical Research, 2013, 118(9): 4514−4524. doi: 10.1002/jgrc.20327 [52] Liu Zhengyu. Dynamics of interdecadal climate variability: a historical perspective[J]. Journal of Climate, 2012, 25(6): 1963−1995. doi: 10.1175/2011JCLI3980.1 [53] 宋振亚, 鲍颖, 乔方利. FIO-ESM v2.0模式及其参与CMIP6的方案[J]. 气候变化研究进展, 2019, 15(5): 558−565.Song Zhenya, Bao Ying, Qiao Fangli. Introduction of FIO-ESM v2.0 and its participation plan in CMIP6 experiments[J]. Climate Change Research, 2019, 15(5): 558−565. [54] 宋振亚. 耦合海浪的地球系统模式FIO-ESM[J]. 气候变化研究快报, 2020, 9(1): 26−39. doi: 10.12677/CCRL.2020.91004Song Zhenya. FIO-ESM: the earth system model coupled with ocean surface gravity waves[J]. Climate Change Research Letters, 2020, 9(1): 26−39. doi: 10.12677/CCRL.2020.91004 [55] Bao Ying, Song Zhenya, Qiao Fangli. FIO-ESM version 2.0: model description and evaluation[J]. Journal of Geophysical Research, 2020, 125(6): e2019JC016036. [56] Zhang Yuan, Wallace J M, Battisti D S. ENSO-like Interdecadal variability: 1900−93[J]. Journal of Climate, 1997, 10(5): 1004−1020. doi: 10.1175/1520-0442(1997)010<1004:ELIV>2.0.CO;2 [57] Trenberth K E, Fasullo J T. An apparent hiatus in global warming?[J]. Earth’s Future, 2013, 1(1): 19−32. doi: 10.1002/2013EF000165 [58] North G R, Bell T L, Cahalan R F, et al. Sampling errors in the estimation of empirical orthogonal functions[J]. Monthly Weather Review, 1982, 110(7): 699−706. doi: 10.1175/1520-0493(1982)110<0699:SEITEO>2.0.CO;2 [59] Bond N A, Overland J E, Spillane M, et al. Recent shifts in the state of the North Pacific[J]. Geophysical Research Letters, 2003, 30(23): 2183. [60] Ceballos L I, Di Lorenzo E, Hoyos C D, et al. North Pacific Gyre Oscillation synchronizes climate fluctuations in the eastern and western boundary systems[J]. Journal of Climate, 2009, 22(19): 5163−5174. doi: 10.1175/2009JCLI2848.1 [61] Rogers J C. The North Pacific oscillation[J]. Journal of Climatology, 1981, 1(1): 39−57. doi: 10.1002/joc.3370010106 [62] Di Lorenzo E, Schneider N, Cobb K M, et al. North Pacific Gyre Oscillation links ocean climate and ecosystem change[J]. Geophysical Research Letters, 2008, 35(8): L08607. [63] Trenberth K E, Hurrell J W. Decadal atmosphere-ocean variations in the Pacific[J]. Climate Dynamics, 1994, 9(6): 303−319. doi: 10.1007/BF00204745 [64] Newman M, Alexander M A, Ault T R, et al. The Pacific decadal oscillation, revisited[J]. Journal of Climate, 2016, 29(12): 4399−4427. doi: 10.1175/JCLI-D-15-0508.1 [65] Miller A J, Cayan D R, Barnett T P, et al. The 1976−77 climate shift of the Pacific Ocean[J]. Oceanography, 1994, 7(1): 21−26. doi: 10.5670/oceanog.1994.11 [66] Chhak K C, Di Lorenzo E, Schneider N, et al. Forcing of low-frequency ocean variability in the Northeast Pacific[J]. Journal of Climate, 2009, 22(5): 1255−1276. doi: 10.1175/2008JCLI2639.1 [67] Smirnov D, Newman M, Alexander M A. Investigating the role of ocean-atmosphere coupling in the North Pacific Ocean[J]. Journal of Climate, 2014, 27(2): 592−606. doi: 10.1175/JCLI-D-13-00123.1 [68] Alexander M A, Scott J D. The role of Ekman ocean heat transport in the Northern Hemisphere response to ENSO[J]. Journal of Climate, 2008, 21(21): 5688−5707. doi: 10.1175/2008JCLI2382.1 [69] Coburn J, Pryor S C. Differential credibility of climate modes in CMIP6[J]. Journal of Climate, 2021, 34(20): 8145−8164. doi: 10.1175/JCLI-D-21-0359.1 [70] Stevenson J W, Niiler P P. Upper ocean heat budget during the Hawaii-to-Tahiti shuttle experiment[J]. Journal of Physical Oceanography, 1983, 13(10): 1894−1907. doi: 10.1175/1520-0485(1983)013<1894:UOHBDT>2.0.CO;2 [71] Moisan J R, Niiler P P. The seasonal heat budget of the North Pacific: net heat flux and heat storage rates (1950−1990)[J]. Journal of Physical Oceanography, 1998, 28(3): 401−421. doi: 10.1175/1520-0485(1998)028<0401:TSHBOT>2.0.CO;2 [72] Kwon Y O, Deser C. North Pacific decadal variability in the community climate system model version 2[J]. Journal of Climate, 2007, 20(11): 2416−2433. doi: 10.1175/JCLI4103.1 [73] Qiu Bo. Kuroshio Extension variability and forcing of the Pacific decadal oscillations: responses and potential feedback[J]. Journal of Physical Oceanography, 2003, 33(12): 2465−2482. doi: 10.1175/1520-0485(2003)033<2465:KEVAFO>2.0.CO;2 [74] Chelton D B, DeSzoeke R A, Schlax M G, et al. Geographical variability of the first baroclinic Rossby radius of deformation[J]. Journal of Physical Oceanography, 1998, 28(3): 433−460. doi: 10.1175/1520-0485(1998)028<0433:GVOTFB>2.0.CO;2 [75] 范海梅, 张庆华, 李丙瑞, 等. 第一斜压Rossby波在大洋传播中的调整[J]. 海洋科学进展, 2007, 25(1): 15−19.Fan Haimei, Zhang Qinghua, Li Bingrui, et al. Adjustment of the first baroclinic rossby wave propagating in global ocean[J]. Advances in Marine Science, 2007, 25(1): 15−19. [76] Schneider N, Miller A J, Pierce D W. Anatomy of North Pacific decadal variability[J]. Journal of Climate, 2002, 15(6): 586−605. doi: 10.1175/1520-0442(2002)015<0586:AONPDV>2.0.CO;2 -

计量
- 文章访问数: 507
- HTML全文浏览量: 266
- PDF下载量: 26
- 被引次数: 0
