

Spatial-temporal variation of water quality and pollutant source analysis in rivers along Liaodong Bay
-
摘要: 基于辽东湾入海河流120个监测断面(含16个入海断面)的水质数据,采用主成分分析−多元线性回归模型等方法,研究其有机物、营养盐和重金属等的污染特征和入海通量,并分析其可能来源。结果表明,水质超标指标主要是高锰酸盐指数(CODMn)、氨氮(AN)浓度、总磷(TP)浓度和总氮(TN)浓度,其他指标符合I类地表水水质标准。TN/TP比值较高,严重偏离Redfield比值,陆源高含量氮和低含量磷的输入是造成渤海海水TN/TP升高的主要因素。非汛期的溶解氧(DO)浓度、电导率(EC)、AN浓度和TN浓度显著高于汛期,而非汛期的pH、浊度、CODMn和TP浓度显著低于汛期。2021年河口有机物和营养盐浓度受河流穿行农业区等因素的影响,重金属浓度则与域内工业企业分布有关。TN、TP、化学需氧量(COD)、AN和石油类年入海通量分别为3.63 × 104 t、1 608.5 t、14.8 ×10⁴ t、3 086.6 t和221.9 t,Hg、Cd、Pb、As和Cr6+分别为0.264 t、0.253 t、1.978 t、20.434 t和31.651 t。研究区主要的污染源按照其贡献大小依次为生活污水和工业废水、水动力条件等水文因素所致的污染源、水−气界面物质交换及二次转化源和农田地表径流与交通运输产生的非点源。Abstract: Based on the dataset of 120 water quality monitoring sites (including 16 coastal sites) in rivers along Liaodong Bay, the principal component analysis-multiple linear regression (PCA-MLR) model was used to study the pollution characteristics and flux of organic matter, nutrients and heavy metals, and analyze their possible sources. The pollutants exceeding the first grade of Environmental Quality Standards for Surface Water were CODMn, AN concentration. TP concentration and TN concentration, and other water quality parameters met the standard. The TN/TP ratios were high and seriously deviated from the Redfield ratio. The input of high N and low P load from terrestrial sources was the main factor causing the increase of TN/TP in Bohai Sea. DO concentration, EC, AN concentration and TN concentration in non-flood season increased significantly than in flood season, while pH, turbidity, CODMn and TP concentration in non-flood season decreased significantly than in flood season. The concentrations of organic matter and nutrients in estuaries were affected by factors such as the agricultural areas that rivers flowed, while the concentrations of heavy metals were related to the distribution of industrial enterprises in the region. The annual fluxes of TN, TP, COD, AN and petroleum pollutant into Liaodong Bay were 3.63 × 10⁴ t, 1 608.5 t, 14.8 ×10⁴ t, 3 086.6 t and 221.9 t, respectively, and the fluxes of Hg, Cd, Pb, As and Cr6+ were 0.264 t, 0.253 t, 1.978 t, 20.434 t and 31.651 t, respectively. According to their contribution, the main pollution sources were domestic sewage and industrial wastewater, sources caused by hydrological factors (hydrodynamic conditions, etc.), water-gas interface pollutants exchange and secondary sources, non-point sources of farmland runoff and transportation.
-
Key words:
- water quality /
- sources analysis /
- PCA-MLR model /
- flux /
- Liaodong Bay
-
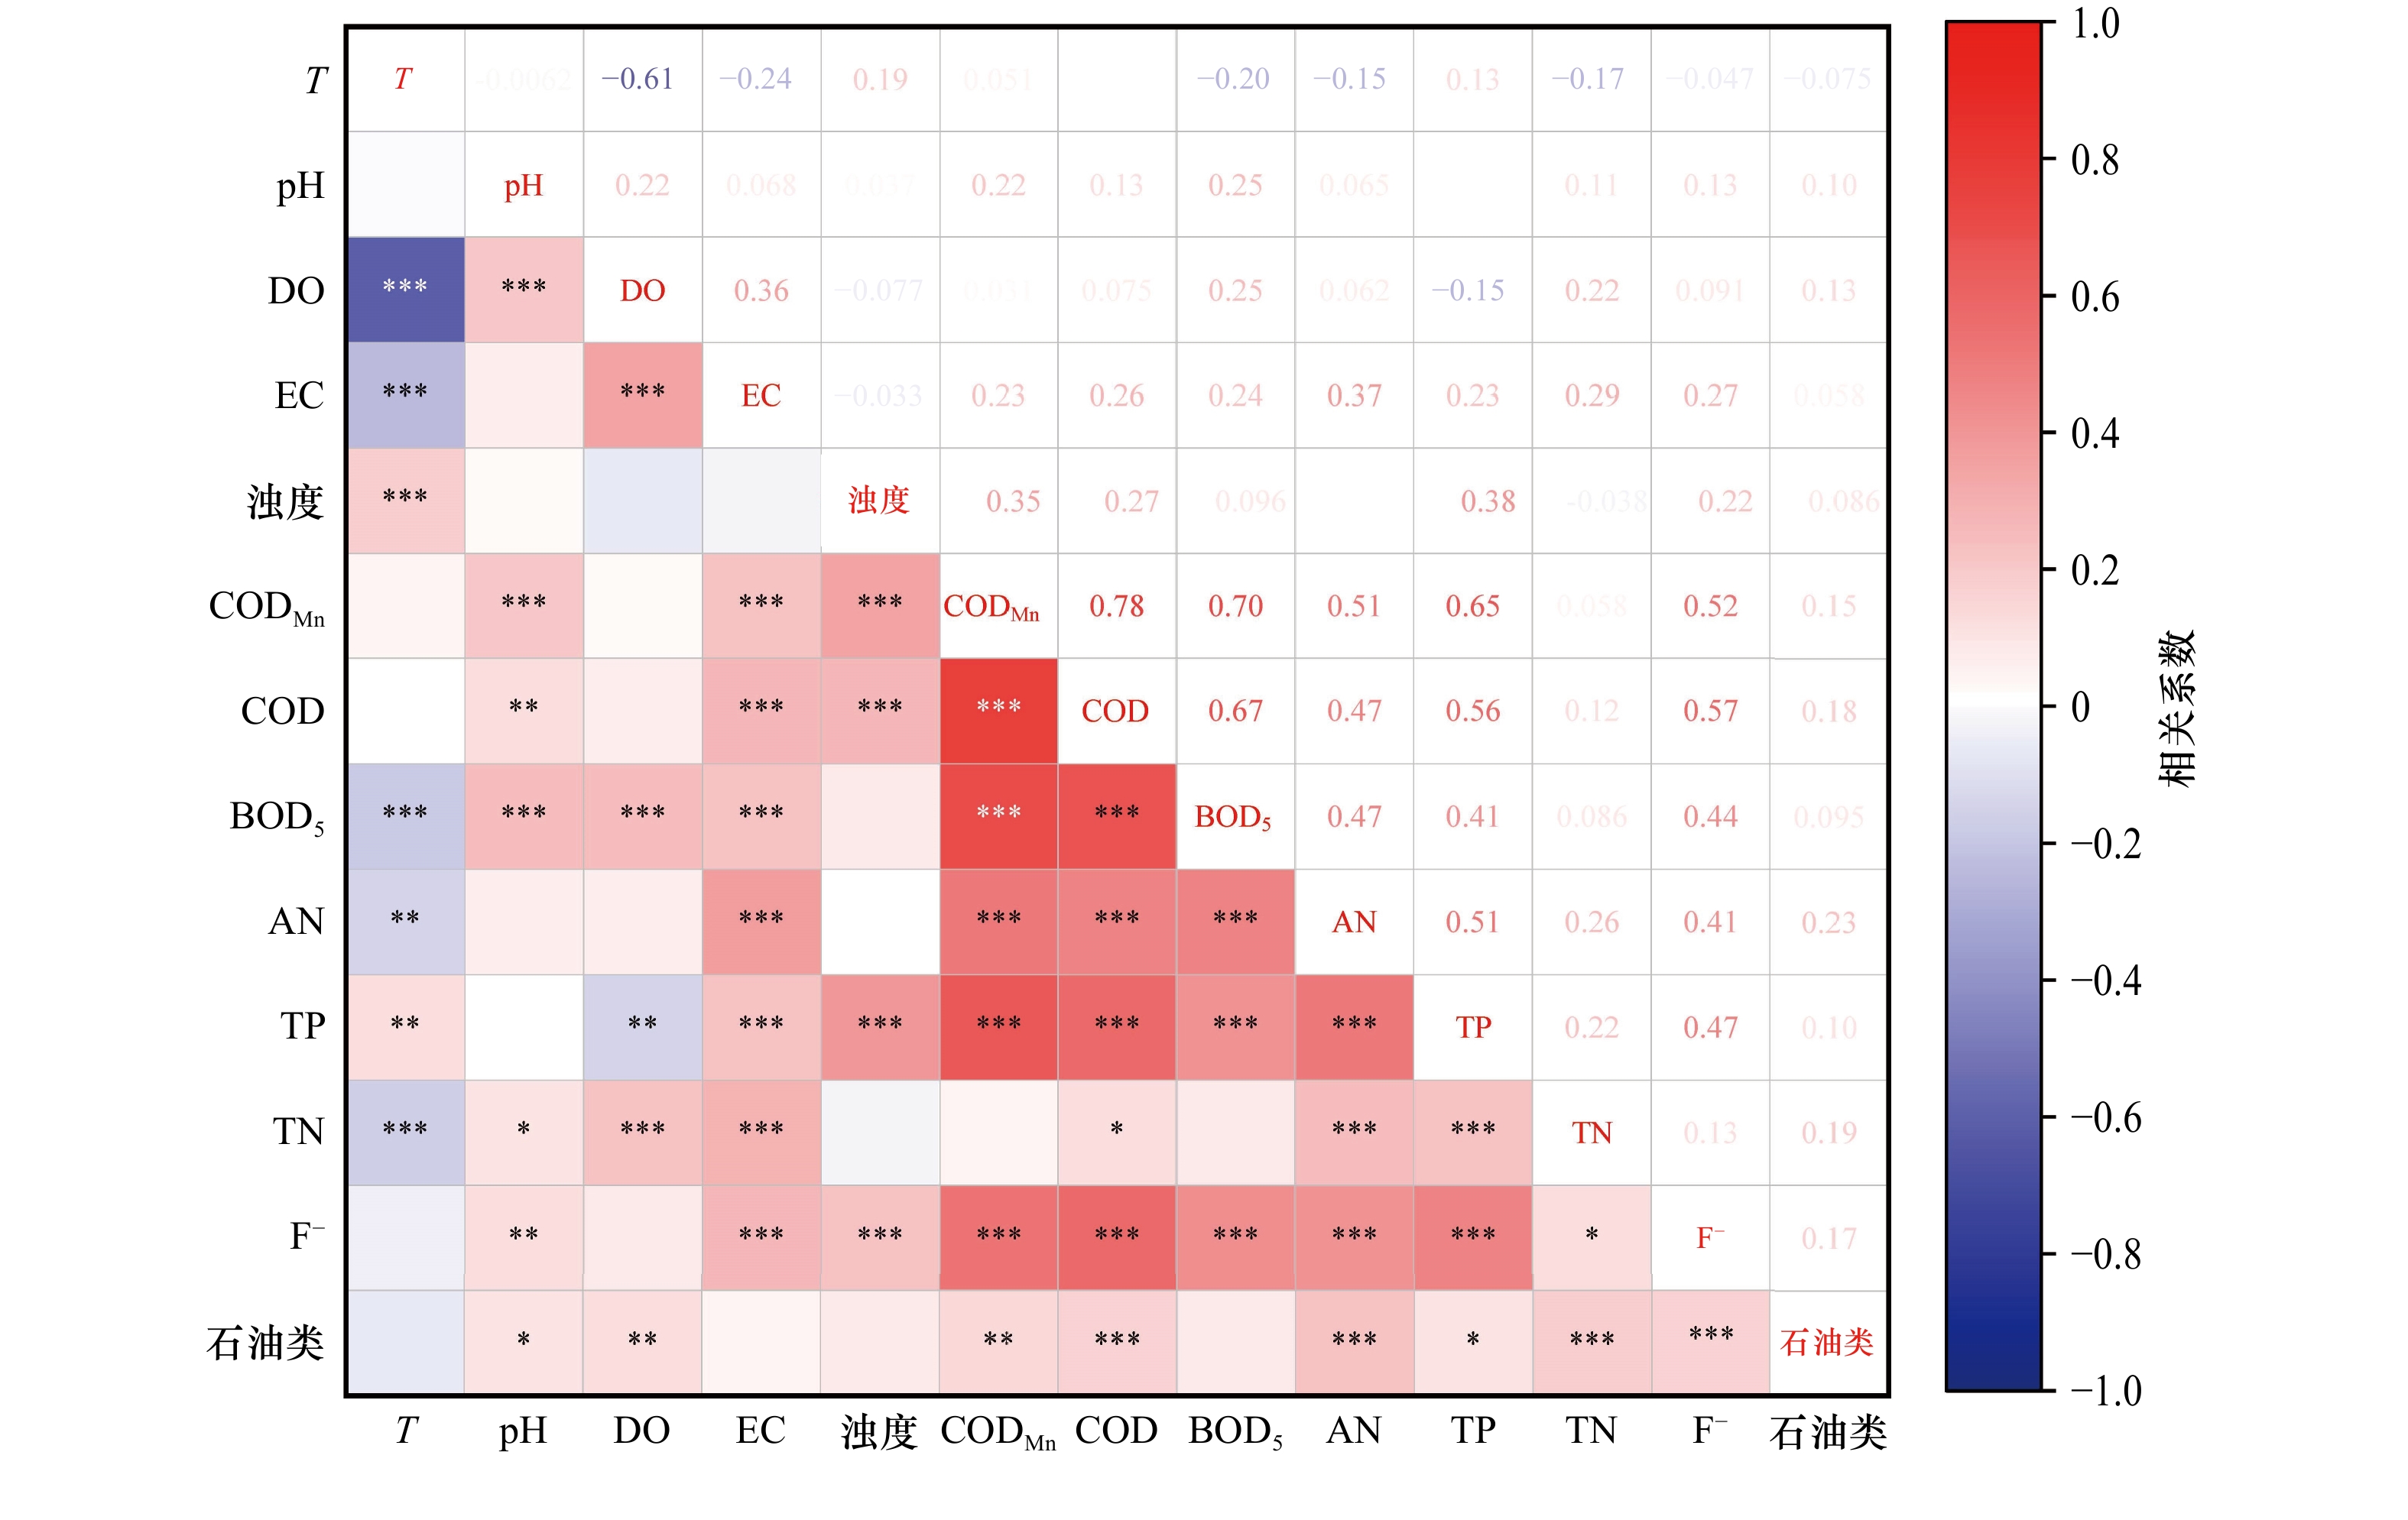
图 2 主要水质指标的Spearman相关关系
*代表p ≤ 0.05;**代表p ≤ 0.01;***代表p ≤ 0.001
Fig. 2 Spearman correlation among major pollutants in surface water
* Indicates p ≤ 0.05; ** indicates p ≤ 0.01; *** indicates p ≤ 0.001
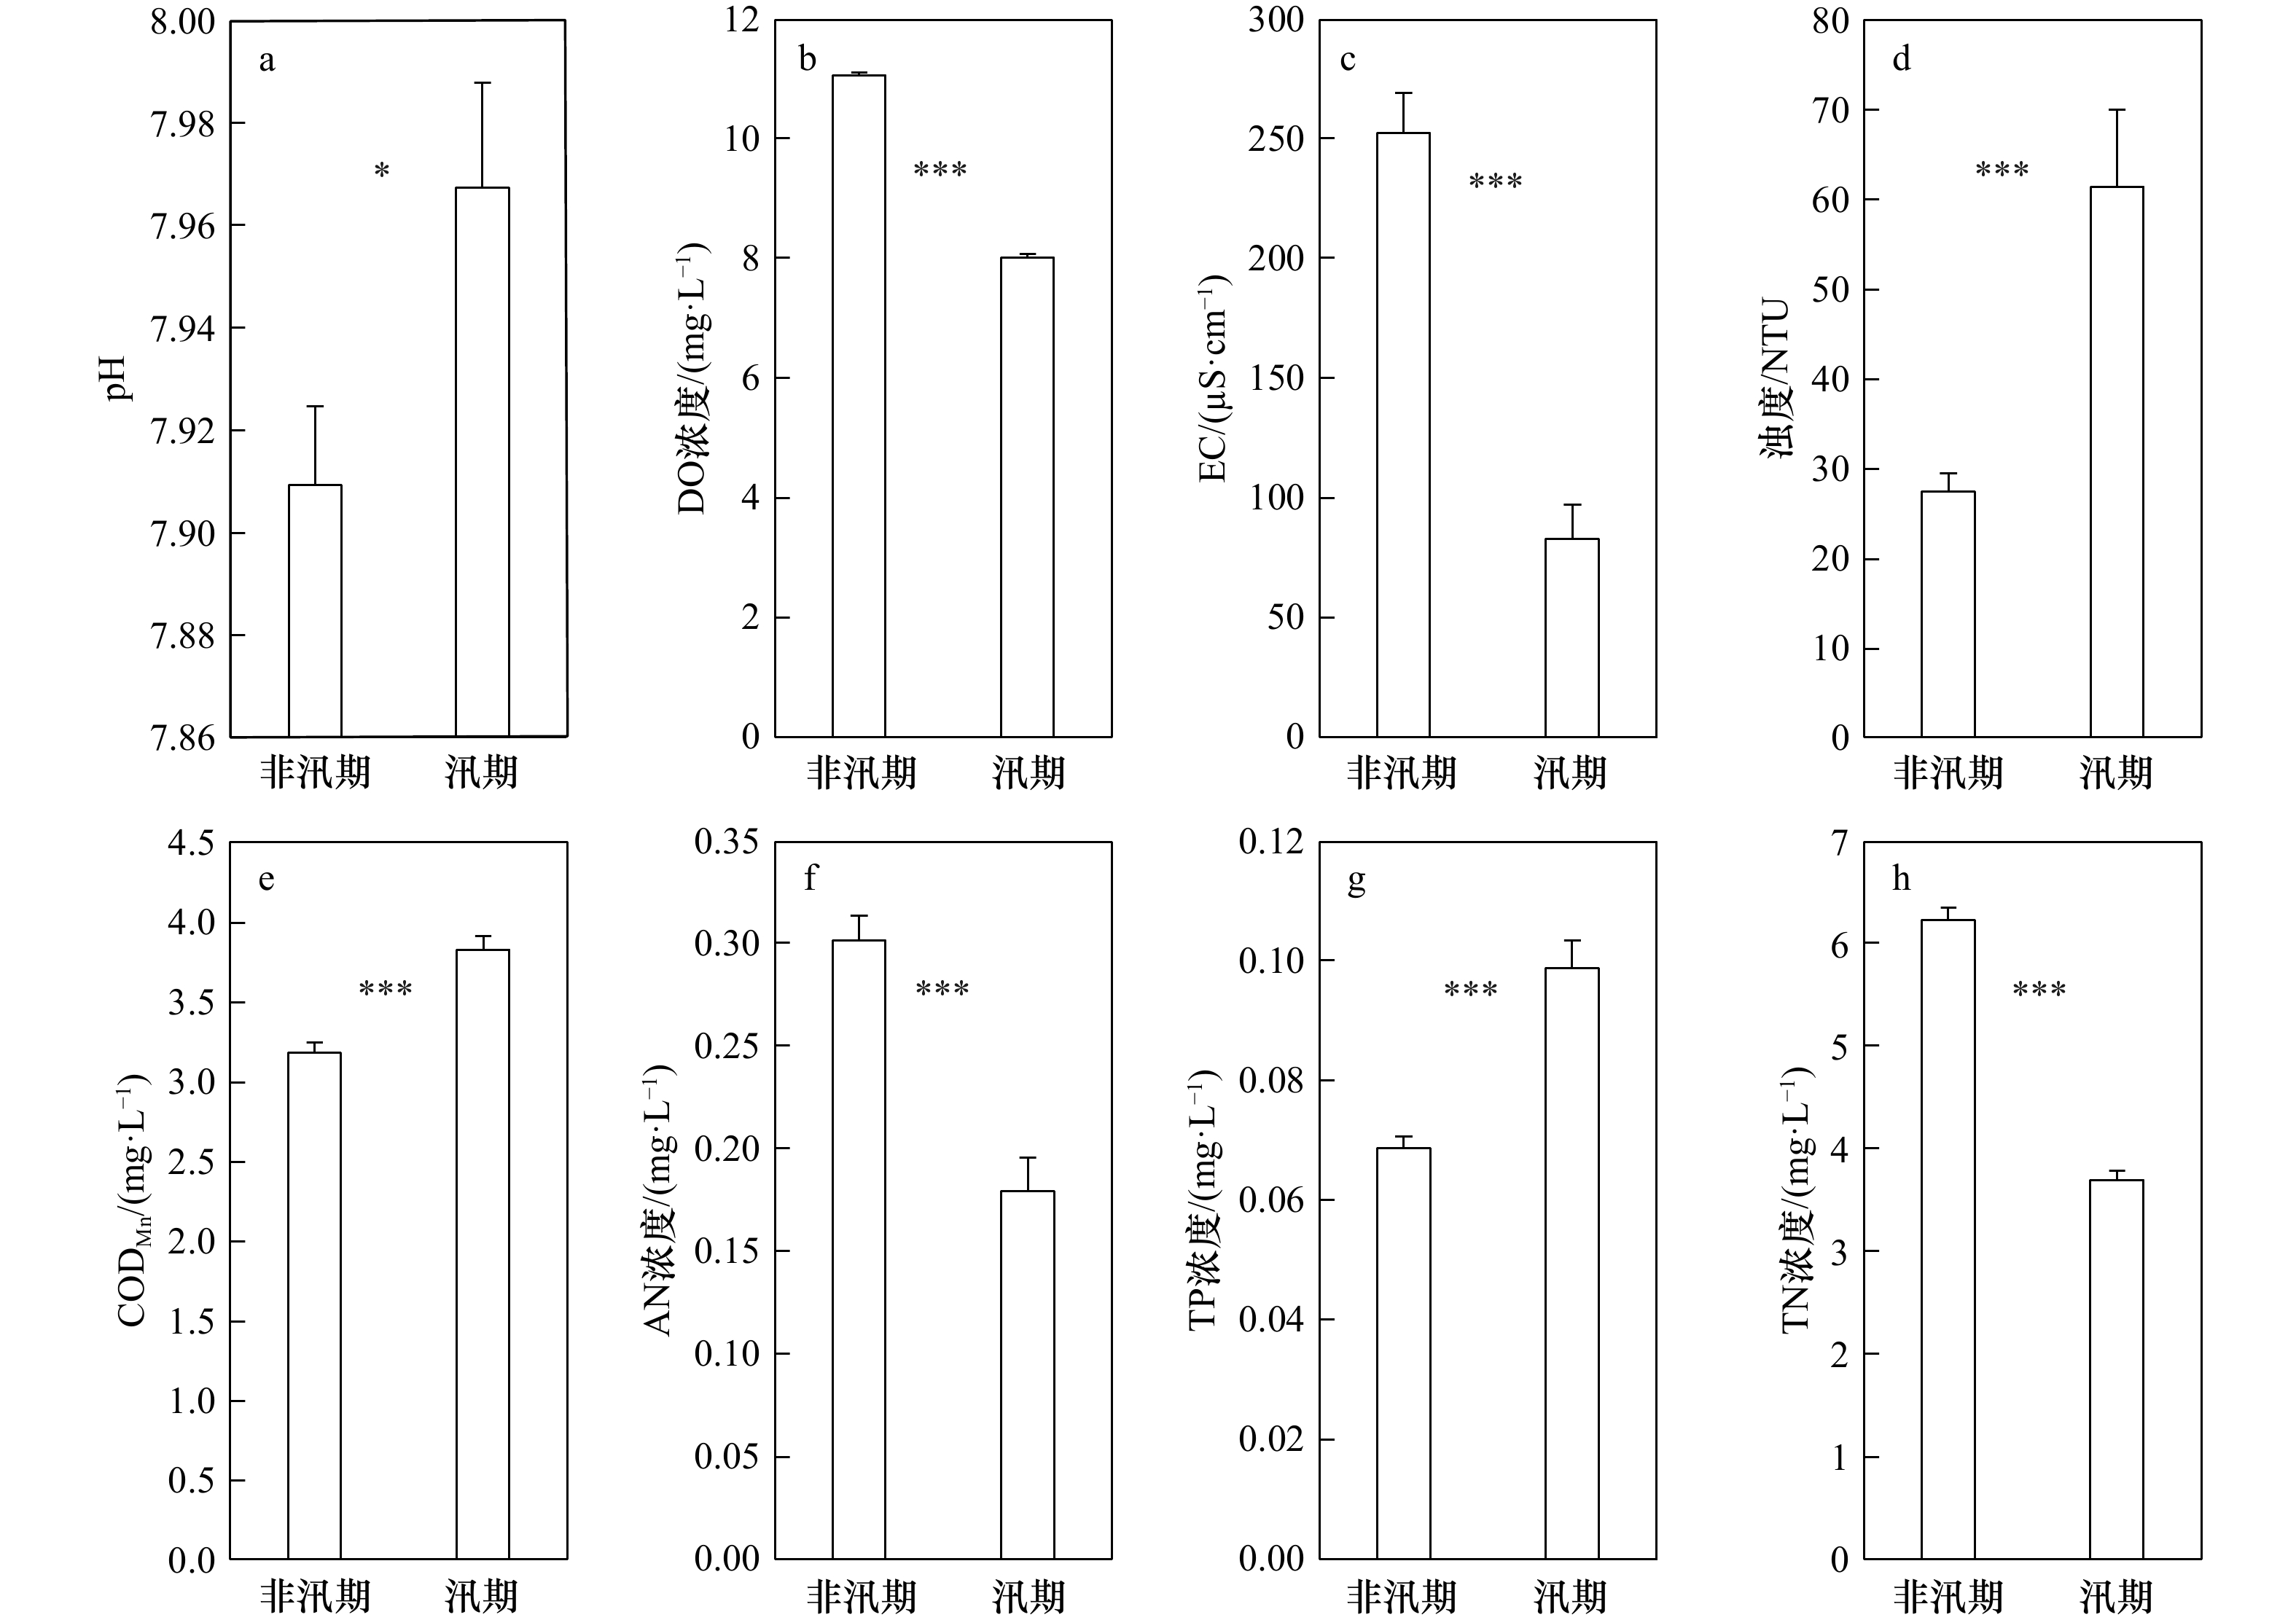
图 3 汛期和非汛期主要污染物指标
*和***分别表示p < 0.1和p < 0.001显著性水平
Fig. 3 Indicators of major pollutants in the wet and dry season
* and *** indicate the significance level of p < 0.1 and p < 0.001, respectively
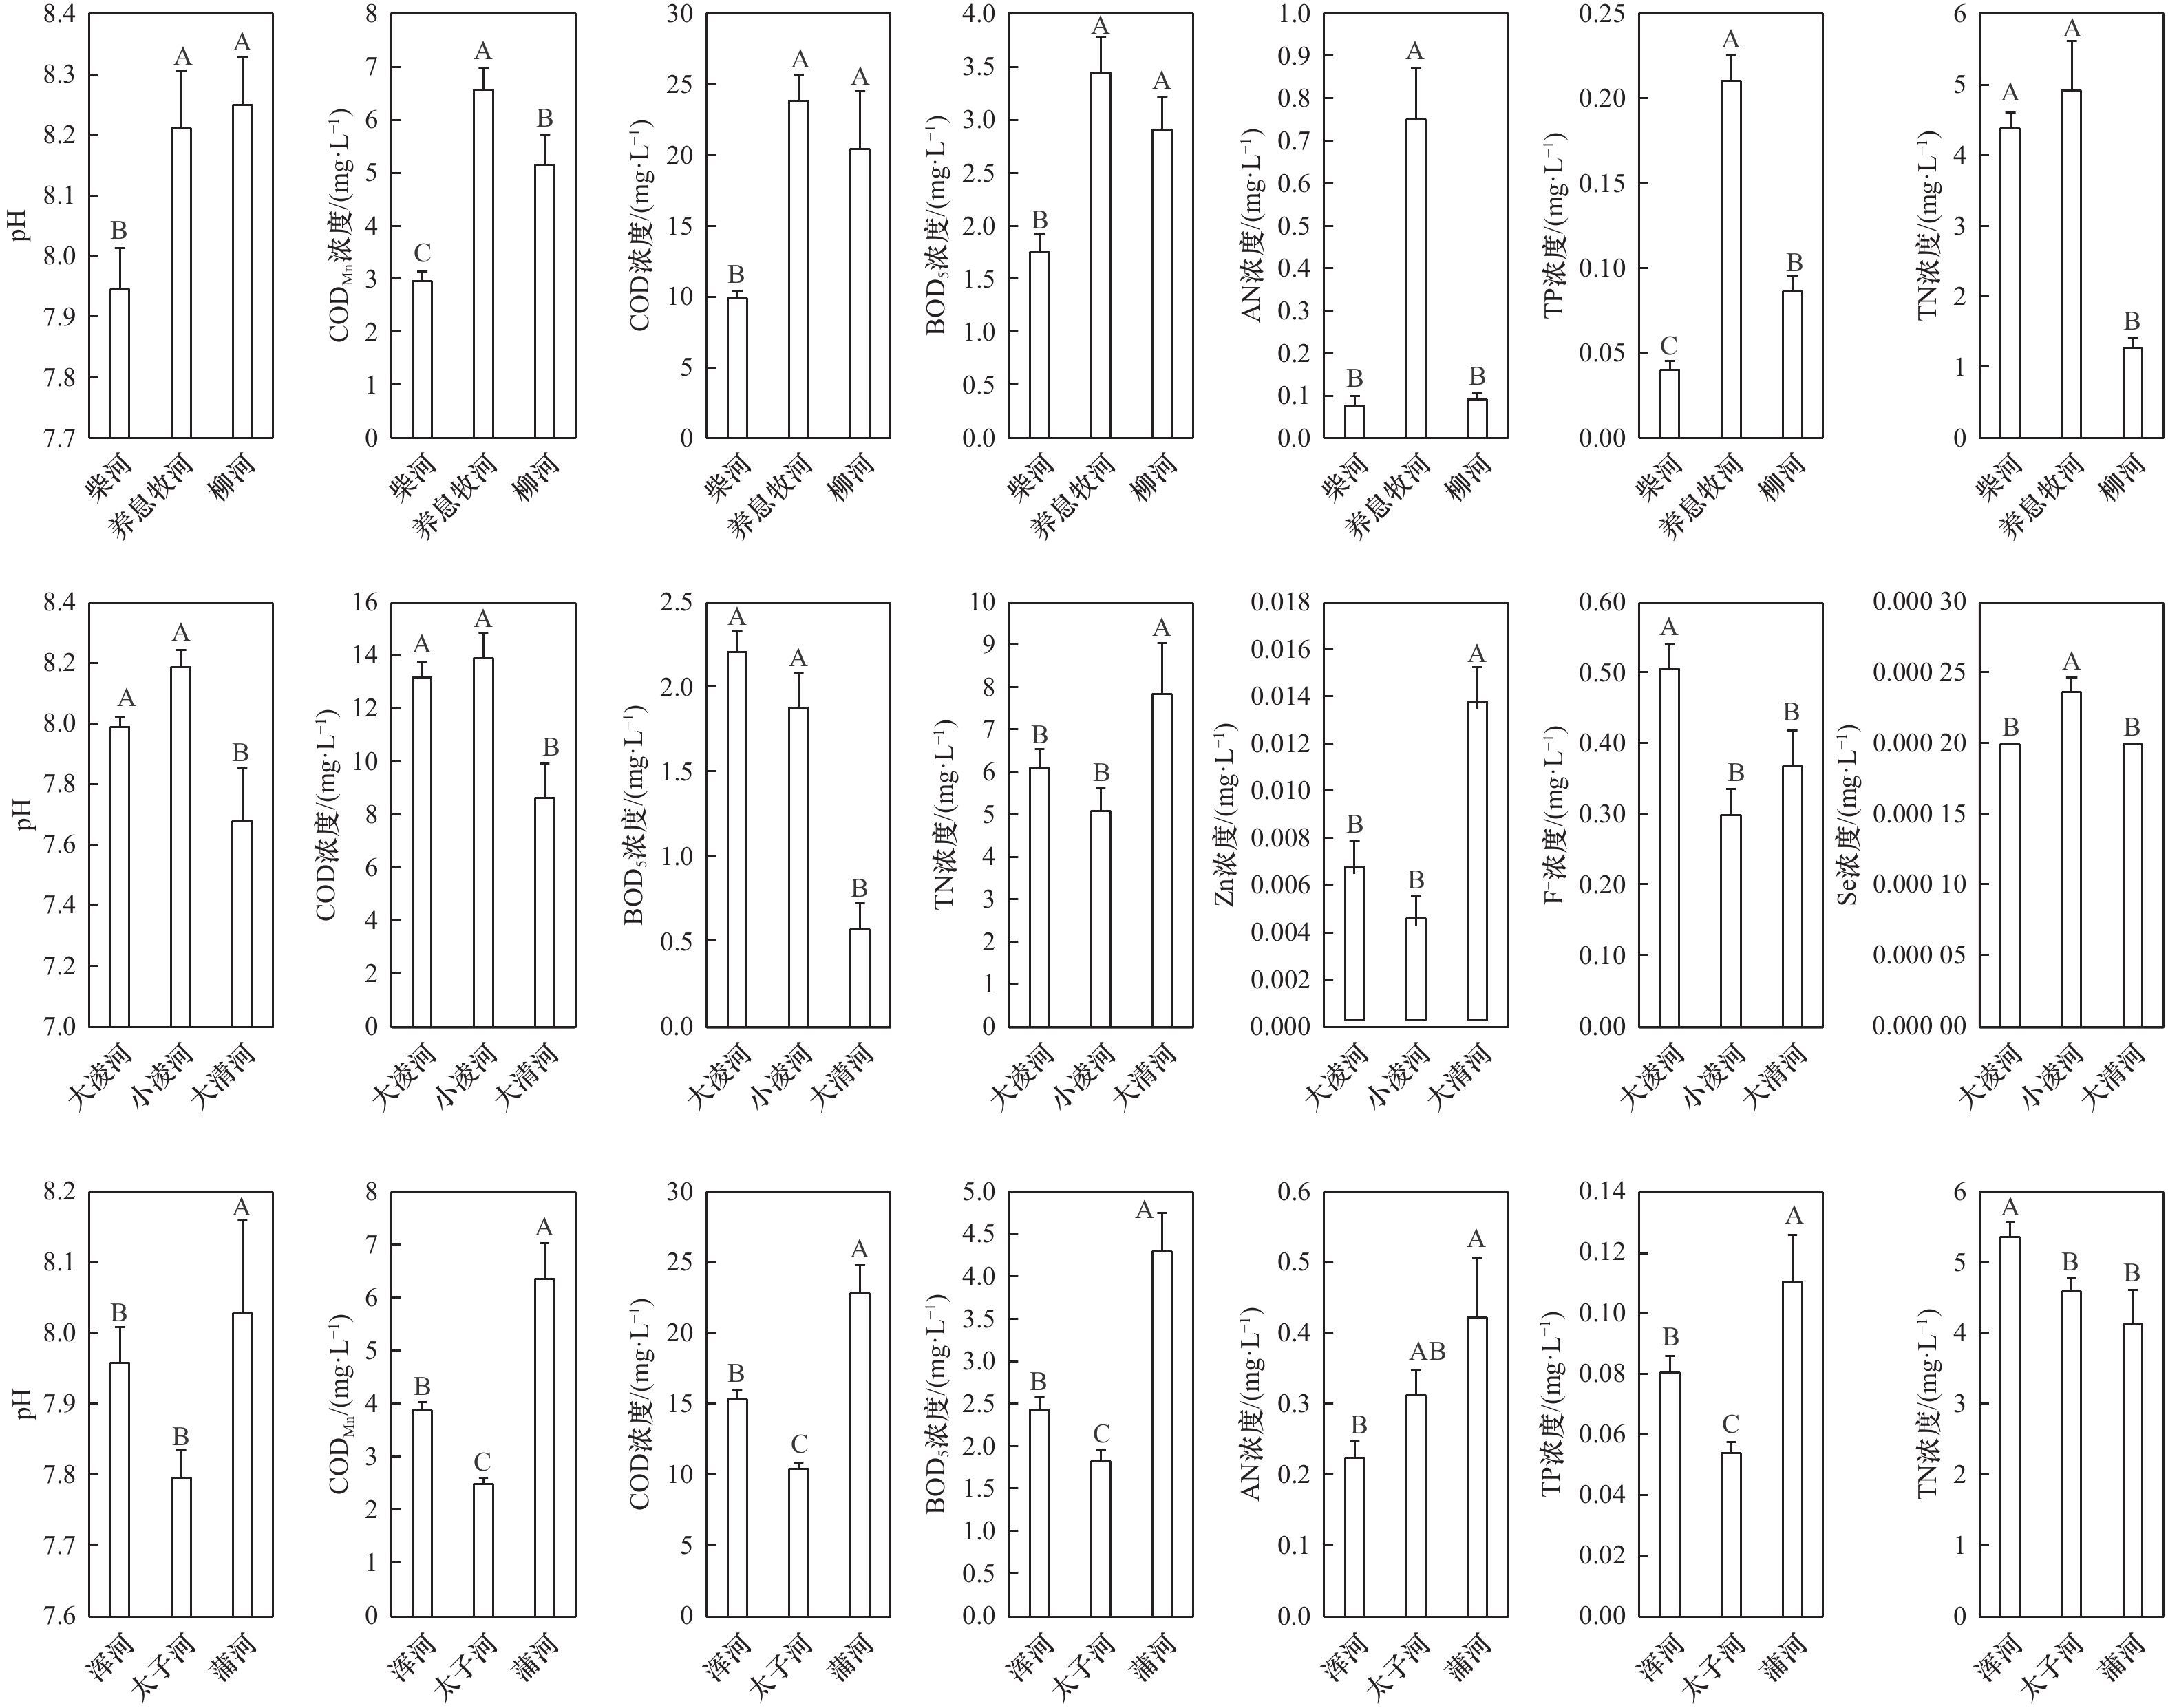
图 4 不同水系的主要河流污染物指标
字母相同表示差异不显著,字母不同表示差异显著(p < 0.05)
Fig. 4 Index in main rivers in pollutants different water system
Same uppercase letters indicate no significant differences and different uppercase letters indicate significant differences (p < 0.05)
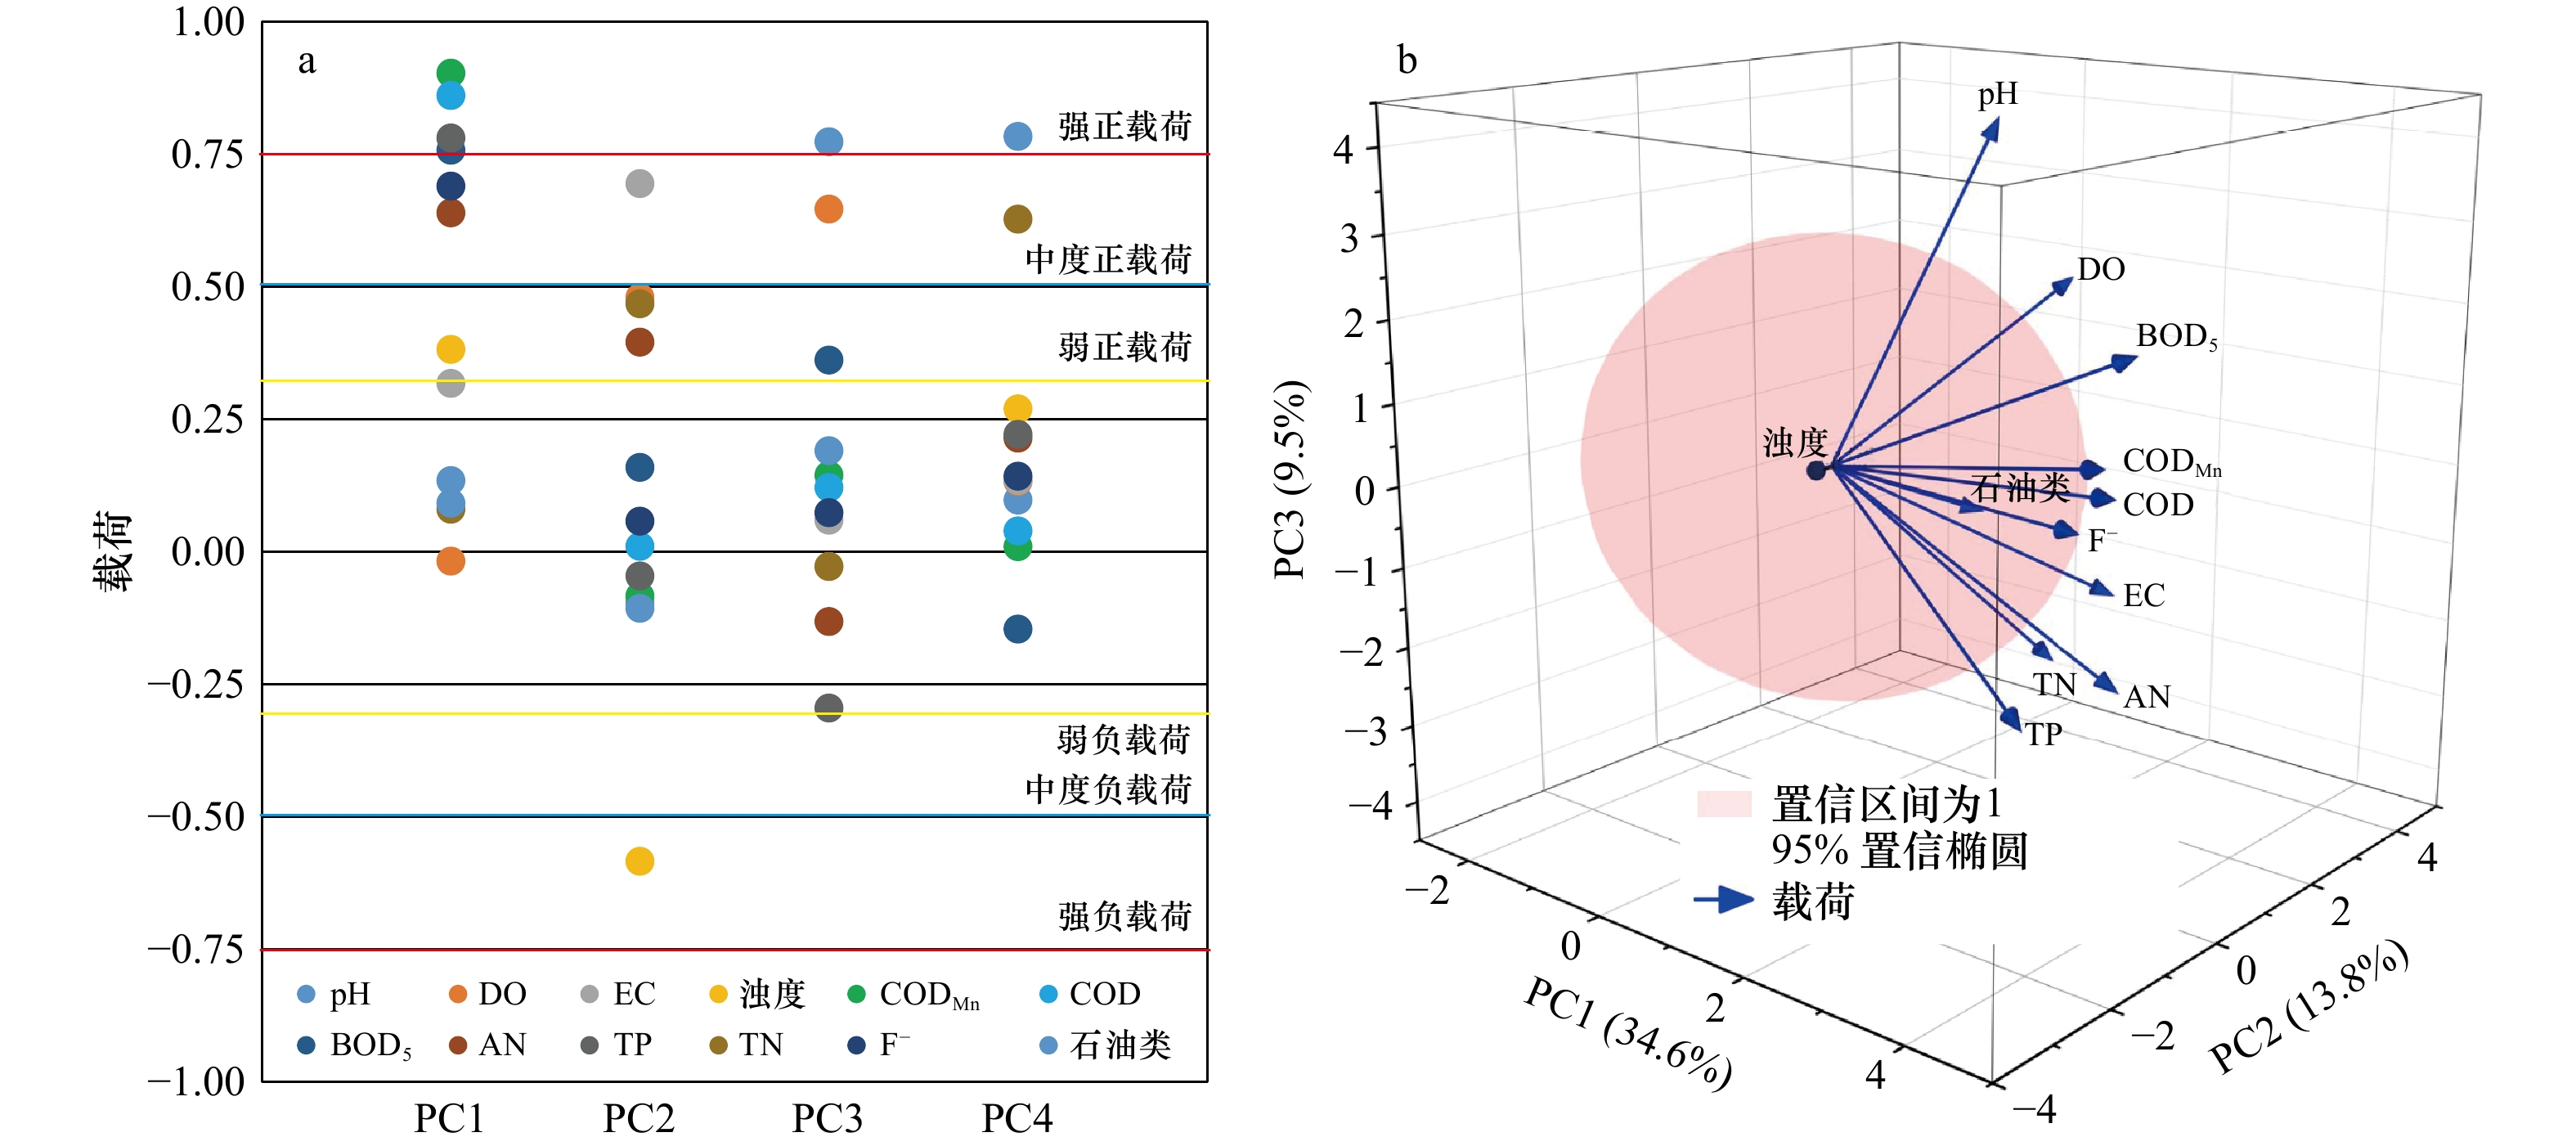
图 5 旋转后的成份载荷(a)和前3个主成分的载荷(b)
Fig. 5 Component loadings after varimax rotation (a) and loading plots of the first three components (b)
表 1 水质指标描述性统计
Tab. 1 Descriptive statistics of water quality parameters
均值 标准误 偏度 峰度 Kolmogorov-Smirnov Shapiro-Wilk T 12.8 0.2 0.13 −1.35 0.00 0.00 pH 7.9 0.0 −0.11 0.75 0.00 0.00 DO浓度 10.0 0.1 0.33 −0.03 0.03 0.04 EC 219.4 13.8 6.12 51.47 0.00 0.00 浊度 32.4 2.1 4.94 31.24 0.00 0.00 CODMn 3.4 0.0 1.78 5.66 0.00 0.00 COD浓度 14.2 0.2 2.80 27.99 0.00 0.00 BOD5浓度 2.1 0.0 1.67 4.72 0.00 0.00 AN浓度 0.26 0.01 4.58 42.31 0.00 0.00 TP浓度 0.079 0.002 6.27 104.62 0.00 0.00 TN浓度 5.4 0.1 2.30 9.11 0.00 0.00 Cu浓度 0.001 6 0.000 1 10.66 166.23 0.00 0.00 Zn浓度 0.017 0.001 6.42 66.06 0.00 0.00 F−浓度 0.401 0.009 1.29 1.74 0.00 0.00 Se浓度 0.000 2 0.000 0 8.48 81.61 0.00 0.00 As浓度 0.001 0 0.000 1 14.03 291.31 0.00 0.00 Hg浓度 0.000 02 0.000 00 3.33 10.74 0.00 0.00 Cd浓度 0.000 07 0.000 01 9.44 106.66 0.00 0.00 Cr6+浓度 0.003 0.000 5.39 33.16 0.00 0.00 Pb浓度 0.001 0.000 0.90 2.17 0.00 0.00 CN−浓度 0.002 0.000 10.02 127.46 0.00 0.00 挥发酚浓度 0.000 5 0.000 0 10.73 137.50 0.00 0.00 S2−浓度 0.003 0.000 15.19 267.18 0.00 0.00 石油类浓度 0.01 0.00 8.37 122.00 0.00 0.00 LAS浓度 0.03 0.00 3.28 12.12 0.00 0.00 注:T的单位为℃;EC得单位为μS/cm;浊度单位为NTU;pH无量纲;其他指标单位为mg/L。  下载: 导出CSV
表 2 2021年不同水区污染物浓度和入海通量
Tab. 2 Fluxes and concentrations of pollutants in the Liaohe River Basin in 2021
辽河水系 浑太河水系 东北沿渤海诸河 浓度/(mg·L−1) 通量/t 浓度/(mg·L−1) 通量/t 浓度/(mg·L−1) 通量/t COD 18.8 ± 1.3 59 760 19.7 ± 2.1 75 369 13.0 ± 0.9a 12 602 TN 8.63 ± 0.90 9 309 4.00 ± 0.43 23 934 7.66 ± 0.90 3021 AN 0.46 ± 0.09 585.9 0.23 ± 0.03 2 355.9 0.60 ± 0.06 144.8 TP 0.124 ± 0.011 473.4 0.178 ± 0.020 1 053.6 0.135 ± 0.016 81.5 石油类 0.010 ± 0.002 67.7 0.023 ± 0.011 145.0 0.016 ± 0.002 9.21 Hg 0.000 02 ± 0.000 00 0.135 0.000 05 ± 0.000 01 0.103 0.000 69 ± 0.000 39 0.026 Cd 0.000 11 ± 0.000 06 0.059 0.000 02 ± 0.000 00 0.135 0.000 13 ± 0.000 07 0.059 Pb 0.000 17 ± 0.000 08 0.518 0.000 18 ± 0.000 07 1.201 0.001 39 ± 0.000 35 0.259 As 0.002 32 ± 0.000 31 6.828 0.001 24 ± 0.000 55 6.419 0.001 49 ± 0.000 58 7.187 Cr6+ 0.014 1 ± 0.004 8 15.304 0.005 2 ± 0.002 0 12.425 0.003 0 ± 0.000 6 3.922 流域面积/km2 44 947 27 661 29 482 径流量/(108 m3) 29.0 51.7 6.85
下载: 导出CSV
表 3 解释方差及累计解释方差
Tab. 3 Explained variance and accumulative explained variance
成份 初始特征值 提取平方和载入 旋转平方和载入 合计 方差/% 累积/% 合计 方差/% 累积/% 合计 方差/% 累积/% 1 4.146 34.554 34.554 4.146 34.554 34.554 3.896 32.470 32.470 2 1.650 13.752 48.306 1.650 13.752 48.306 1.485 12.379 44.849 3 1.140 9.504 57.810 1.140 9.504 57.810 1.331 11.096 55.945 4 1.038 8.648 66.458 1.038 8.648 66.458 1.262 10.513 66.458 5 0.876 7.302 73.760 6 0.802 6.681 80.441 7 0.605 5.040 85.481 8 0.569 4.742 90.224 9 0.426 3.549 93.773 10 0.312 2.598 96.371 11 0.259 2.155 98.526 12 0.177 1.474 100.000
下载: 导出CSV
表 4 主成分的回归系数
Tab. 4 Coefficients of regression analysis of PCs
回归系数 标准化后回归系数 t值 p值 R2 常量 0.584 0.000 24.883 0.000 47 0.995 PC1 5.246 0.827 218.472 0.000 29 PC2 2.488 0.402 106.162 0.000 36 PC3 1.825 0.289 76.380 0.000 19 PC4 1.247 0.203 53.639 0.000 35
下载: 导出CSV
-
[1] 祝雅轩, 裴绍峰, 张海波, 等. 莱州湾营养盐和富营养化特征与研究进展[J]. 海洋地质前沿, 2019, 35(4): 1−9.Zhu Yaxuan, Pei Shaofeng, Zhang Haibo, et al. Characteristics and research progress of nutrients and eutrophication in Laizhou Bay, China[J]. Marine Geology Frontiers, 2019, 35(4): 1−9. [2] Wu Guanghong, Qin Renjie, Luo Wei. Polycyclic aromatic hydrocarbons (PAHs) in the Bohai Sea: a review of their distribution, sources, and risks[J]. Integrated Environmental Assessment and Management, 2022, 18(6): 1705−1721. doi: 10.1002/ieam.4600 [3] Sun Conghui, Wei Qi, Ma Lixia, et al. Trace metal pollution and carbon and nitrogen isotope tracing through the Yongdingxin River Estuary in Bohai Bay, northern China[J]. Marine Pollution Bulletin, 2017, 115(1/2): 451−458. [4] 吴光红, 李万庆, 郑洪起. 渤海天津近岸海域水污染特征分析[J]. 海洋学报, 2007, 29(2): 143−149.Wu Guanghong, Li Wanqing, Zheng Hongqi. Water pollution characteristics in Tianjin sea area of the Chinese Bohai Bay[J]. Haiyang Xuebao, 2007, 29(2): 143−149. [5] 吴念, 刘素美, 张桂玲. 黄河下游调水调沙与暴雨事件对营养盐输出通量的影响[J]. 海洋学报, 2017, 39(6): 114−128.Wu Nian, Liu Sumei, Zhang Guiling. Impacts of water-sediment regulation and rainstorm events on nutrient transports in the lower Huanghe River[J]. Haiyang Xuebao, 2017, 39(6): 114−128. [6] 陈月琴, 罗维, 孙聪慧, 等. 秦皇岛近岸海域潮间带砂质沉积物中微塑料和重金属污染特征[J]. 海洋学报, 2020, 42(4): 113−121.Chen Yueqin, Luo Wei, Sun Conghui, et al. Pollution characteristics of micro plastics and heavy metals in the intertidal zone sandy sediments of the offshore area of Qinhuangdao[J]. Haiyang Xuebao, 2020, 42(4): 113−121. [7] 松辽水利委员会. 2021年松辽流域水资源公报[R]. 沈阳: 松辽水利委员会, 2022: 1-6.Songliao River Water Resources Commission. Bulletin of water resources in Songliao Basin in 2021[R]. Shenyang: Songliao River Water Resources Commission, 2022: 1−6. [8] Haji Gholizadeh M, Melesse A M, Reddi L. Water quality assessment and apportionment of pollution sources using APCS-MLR and PMF receptor modeling techniques in three major rivers of South Florida[J]. Science of the Total Environment, 2016, 566−567: 1552−1567. doi: 10.1016/j.scitotenv.2016.06.046 [9] 中华人民共和国生态环境部. 2021年中国海洋生态环境状况公报[R/OL]. [2023−01−06]. https://english.mee.gov.cn/Resources/Reports/.Ministry of Ecology and Environment the People’s Republic of China. Bulletin of marine ecology and environment status of China in 2021[R/OL]. [2023−01−06]. https://english.mee.gov.cn/Resources/Reports/. [10] 杨建斌, 姚鹏, 张晓华. 南海北部神狐海域营养盐浓度与结构的分布特征及影响因素[J]. 海洋学报, 2020, 42(10): 132−143.Yang Jianbin, Yao Peng, Zhang Xiaohua. The distribution and controlling factors of the concentration and structure of dissolved inorganic nutrients in the Shenhu Area, northern South China Sea[J]. Haiyang Xuebao, 2020, 42(10): 132−143. [11] 杨永利. 辽河流域河流水质综合评价[J]. 水资源开发与管理, 2021(1): 28−32, 56.Yang Yongli. Comprehensive evaluation of river water quality in Liaohe River Basin[J]. Water Resources Development and Management, 2021(1): 28−32, 56. [12] 刘彦龙, 郑易安. 黄河干流水质评价与时空变化分析[J]. 环境科学, 2022, 43(3): 1332−1345.Liu Yanlong, Zheng Yian. Water quality assessment and spatial-temporal variation analysis in Yellow River Basin[J]. Environmental Science, 2022, 43(3): 1332−1345. [13] 赵紫涵, 宋贵生, 赵亮. 秦皇岛外海夏季溶解氧与pH的变化特征分析[J]. 海洋学报, 2020, 42(10): 144−154.Zhao Zihan, Song Guisheng, Zhao Liang. Characteristics of dissolved oxygen and pH variations in summer off the Qinhuangdao[J]. Haiyang Xuebao, 2020, 42(10): 144−154. [14] 杨凡, 杨正健, 纪道斌, 等. 三峡库区不同河段支流丰水期叶绿素a和营养盐的空间分布特征[J]. 环境科学, 2019, 40(11): 4944−4952.Yang Fan, Yang Zhengjian, Ji Daobin, et al. Spatial distribution characteristics of chlorophyll-a and nutrient salts in tributaries of different river sections in the Three Gorges Reservoir area during the flood season[J]. Environmental Science, 2019, 40(11): 4944−4952. [15] 毕业亮, 王华彩, 夏兵, 等. 雨源型城市河流水污染特征及水质联合评价: 以深圳龙岗河为例[J]. 环境科学, 2022, 43(2): 782−794.Bi Yeliang, Wang Huacai, Xia Bing, et al. Pollution characterization and comprehensive water quality assessment of rain-source river: a case study of the Longgang River in Shenzhen[J]. Environmental Science, 2022, 43(2): 782−794. [16] 冯爱萍, 王雪蕾, 徐逸, 等. 基于DPeRS模型的海河流域面源污染潜在风险评估[J]. 环境科学, 2020, 41(10): 4555−4563. doi: 10.13227/j.hjkx.201912077Feng Aiping, Wang Xuelei, Xu Yi, et al. Assessment of potential risk of diffuse pollution in Haihe River Basin based using DPeRS model[J]. Environmental Science, 2020, 41(10): 4555−4563. doi: 10.13227/j.hjkx.201912077 [17] 韩谞, 潘保柱, 陈越, 等. 黄河水环境特征与氮磷负荷时空分布[J]. 环境科学, 2021, 42(12): 5786−5795.Han Xu, Pan Baozhu, Chen Yue, et al. Characteristics of water environment and spatial-temporal distribution of nitrogen and phosphorus load in the Yellow River[J]. Environmental Science, 2021, 42(12): 5786−5795. [18] Lü Xiaoqian, Xu Hao, Zhao Sheng, et al. The green tide in Yingkou, China in summer 2021 was caused by a subtropical alga—Ulva meridionalis (Ulvophyceae, Chlorophyta)[J]. Journal of Oceanology and Limnology, 2022, 40(6): 2354−2363. doi: 10.1007/s00343-022-2014-4 [19] Chen Yueqin, Song Qiuyang, Pan Ling, et al. Trace metals, organic carbon and nutrients in the Beidagang Wetland Nature Reserve, northern China[J]. PLoS One, 2018, 13(10): e0204812. doi: 10.1371/journal.pone.0204812 [20] Chen Quanrui, Fan Jingfeng, Su Jie, et al. Spatial distribution characteristics of bacterial community structure and gene abundance in sediments of the Bohai Sea[J]. Acta Oceanologica Sinica, 2020, 39(2): 69−78. doi: 10.1007/s13131-020-1554-8 [21] 王菊英, 郑楠, 马德毅. 近海生态系统的人为营养盐输入及其控制对策浅析[J]. 海洋学报, 2020, 42(6): 1−8.Wang Juying, Zheng Nan, Ma Deyi. Anthropogenic inputs of nutrients to coastal ecosystem and mitigation actions[J]. Haiyang Xuebao, 2020, 42(6): 1−8. [22] 嵇晓燕, 侯欢欢, 王姗姗, 等. 近年全国地表水水质变化特征[J]. 环境科学, 2022, 43(10): 4419−4429.Ji Xiaoyan, Hou Huanhuan, Wang Shanshan, et al. Variation characteristics of surface water quality in China in recent years[J]. Environmental Science, 2022, 43(10): 4419−4429. -


计量
- 文章访问数: 543
- HTML全文浏览量: 186
- PDF下载量: 62
- 被引次数: 0
