

Seasonal variability and mechanism of marine heatwaves in the Bay of Bengal
-
摘要: 本文基于1982−2021年的NOAA最优插值海表温度等资料,分析了孟加拉湾海洋热浪季节分布特征与可能成因。结果表明:大致以斯里兰卡岛与缅甸伊洛瓦底江河口连线为界,孟加拉湾西北部与东南部海域海洋热浪频率和天数呈现出不同的季节变化特征。在湾西北部海域,海洋热浪频率和天数季节变化较显著,均在夏季达到最大,春、秋季次之,冬季最少。而在湾东南部海域,二者的季节变化相对较弱。依据海洋热浪累积强度将海洋热浪从弱至强分为I~IV4种等级。分析显示,I类和II类较弱海洋热浪主要发生于夏、秋季的湾西部或西北部海域;III类以上严重海洋热浪则多发于春季的安达曼海和湾东南部海域以及夏季的缅甸西南部海域。进一步分析表明,在春、夏和秋季大部分海洋热浪活跃区,较浅的混合层及海表净热通量的变化对这些海区海洋热浪活动可能起主要作用,而冬季湾东南部海域海洋热浪形成与维持可能主要与赤道远地强迫有关。Abstract: Based on the NOAA optimal interpolated sea surface temperature and other data from 1982 to 2021, seasonal variability of marine heatwave in the Bay of Bengal and associated formation mechanism were analyzed in this study. The results show that, bounded by the connection between Sri Lanka Island and the mouth of the Irrawaddy river in Myanmar, the frequency and days marine heatwave show different seasonal variation characteristics in the northwest and southeast of the Bay of Bengal. In the northwestern of the bay, both the frequency and the number of days of marine heatwaves are the largest in summer followed by spring and autumn, and the least in winter. In the southeastern of the bay, the seasonal variation of both is relatively weak. According to the cumulative intensity of marine heatwave, marine heatwaves are divided into four categories from weak to strong: I−IV. The analysis shows that the weak marine heatwave of category I and II mainly occurred in western or northwestern of the bay in summer and autumn; severe marine heatwaves of category 3 and above are mostly found in the Andaman Sea and the southeastern of the bay in spring and off southwestern Myanmar in summer. Further analysis shows that in most active areas of marine heatwaves in spring, summer and autumn, the change of net surface heat flux and the shallow mixed layer depth play a major role in these areas, while the formation and maintenance of marine heatwave in the southern of bay may be related to the remote forcing from the equator.
-
Key words:
- marine heatwave /
- Bay of Bengal /
- seasonal variability /
- mixed layer /
- formation mechanism
-
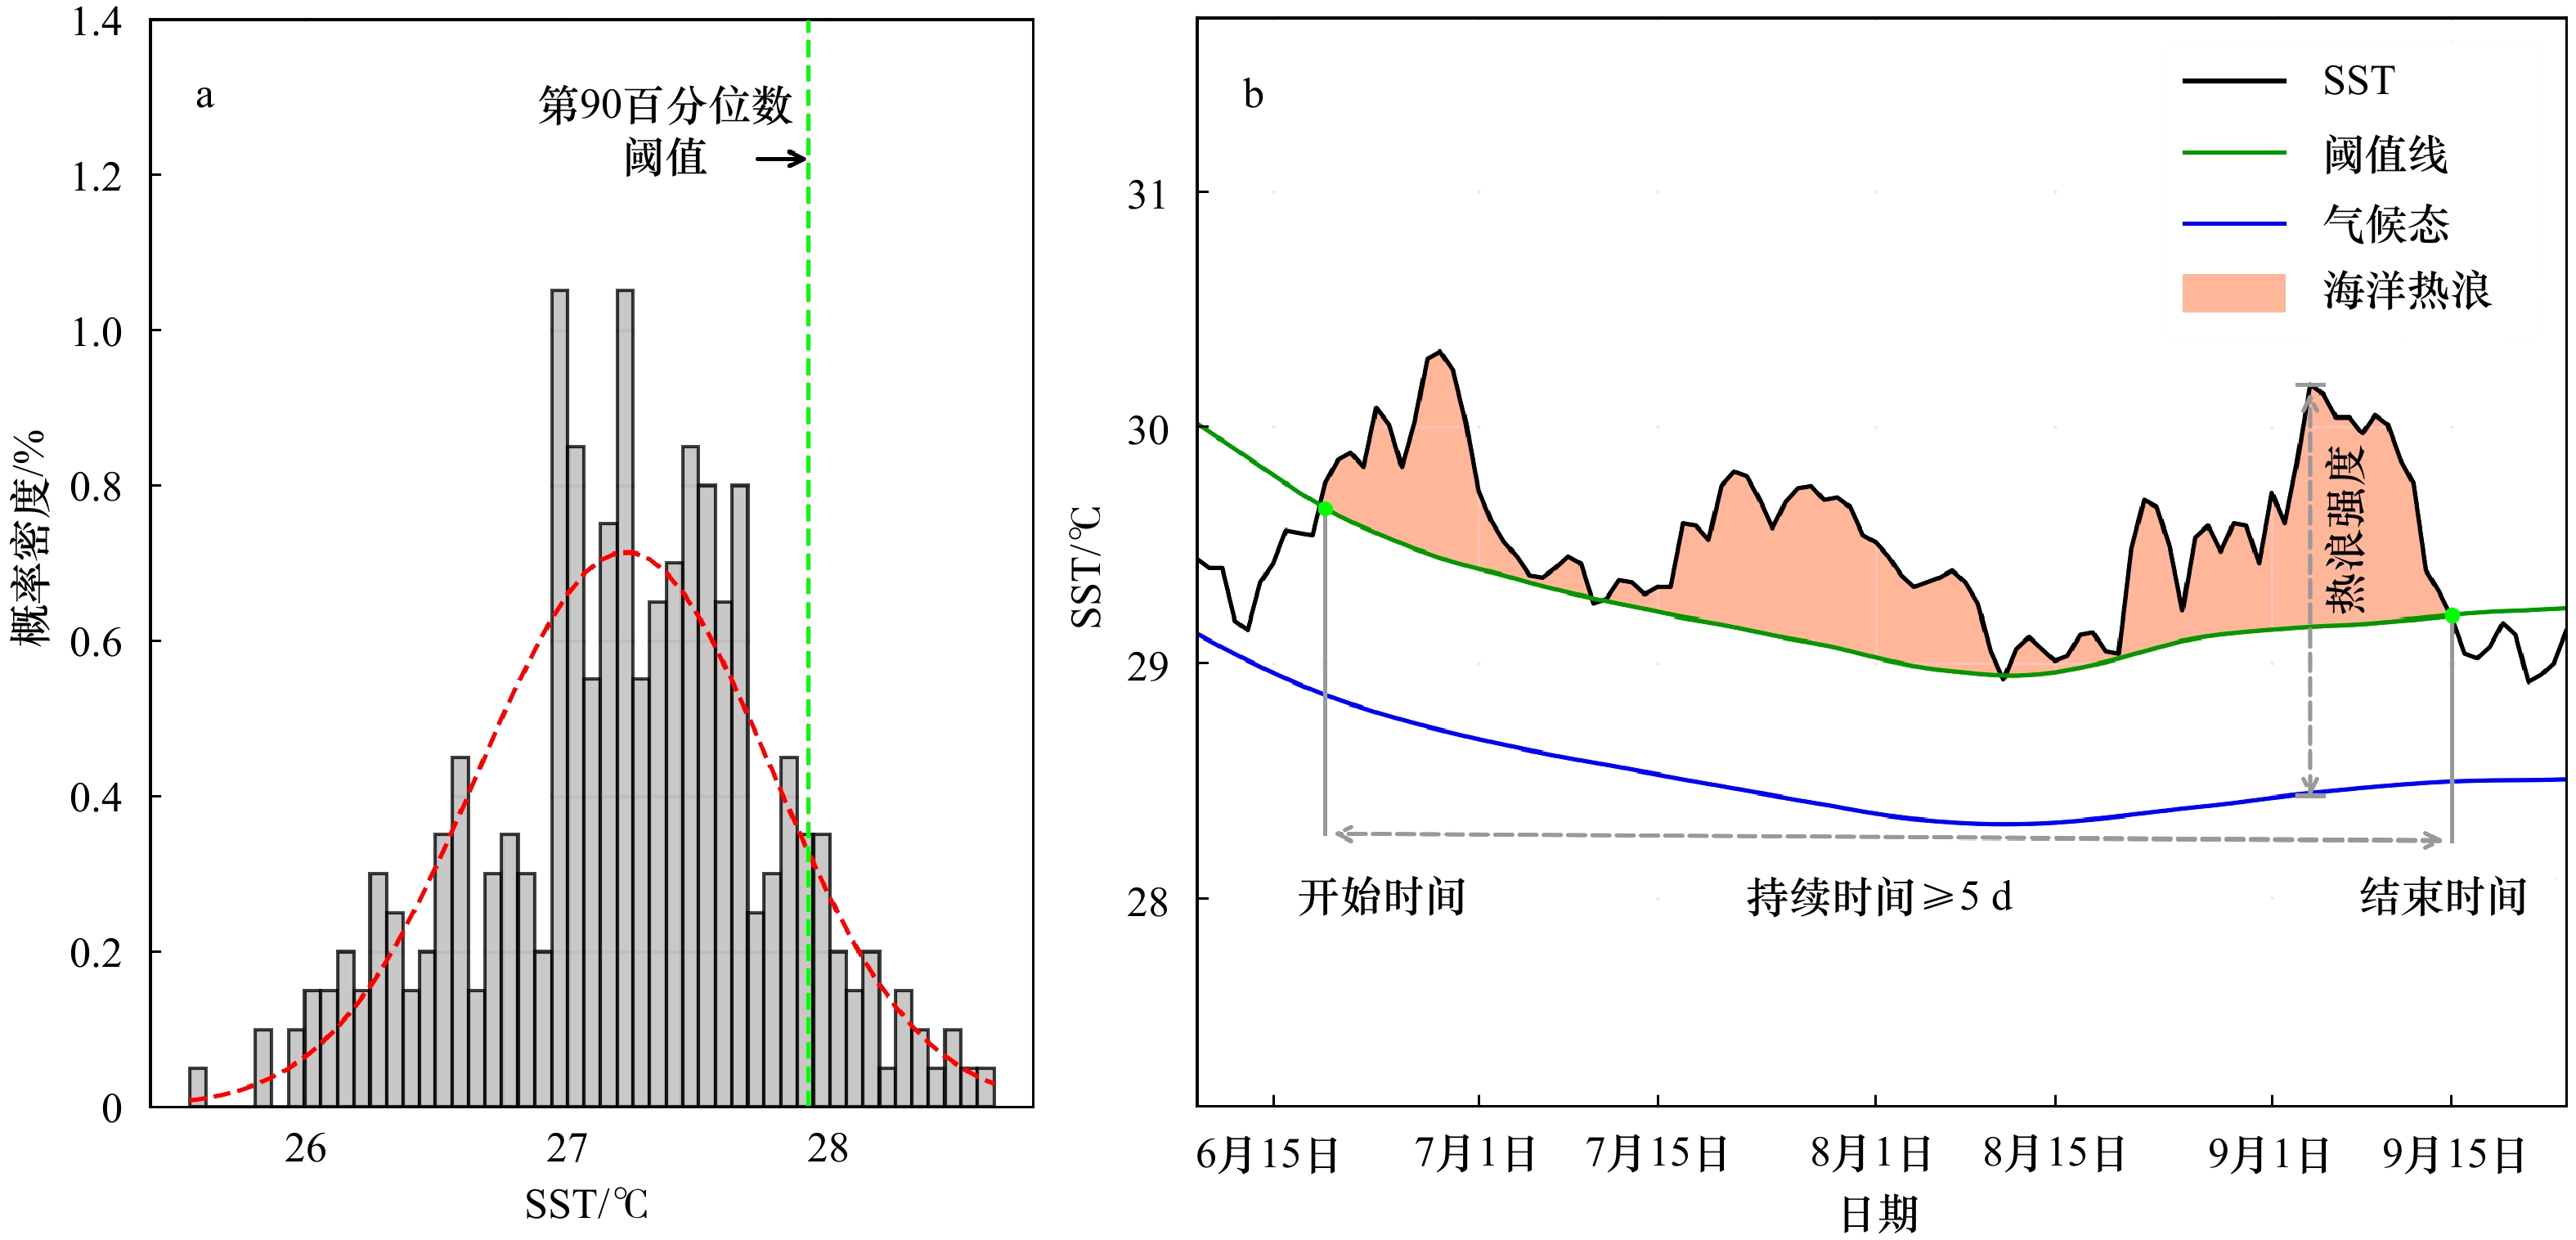
图 1 (11.125°N,89.125°E)的SST概率密度分布和一次MHW事件
a.1983−2012年2月10−15日在(11.125°N,89.125°E)的SST概率密度分布;b. 2020年6−9月发生在该网格点的一次MHW事件。a图中的红色虚线为SST的概率密度函数(PDF),绿色虚线为SST的第90百分位数阈值
Fig. 1 Probability density distribution of SST and a MHW event at 11.125°N, 89.125°E
a. Probability density distribution of SST from 10 to 15 February 1983−2012 at 11.125°N, 89.125°E; b. A MHW event occurred in June-September 2020 at this grid point. The red dashed line represents the probability density function (PDF) of SST, and the green dashed line is the 90th percentile threshold value of SST in Fig.a
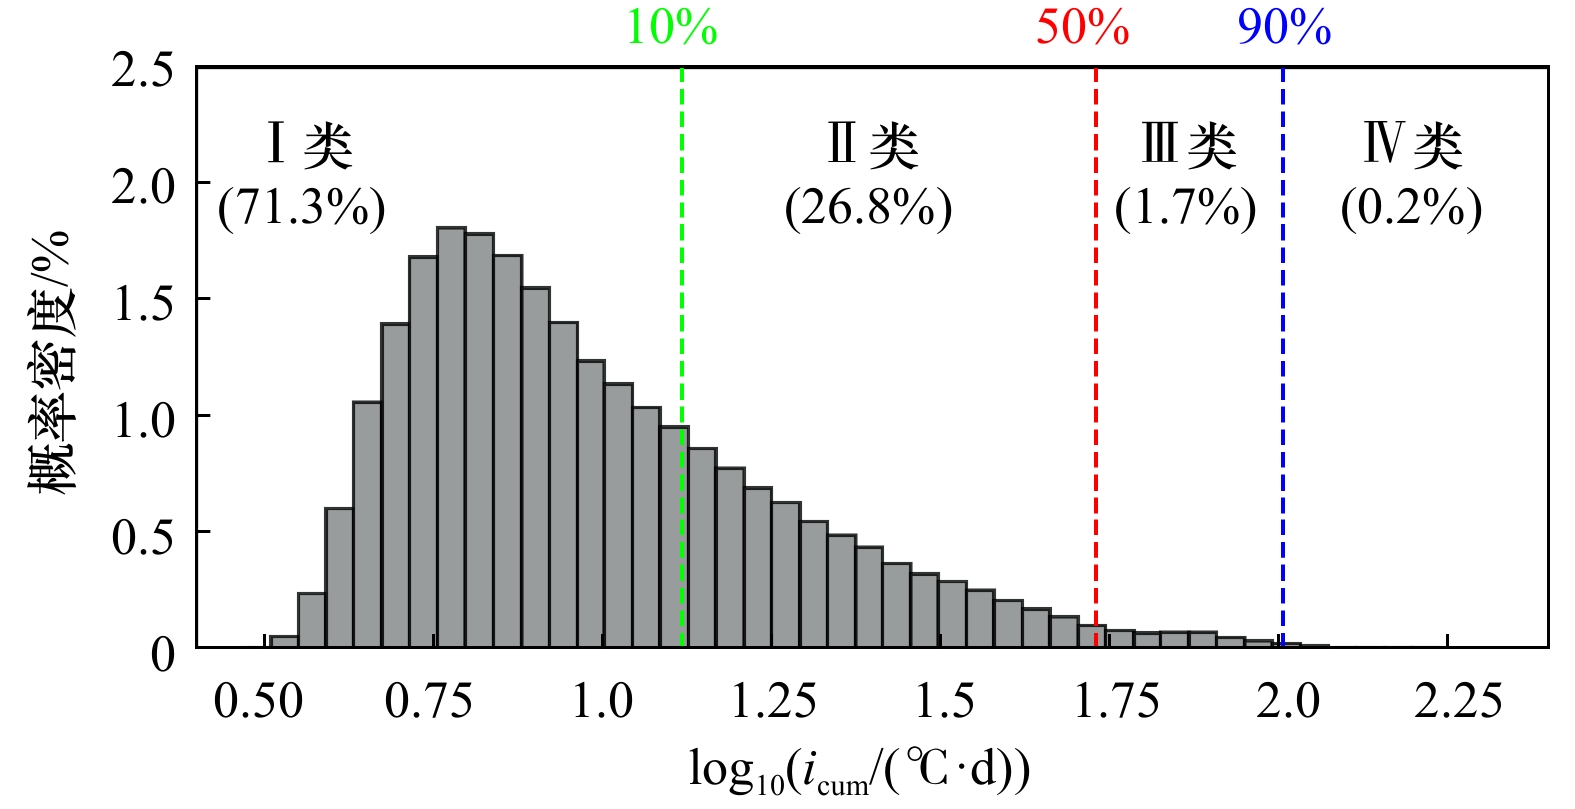
图 2 1982−2021年孟加拉湾(0.125°~23.875°N,78.125°~98.875°E)MHW累积强度(icum)的概率密度分布
图中绿线、红线和蓝线分别代表着累积强度的第10、50和90百分位阈值,括号中的百分数为4种等级MHW的发生频率
Fig. 2 Probability density distribution of cumulative intensity of MHW in the Bay of Bengal (0.125°~23.875°N,78.125°~98.875°E) from 1982 to 2021
The green, red, and blue lines represent the 10th, 50th, and 90th percentile thresholds of cumulative intensity, respectively, and the percentages in parentheses are the probability of occurrence of 4 MHW categories

图 3 1982−2021年孟加拉湾MHW年平均统计特征
Fig. 3 Annual mean statistical characteristics of MHW in the Bay of Bengal from 1982 to 2021
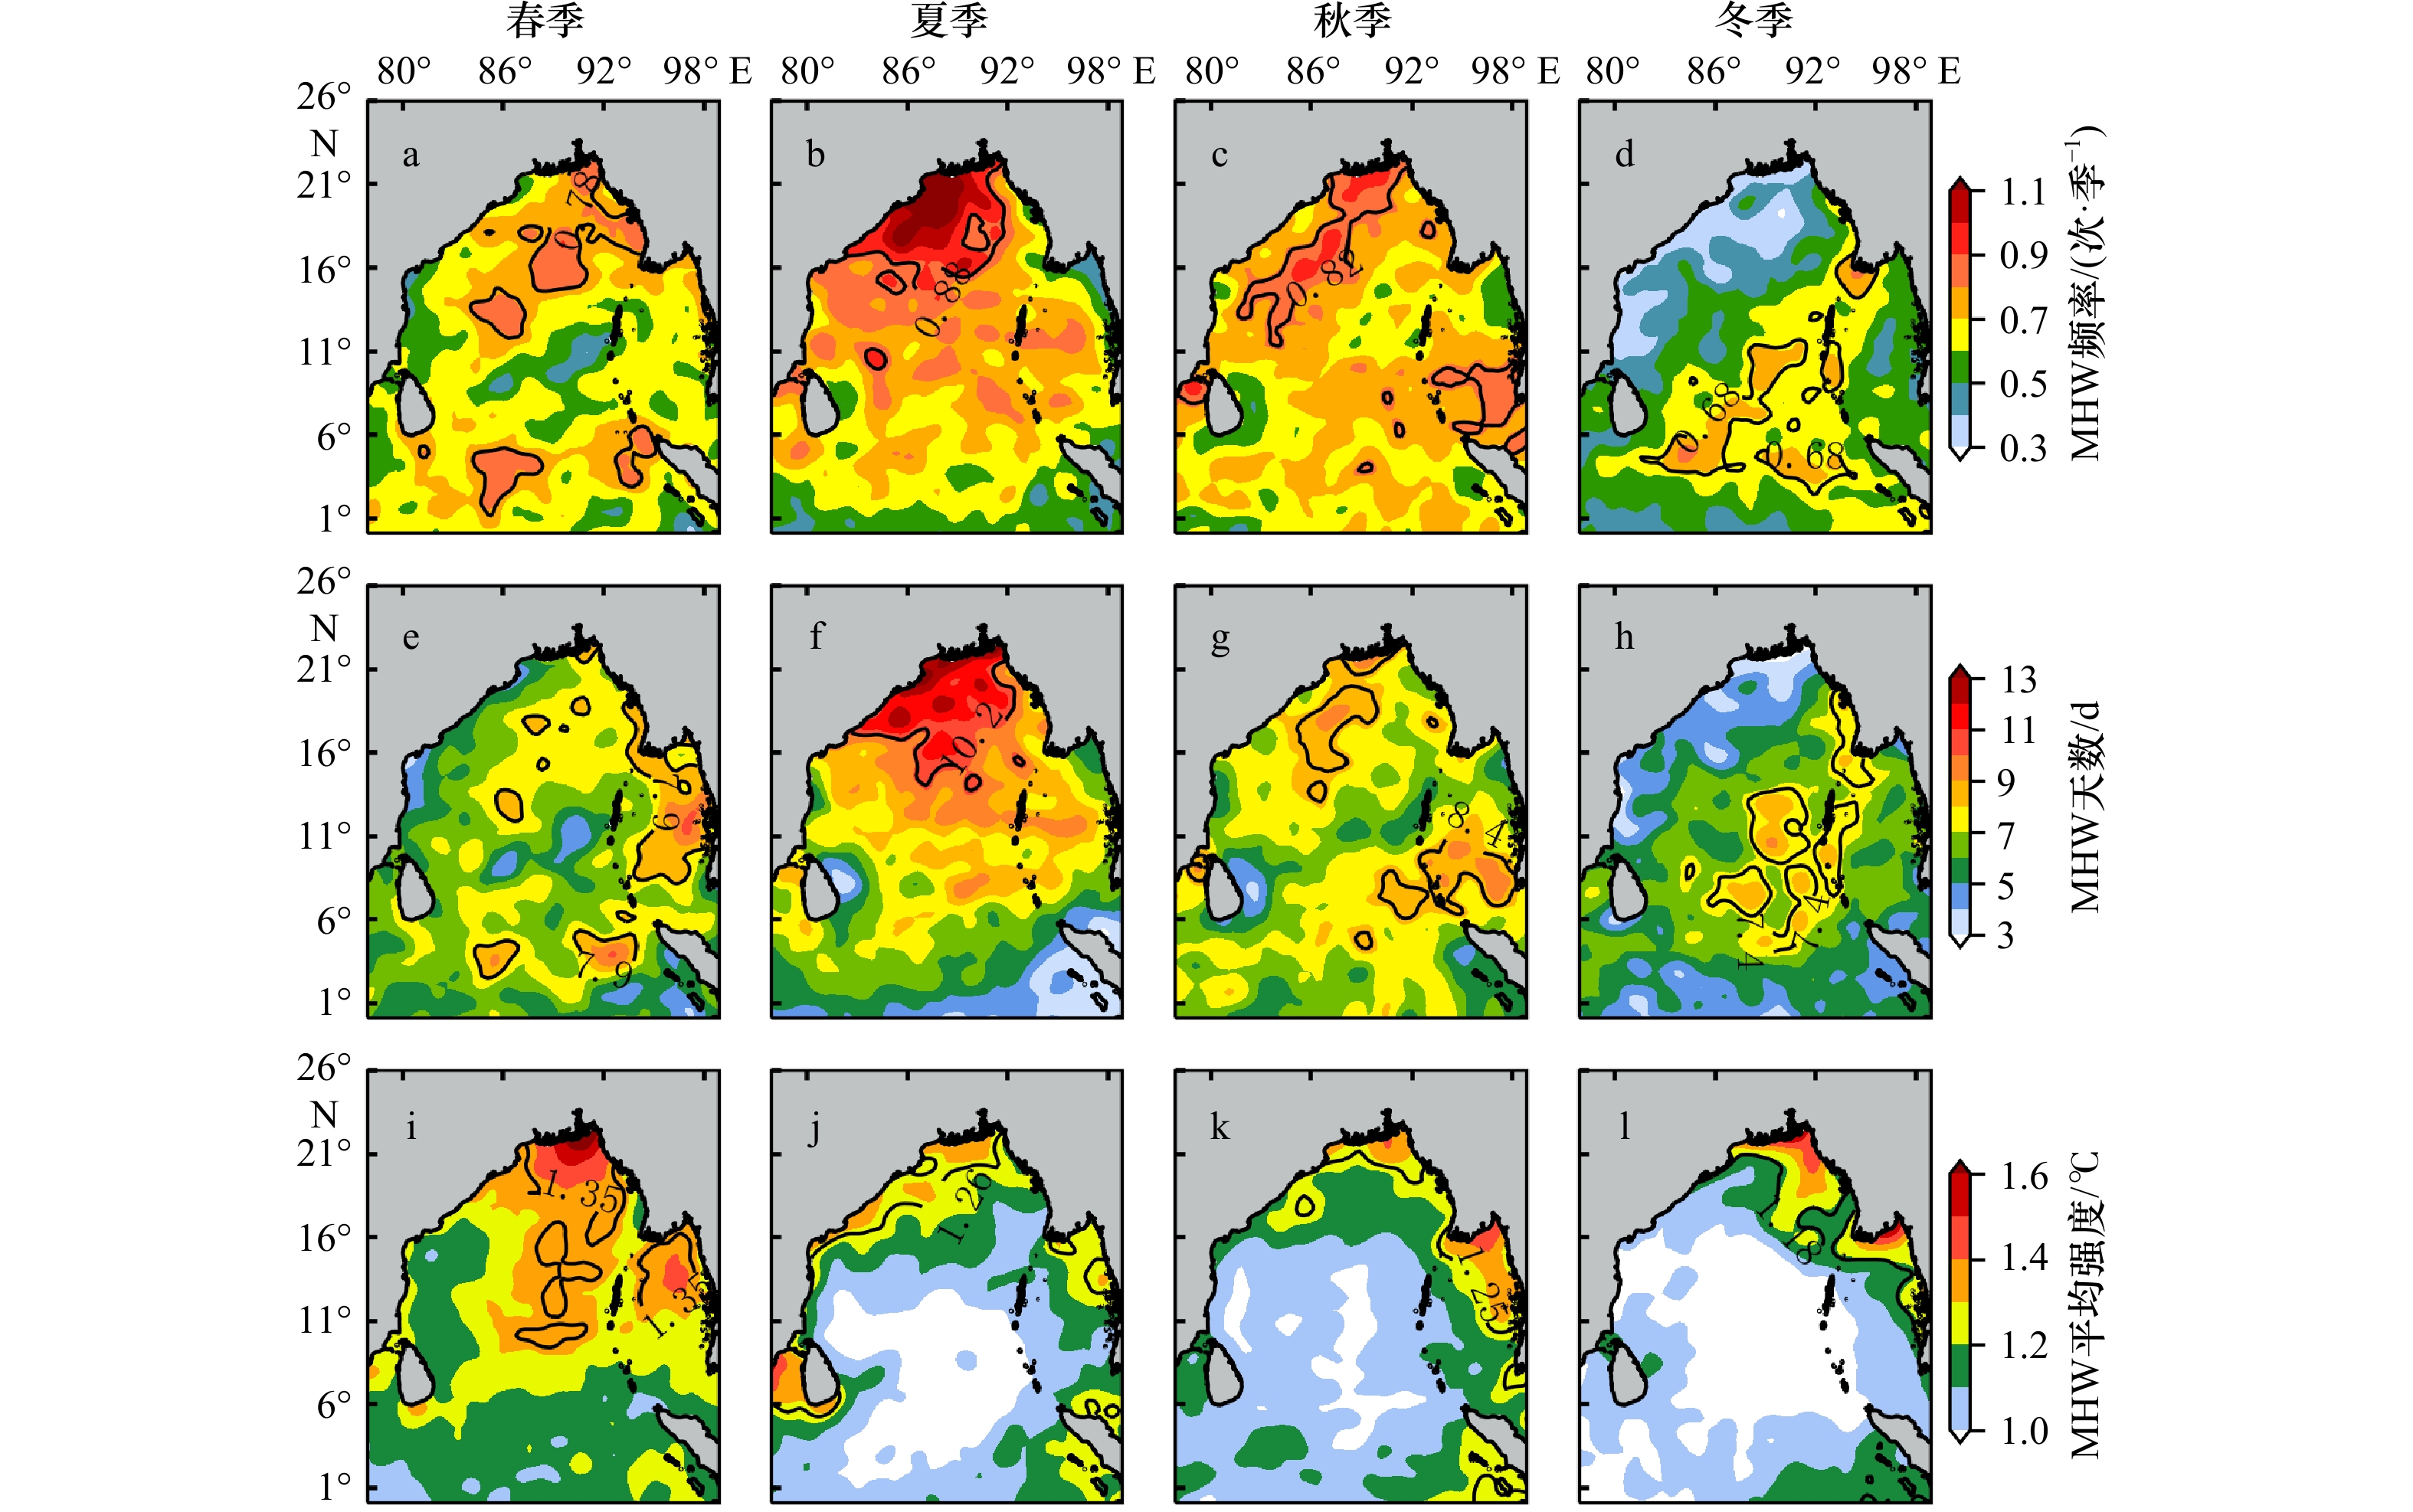
图 4 1982−2021年孟加拉湾 MHW频率(单位:次/季,a−d),天数(单位:d,e−h)和平均强度(单位:℃,i−l)的季节分布特征
图中黑色等值线为MHW各属性在孟加拉湾的第90百分数
Fig. 4 Seasonal distribution characteristics of MHW frequency (unit: count/q, a−d) total days (unit: d, e−h) and mean intensity (unit: °C, i−l) in the Bay of Bengal from 1982 to 2021
Black contours indicate the 90th percentile of each attribute of MHW in the Bay of Bengal
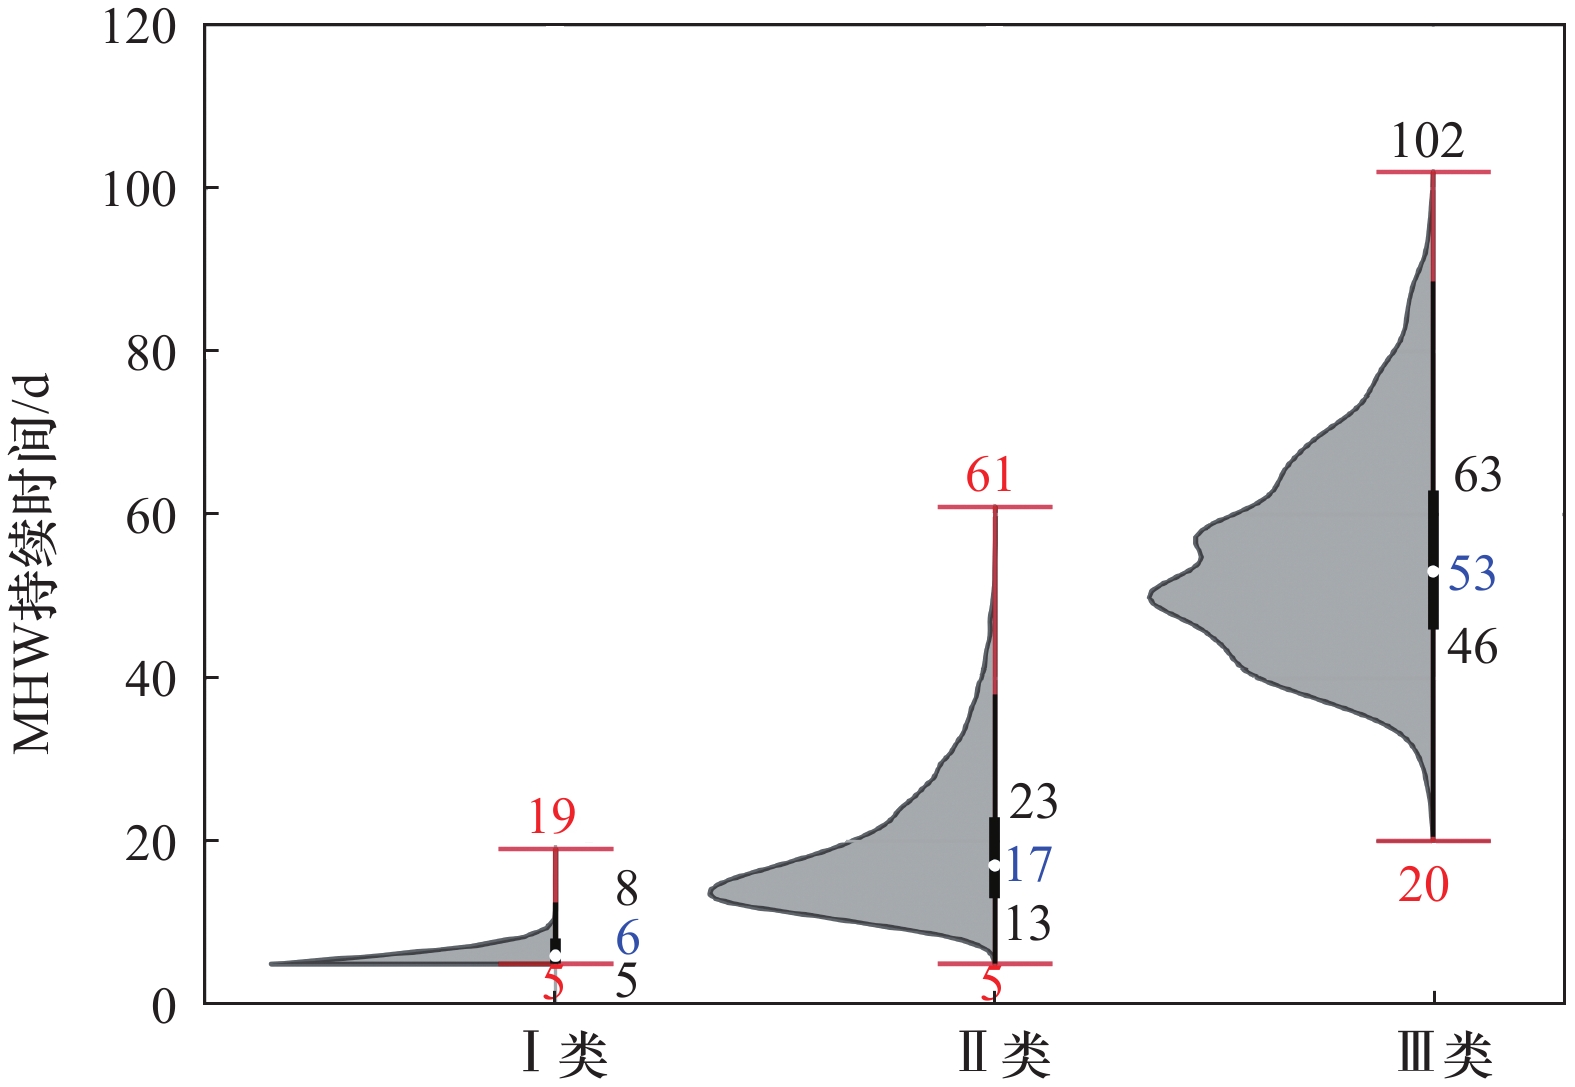
图 5 1982−2021年孟加拉湾(0.125°~23.875°N,78.125°~98.875°E) 3种等级MHW持续时间的概率密度分布
图中红色垂直线和红色数字为MHW持续时间的范围及其最大和最小值,垂直黑色粗线及其上下对应的黑色数字为MHW持续时间的四分数间距和上下四分位数,白色点和蓝色数字代表着MHW持续时间的中位数。持续时间概率密度的区间分辨率为1 d
Fig. 5 Probability density distribution of duration of 3 MHW categories in the Bay of Bengal (0.125°~23.875°N,78.125°~98.875°E) from 1982 to 2021
Red vertical line and red numbers are the range of MHW duration and its maximum and minimum values, the vertical black thick line and black numbers are the interquartile range and the upper and lower quartiles of MHW duration, white dots and blue numbers represents the median of MHW duration. The interval resolution of the duration probability density is 1 d

图 6 1982−2021年孟加拉湾 4种等级MHW发生的总次数的空间分布
图中白色海域代表无MHW发生
Fig. 6 Spatial distribution of occurrences of 4 MHW categories in the Bay of Bengal from 1982 to 2021
White areas represent no MHW
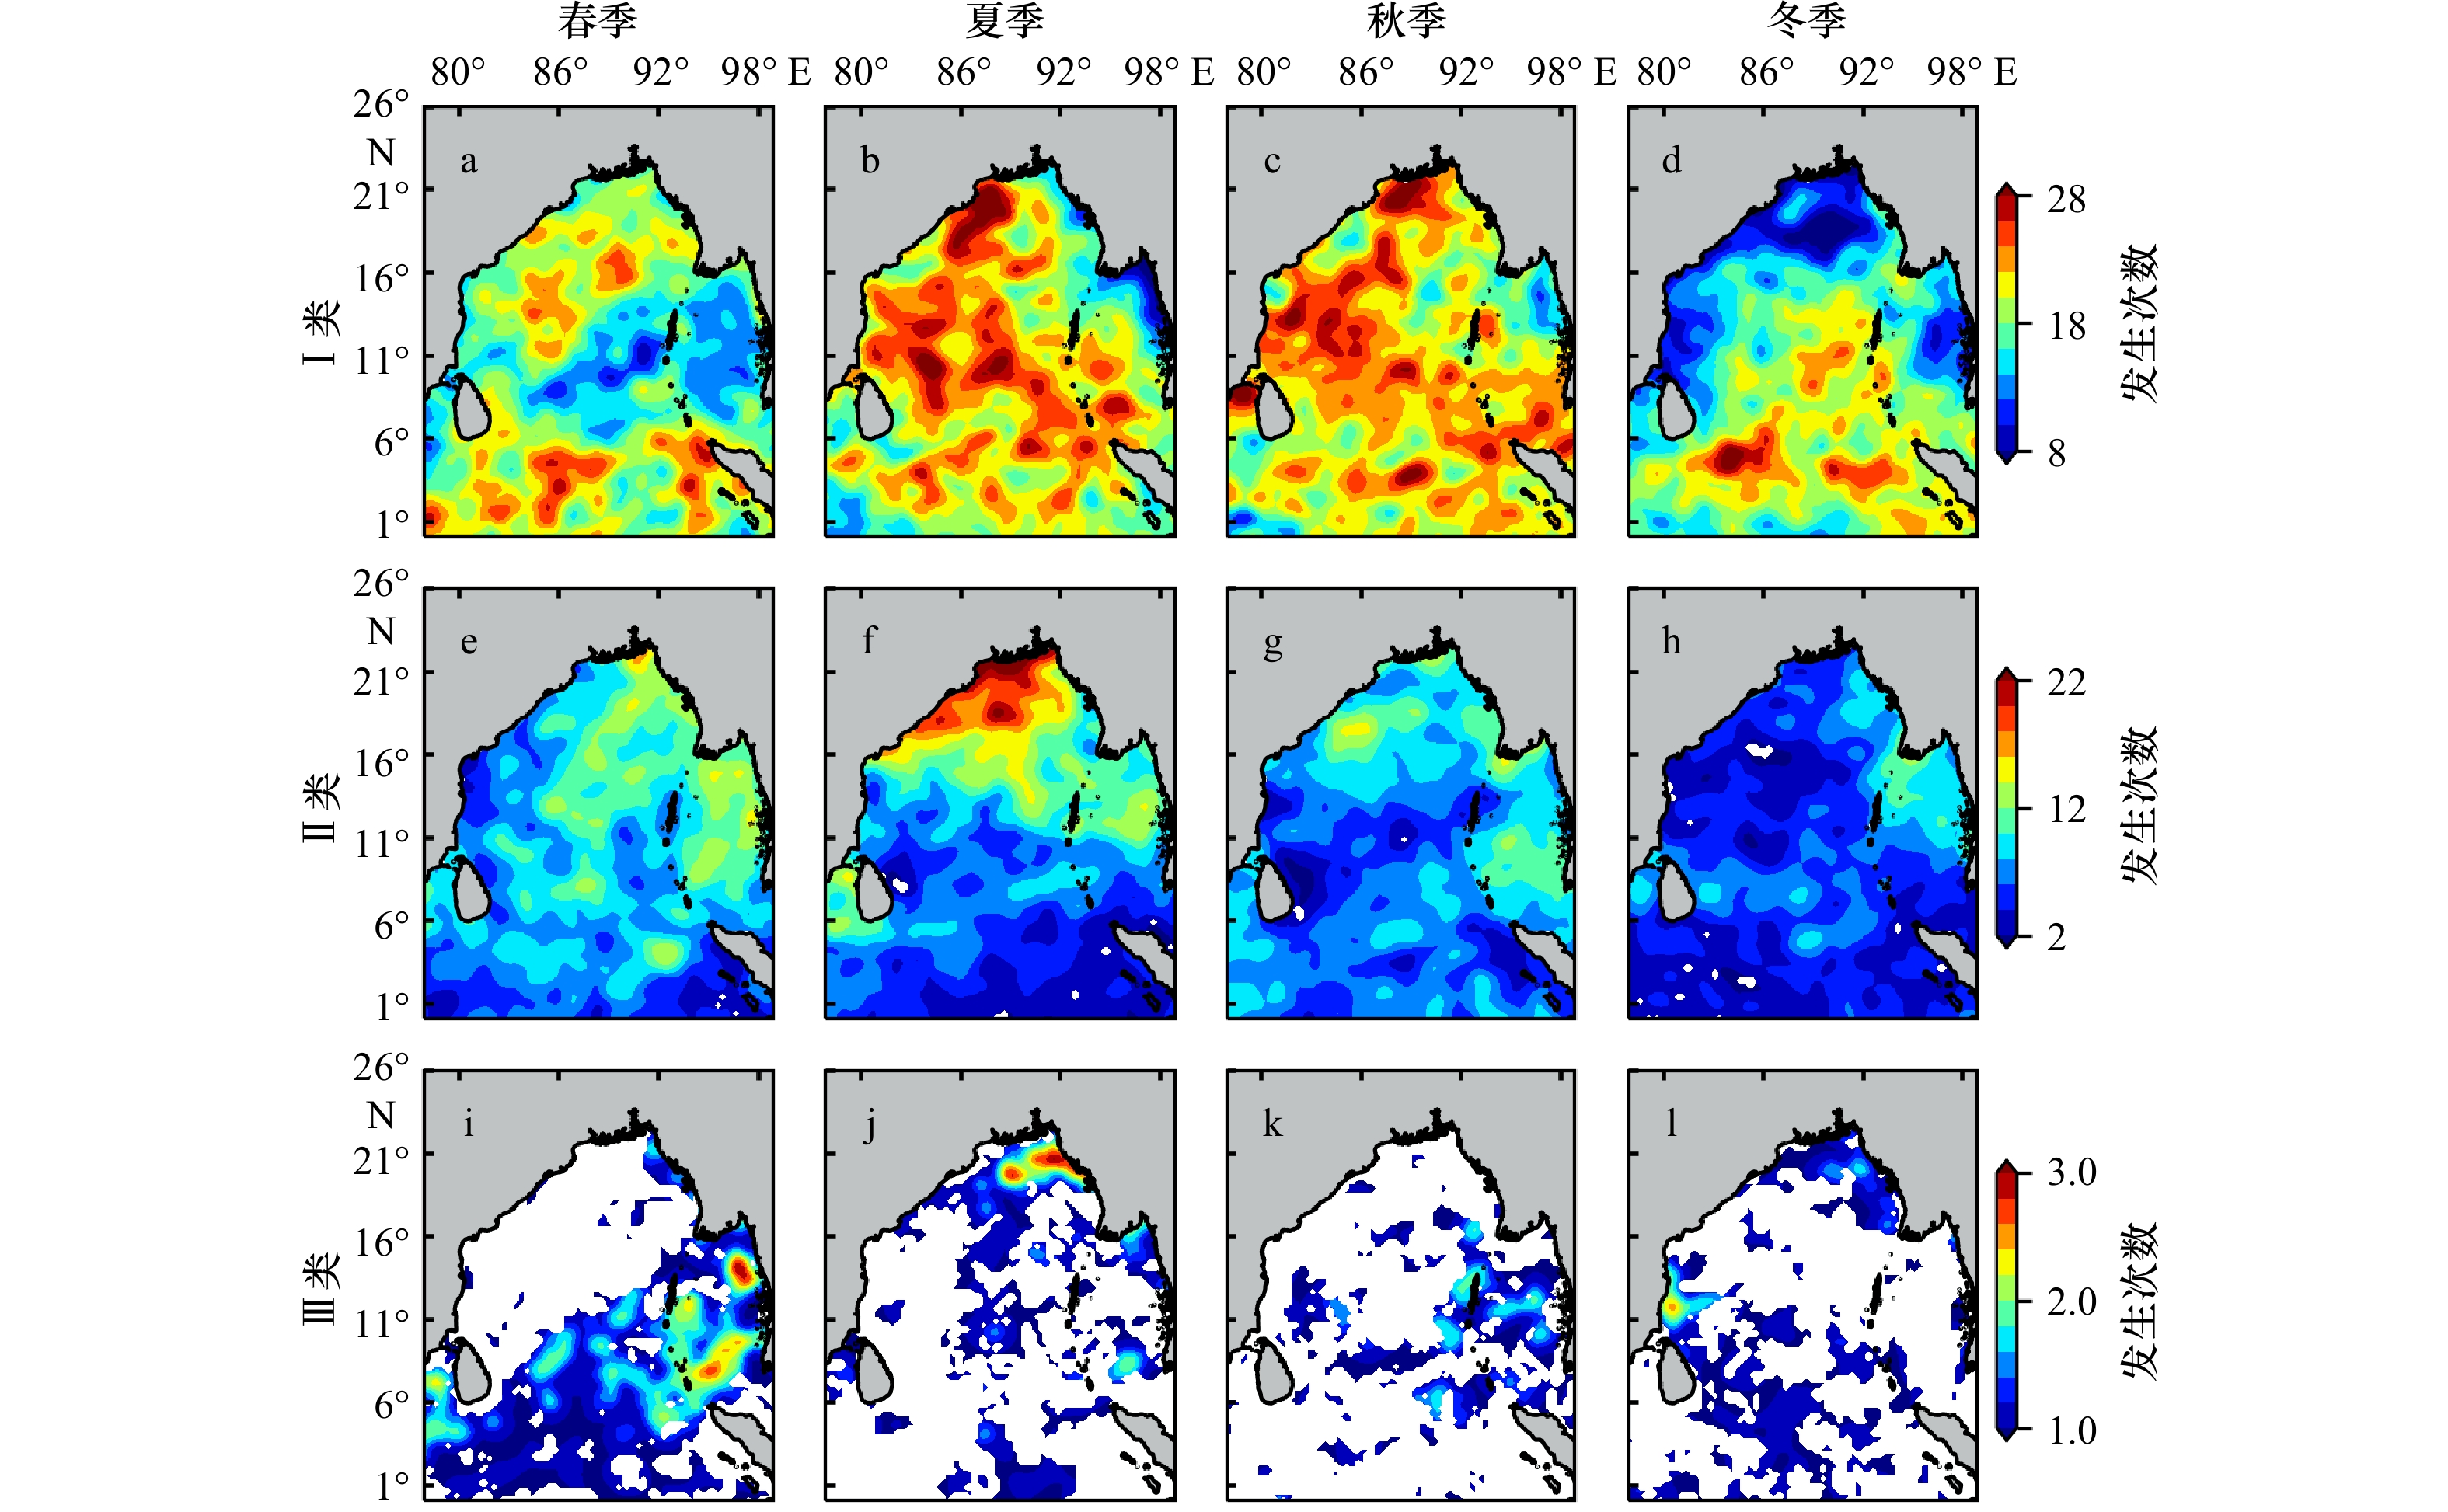
图 7 1982−2021年孟加拉湾 3种等级MHW发生总次数的季节分布
图中白色海域代表无MHW发生
Fig. 7 Seasonal distribution of occurrences of 3 MHW categories in the Bay of Bengal from 1982 to 2021
White areas waters represent no MHW
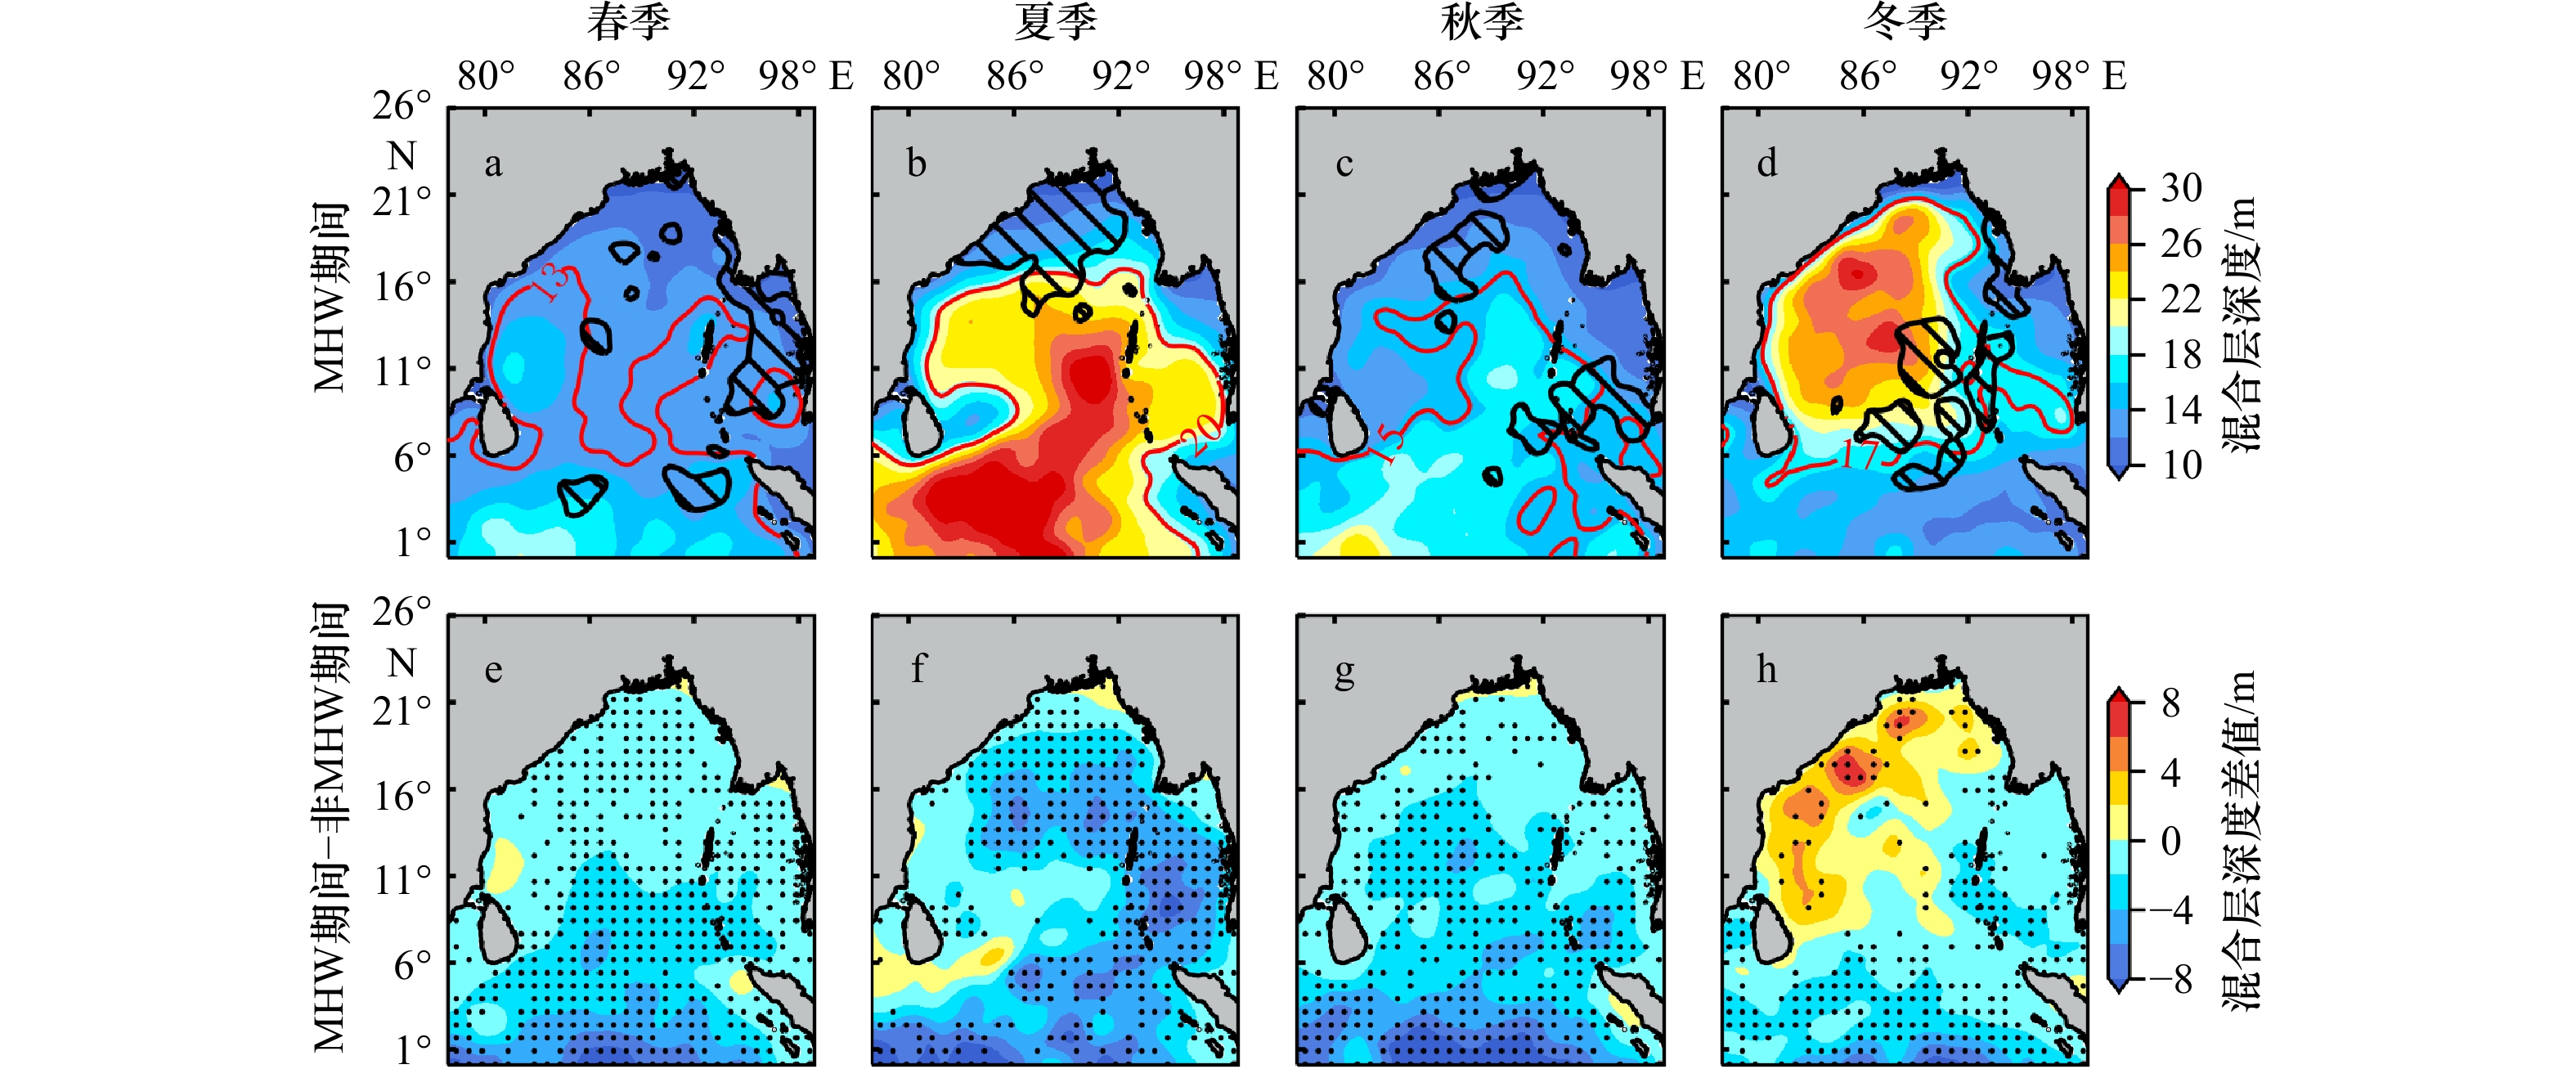
图 8 MHW期间合成得到的孟加拉湾混合层深度(a−d)和MHW期间与非MHW期间混合层深度(e−h)差值的季节分布
a−d中红色等值线和黑色阴影区域分别代表着相应季节孟加拉湾区域平均的混合层深度和MHW活跃区;e−h中黑点代表95%的置信水平
Fig. 8 Seasonal distribution of composite mixed layer depth in Bay of Bengal (a−d)during MHW and (e−h) the difference between MHW and no MHW periods
The black contour lines and black oblique lines areas in a−d indicate regional average of the mixed layer depth in the Bay of Bengal in each season and active MHW area, black dots in e−h represent the 95% confidence respectively

图 10 MHW消亡期合成得到的孟加拉湾海表净热通量(a−d)和MHW消亡期与非MHW期间海表净热通量差值(e−h)的季节分布
e−h中黑色阴影区域代表MHW活跃区,黑点代表95%的置信水平
Fig. 10 Seasonal distribution of composite net sea surface heat flux and anomalies in the Bay of Bengal during MHW decline periods (a−d) and the difference between the no MHWs and MHW decline periods (e−h)
Black oblique lines areas indicate active MHW area and the black dots represent the 95% confidence in e−h
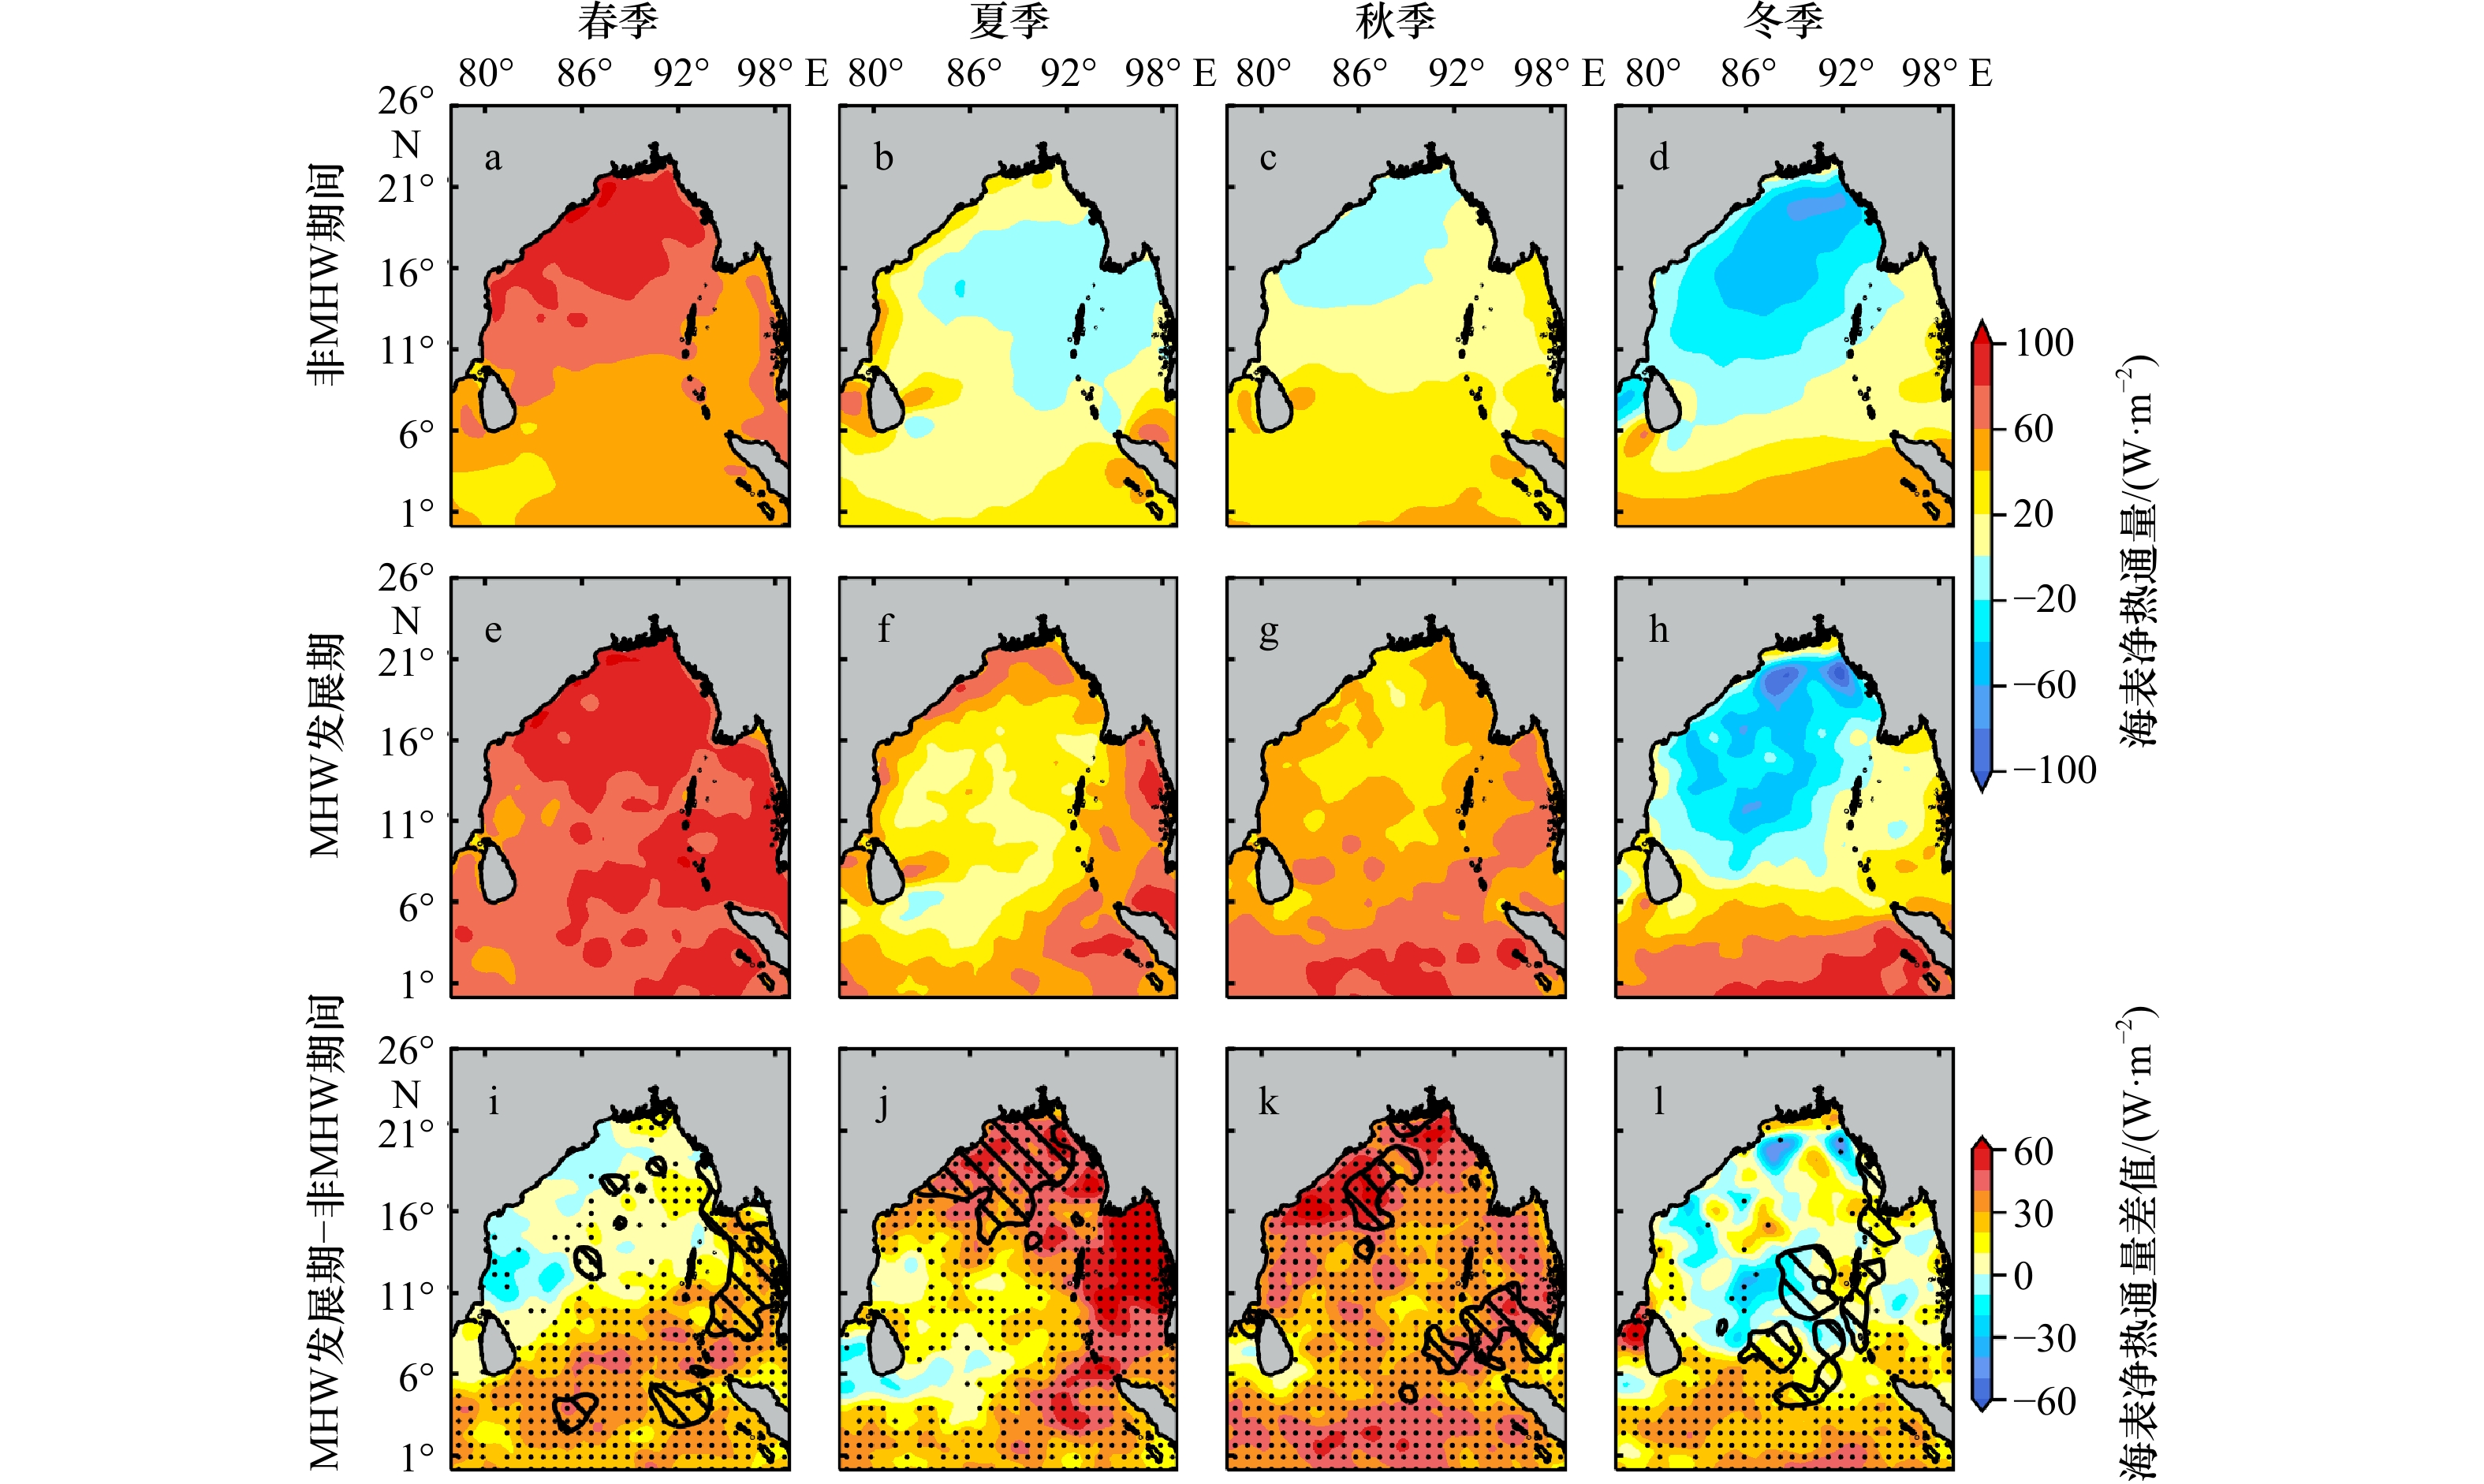
图 9 非MHW期间(a−d)和MHW发展期(e−h)合成得到的孟加拉湾海表净热通量以及后者与前者差值(i−l)的季节分布
i−l中黑色阴影区域代表MHW活跃区,黑点代表95%的置信水平
Fig. 9 Seasonal distribution of composite net sea surface heat flux and anomalies in the Bay of Bengal during non-MHW (a−d) and MHW (e−h) development periods and the difference between the two periods (i−l)
Black oblique lines areas indicate active MHW area and the black dots represent the 95% confidence in i−l
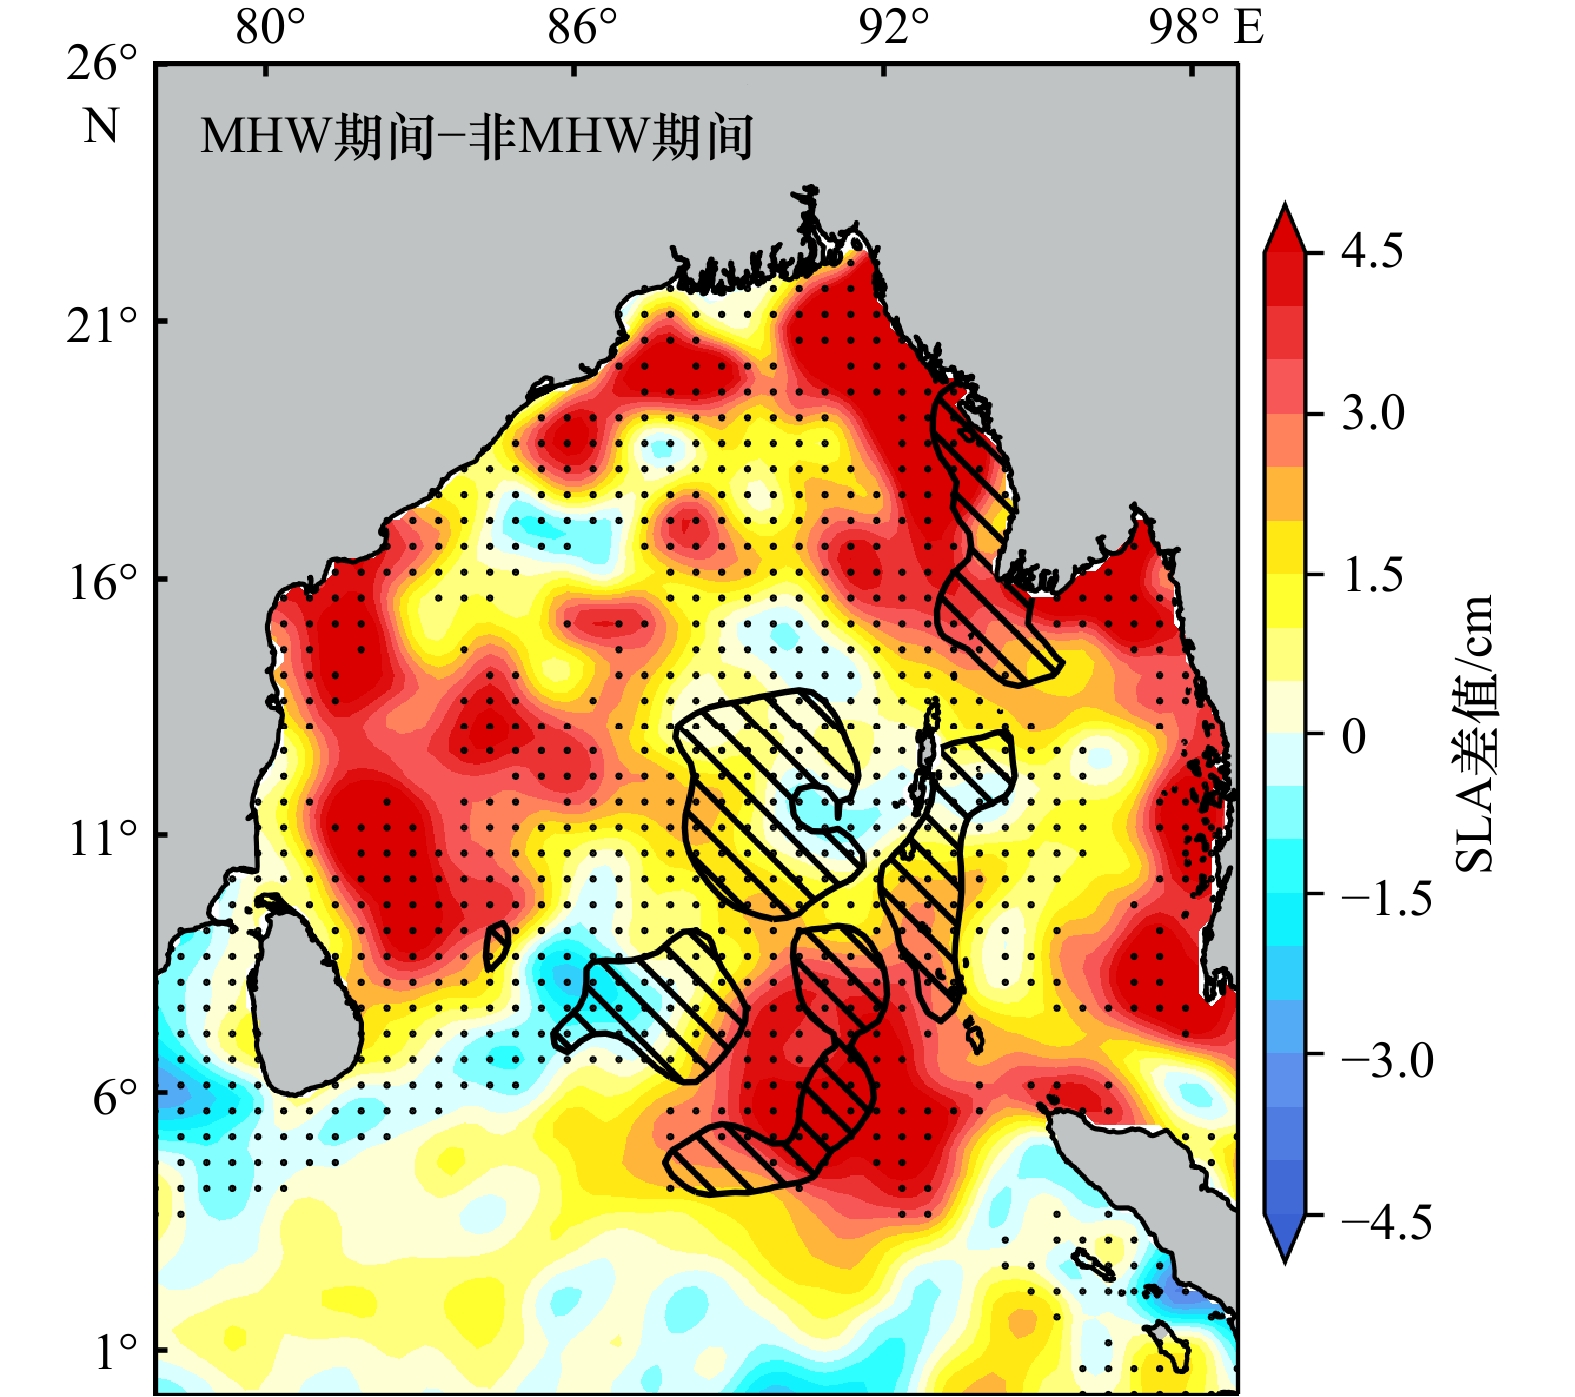
图 11 冬季孟加拉湾MHW期间与非MHW期间SLA差值场的空间分布
图中黑色阴影区域代表MHW活跃区,黑点代表95%的置信水平
Fig. 11 Spatial distribution of composite SLA anomalies in Bay of Bengal during the difference between MHW and no MHW periods in winter
Black oblique lines areas indicate active MHW area and the black dots represent the 95% confidence
表 1 MHW指标定义
Tab. 1 Definitions of MHW indices
指标 定义 数学表达式 单位 MHW频率 每年或每季发生MHW的次数 ${N}$ 次/季 MHW持续时间 某个MHW事件的总天数 ${{D} } = { {{t} }_{\rm{e}}} - { {{t} }_{\rm{s}}}$ d MHW平均强度 某个MHW事件热浪强度的平均值 ${ { {i} }_{ {\rm{mean} } } } = \overline {T(t) - {T_{\rm{m} } }({{t} })}$ ℃ MHW累积强度 某个MHW事件热浪强度的累加值 ${i_{ {\rm{cum} } } } = \displaystyle\int_{ {t_{\rm{s} } } }^{ {t_{\rm{e} } } } {[T(t) - {T_{\rm{m} } }(t)]{\rm{d} }t}$ ℃·d MHW天数 某一段时间内MHW日数的累加值 ${ {D}_{ {\rm{sum} } } }{\text{ = } }\displaystyle\sum\limits_{ { {D}_{\rm{e} } } }^{ { {D}_{\rm{s} } } } { {t_{ {\text{MHW} } } } }$ d 注:ts,te为热浪起始和结束时间;Ds,De为某一段时间内的起始和结束时间;T(t),Tm(t)为某日SST和其气候态;tMHW为热浪日。  下载: 导出CSV
-
[1] 胡石建, 李诗翰. 海洋热浪研究进展与展望[J]. 地球科学进展, 2022, 37(1): 51−64. doi: 10.11867/j.issn.1001-8166.2021.121Hu Shijian, Li Shihan. Progress and prospect of marine heatwave study[J]. Advances in Earth Science, 2022, 37(1): 51−64. doi: 10.11867/j.issn.1001-8166.2021.121 [2] Scannell H A, Johnson G C, Thompson L, et al. Subsurface evolution and persistence of marine heatwaves in the Northeast Pacific[J]. Geophysical Research Letters, 2020, 47(23): e2020GL090548. doi: 10.1029/2020GL090548 [3] Benthuysen J A, Oliver E C J, Feng Ming, et al. Extreme marine warming across tropical Australia during Austral summer 2015−2016[J]. Journal of Geophysical Research: Oceans, 2018, 123(2): 1301−1326. doi: 10.1002/2017JC013326 [4] Holbrook N J, Scannell H A, Sen Gupta A, et al. A global assessment of marine heatwaves and their drivers[J]. Nature Communication, 2019, 10(1): 2624. doi: 10.1038/s41467-019-10206-z [5] Von Schuckmann K, Cheng Lijing, Palmer M D, et al. Heat stored in the Earth system: where does the energy go?[J]. Earth System Science Data, 2020, 12(3): 2013−2041. doi: 10.5194/essd-12-2013-2020 [6] Cheng Lijing, Abraham J, Hausfather Z, et al. How fast are the oceans warming?: observational records of ocean heat content show that ocean warming is accelerating[J]. Science, 2019, 363(6423): 128−129. doi: 10.1126/science.aav7619 [7] Oliver E C J, Donat M G, Burrows M T, et al. Longer and more frequent marine heatwaves over the past century[J]. Nature Communications, 2018, 9(1): 1324. doi: 10.1038/s41467-018-03732-9 [8] Oliver E C J, Benthuysen J A, Darmaraki S, et al. Marine heatwaves[J]. Annual Review of Marine Science, 2021, 13: 313−342. doi: 10.1146/annurev-marine-032720-095144 [9] Holbrook N J, Sen Gupta A, Oliver E C J, et al. Keeping pace with marine heatwaves[J]. Nature Reviews Earth & Environment, 2020, 1(9): 482−493. [10] Di Lorenzo E, Mantua N. Multi-year persistence of the 2014/15 North Pacific marine heatwave[J]. Nature Climate Change, 2016, 6(11): 1042−1047. doi: 10.1038/nclimate3082 [11] Rodrigues R R, Taschetto A S, Sen Gupta A, et al. Common cause for severe droughts in South America and marine heatwaves in the South Atlantic[J]. Nature Geoscience, 2019, 12(8): 620−626. doi: 10.1038/s41561-019-0393-8 [12] Zhang Ying, Du Yan, Feng Ming, et al. Long-lasting marine heatwaves instigated by ocean planetary waves in the tropical Indian Ocean during 2015−2016 and 2019−2020[J]. Geophysical Research Letters, 2021, 48(21): e2021GL095350. doi: 10.1029/2021GL095350 [13] Laufkötter C, Zscheischler J, Frölicher T L. High-impact marine heatwaves attributable to human-induced global warming[J]. Science, 2020, 369(6511): 1621−1625. doi: 10.1126/science.aba0690 [14] Jacox M G, Alexander M A, Bograd S J, et al. Thermal displacement by marine heatwaves[J]. Nature, 2020, 584(7819): 82−86. doi: 10.1038/s41586-020-2534-z [15] Cavole L M, Demko A M, Diner R E, et al. Biological impacts of the 2013−2015 warm-water anomaly in the Northeast Pacific: winners, losers, and the future[J]. Oceanography, 2016, 29(2): 273−285. [16] Hughes T P, Kerry J T, Álvarez-Noriega M, et al. Global warming and recurrent mass bleaching of corals[J]. Nature, 2017, 543(7645): 373−377. doi: 10.1038/nature21707 [17] Smale D A, Wernberg T, Oliver E C J, et al. Marine heatwaves threaten global biodiversity and the provision of ecosystem services[J]. Nature Climate Change, 2019, 9(4): 306−312. doi: 10.1038/s41558-019-0412-1 [18] Smith K E, Burrows M T, Hobday A J, et al. Socioeconomic impacts of marine heatwaves: global issues and opportunities[J]. Science, 2021, 374(6566): eabj3593. doi: 10.1126/science.abj3593 [19] Pershing A J, Alexander M A, Hernandez C M, et al. Slow adaptation in the face of rapid warming leads to collapse of the Gulf of Maine cod fishery[J]. Science, 2015, 350(6262): 809−812. doi: 10.1126/science.aac9819 [20] Mills K E, Pershing A J, Brown C J, et al. Fisheries management in a changing climate: lessons from the 2012 ocean heat wave in the Northwest Atlantic[J]. Oceanography, 2013, 26(2): 191−195. [21] Dinesh Kumar P K, Paul Y S, Muraleedharan K R, et al. Comparison of long-term variability of sea surface temperature in the Arabian Sea and Bay of Bengal[J]. Regional Studies in Marine Science, 2016, 3: 67−75. doi: 10.1016/j.rsma.2015.05.004 [22] Gao Xin, Li Gen, Liu Jiawei, et al. The trend and interannual variability of marine heatwaves over the Bay of Bengal[J]. Atmosphere, 2022, 13(3): 469. doi: 10.3390/atmos13030469 [23] Saranya J S, Roxy M K, Dasgupta P, et al. Genesis and trends in marine heatwaves over the tropical indian ocean and their interaction with the indian summer monsoon[J]. Journal of Geophysical Research: Oceans, 2022, 127(2): e2021JC017427. doi: 10.1029/2021JC017427 [24] Rathore S, Goyal R, Jangir B, et al. Interactions between a marine heatwave and tropical cyclone Amphan in the Bay of Bengal in 2020[J]. Frontiers in Climate, 2022, 4: 861477. doi: 10.3389/fclim.2022.861477 [25] Hu Ruijin, Liu Qinyu, Meng Xiangfeng, et al. On the mechanism of the seasonal variability of SST in the tropical Indian Ocean[J]. Advances in Atmospheric Sciences, 2005, 22(3): 451−462. doi: 10.1007/BF02918758 [26] Huang Boyin, Liu Chunying, Banzon V, et al. Improvements of the daily optimum interpolation sea surface temperature (DOISST) version 2.1[J]. Journal of Climate, 2021, 34(8): 2923−2939. doi: 10.1175/JCLI-D-20-0166.1 [27] Knapp K R, Ansari S, Bain C L, et al. Globally gridded satellite observations for climate studies[J]. Bulletin of the American Meteorological Society, 2011, 92(7): 893−907. doi: 10.1175/2011BAMS3039.1 [28] Hersbach H, De Rosnay P, Bell B. Operational Global Reanalysis: Progress, Future Directions and Synergies with NWP[M]. Reading: ECMWF, 2018. [29] Jean-Michel L, Eric G, Romain B-B, et al. The copernicus global 1/12° oceanic and sea ice GLORYS12 reanalysis[J]. Frontiers in Earth Science, 2021, 9: 698876. doi: 10.3389/feart.2021.698876 [30] Kara A B, Rochford P A, Hurlburt H E. An optimal definition for ocean mixed layer depth[J]. Journal of Geophysical Research: Oceans, 2000, 105(C7): 16803−16821. doi: 10.1029/2000JC900072 [31] Pujol M I, Faugère Y, Taburet G, et al. DUACS DT2014: the new multi-mission altimeter data set reprocessed over 20 years[J]. Ocean Science, 2016, 12(5): 1067−1090. doi: 10.5194/os-12-1067-2016 [32] Hobday A J, Alexander L V, Perkins S E, et al. A hierarchical approach to defining marine heatwaves[J]. Progress in Oceanography, 2016, 141: 227−238. doi: 10.1016/j.pocean.2015.12.014 [33] Pietri A, Colas F, Mogollon R, et al. Marine heatwaves in the Humboldt current system: from 5-day localized warming to year-long El Niños[J]. Scientific Reports, 2021, 11(1): 21172. doi: 10.1038/s41598-021-00340-4 [34] Yao Yulong, Wang Chunzai. Variations in summer marine heatwaves in the South China Sea[J]. Journal of Geophysical Research: Oceans, 2021, 126(10): e2021JC017792. doi: 10.1029/2021JC017792 [35] Oliver E C J, Burrows M T, Donat M G, et al. Projected marine heatwaves in the 21st century and the potential for ecological impact[J]. Frontiers in Marine Science, 2019, 6: 734. doi: 10.3389/fmars.2019.00734 [36] Sen Gupta A, Thomsen M, Benthuysen J A, et al. Drivers and impacts of the most extreme marine heatwave events[J]. Scientific Reports, 2020, 10(1): 19359. doi: 10.1038/s41598-020-75445-3 [37] Schaeffer A, Roughan M. Subsurface intensification of marine heatwaves off southeastern Australia: The role of stratification and local winds[J]. Geophysical Research Letters, 2017, 44(10): 5025−5033. doi: 10.1002/2017GL073714 [38] Rao R R, Girish Kumar M S, Ravichandran M, et al. Interannual variability of Kelvin wave propagation in the wave guides of the equatorial Indian Ocean, the coastal Bay of Bengal and the southeastern Arabian Sea during 1993−2006[J]. Deep Sea Research Part I: Oceanographic Research Papers, 2010, 57(1): 1−13. doi: 10.1016/j.dsr.2009.10.008 -

计量
- 文章访问数: 612
- HTML全文浏览量: 235
- PDF下载量: 136
- 被引次数: 0
