

Analysis on the variation characteristics of boundary layer temperature inversions over the seasonal ice zone of the Arctic based on the observation during the 6th to 9th Chinese National Arctic Research Expedition
-
摘要: 利用我国第6~9次北极科学考察期间获取的大气探空资料,分析了北极季节冰区边界层逆温的时空变化特征及其成因。分析发现:(1)边界层逆温具有较强的年际变化和空间变化,高纬度密集冰区观测到更多的强逆温现象,逆温厚度与逆温层温差呈显著的对数关系;(2)不同年份边界层逆温的主要成因有所差别:海冰分布的差异导致不同年份的边界层逆温特征不同;表面融化、辐射冷却、多层云的结构和暖平流对不同冰情年份边界层逆温的贡献程度不同;(3)开阔水域和冰区边界层逆温的成因不同。表面融化和空气平流对冰区边界层逆温的形成起着非常重要的作用,而辐射冷却是开阔水域边界层逆温的主要成因之一。Abstract: The GPS radiosonde data obtained during the 6th to 9th Chinese National Arctic Research Expedition was used to analyze the spatial and temporal variation characteristics of boundary layer temperature inversions over the seasonal ice zone in Arctic. The results show that: (1) There were strong interannual and spatial changes in the temperature inversions. There were more strong inversions over the pack ice zone at high latitude. And the thickness of inversions and the temperature change through the inversions had a significant logarithmic relationship. (2) The main factors controlling inversion properties were various in different years. The differences in sea ice cover leaded to different characteristics of inversions. Surface melt, radiative cooling, multi-layer cloud and warm-air advection provided different degrees of contribution to inversions in different years. (3) There were different reasons over the open water and sea ice zone. Both surface melt and warm-air advection played a very important role in the formation of inversions in sea ice zone. However, radiative cooling was one of the main factors in the generation of inversions over the open water.
-
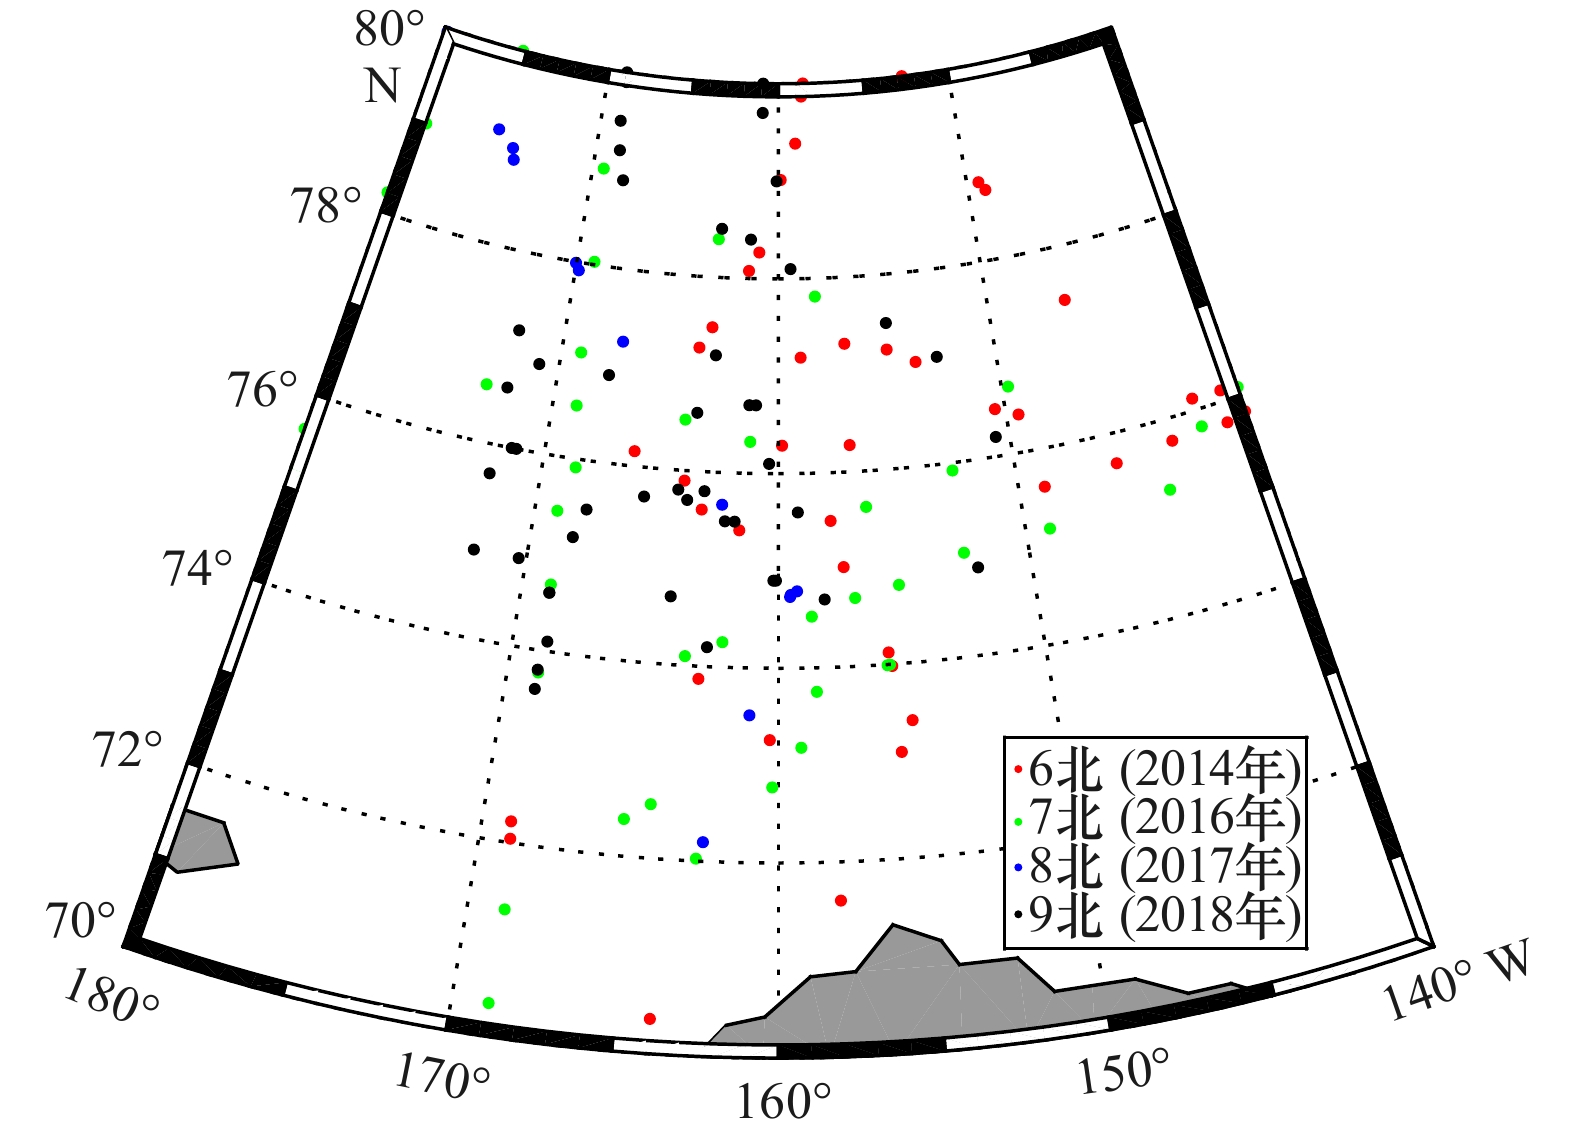
图 1 我国第6~9次北极科学考察在70°~80°N,140°W~180°探空观测初始位置
Fig. 1 The initial position of radiosonde observations in the area of 70°~80°N,140°W~180° during 6th to 9th Chinese National Arctic Research Expedition (CHINARE)

图 2 2014−2018年边界层逆温各参数统计
Fig. 2 The statistics of the boundary layer temperature inversions from 2014 to 2018

图 3 2014年(a)、2016年(b)、2017年(c)、2018年(d)观测期间3 km以下温度垂直梯度时间剖面和对应纬度
Fig. 3 Time series of the temperature lapse rate below 3 km and the corresponding latitude during the observation period in 2014 (a), 2016 (b), 2017 (c), and 2018 (d)
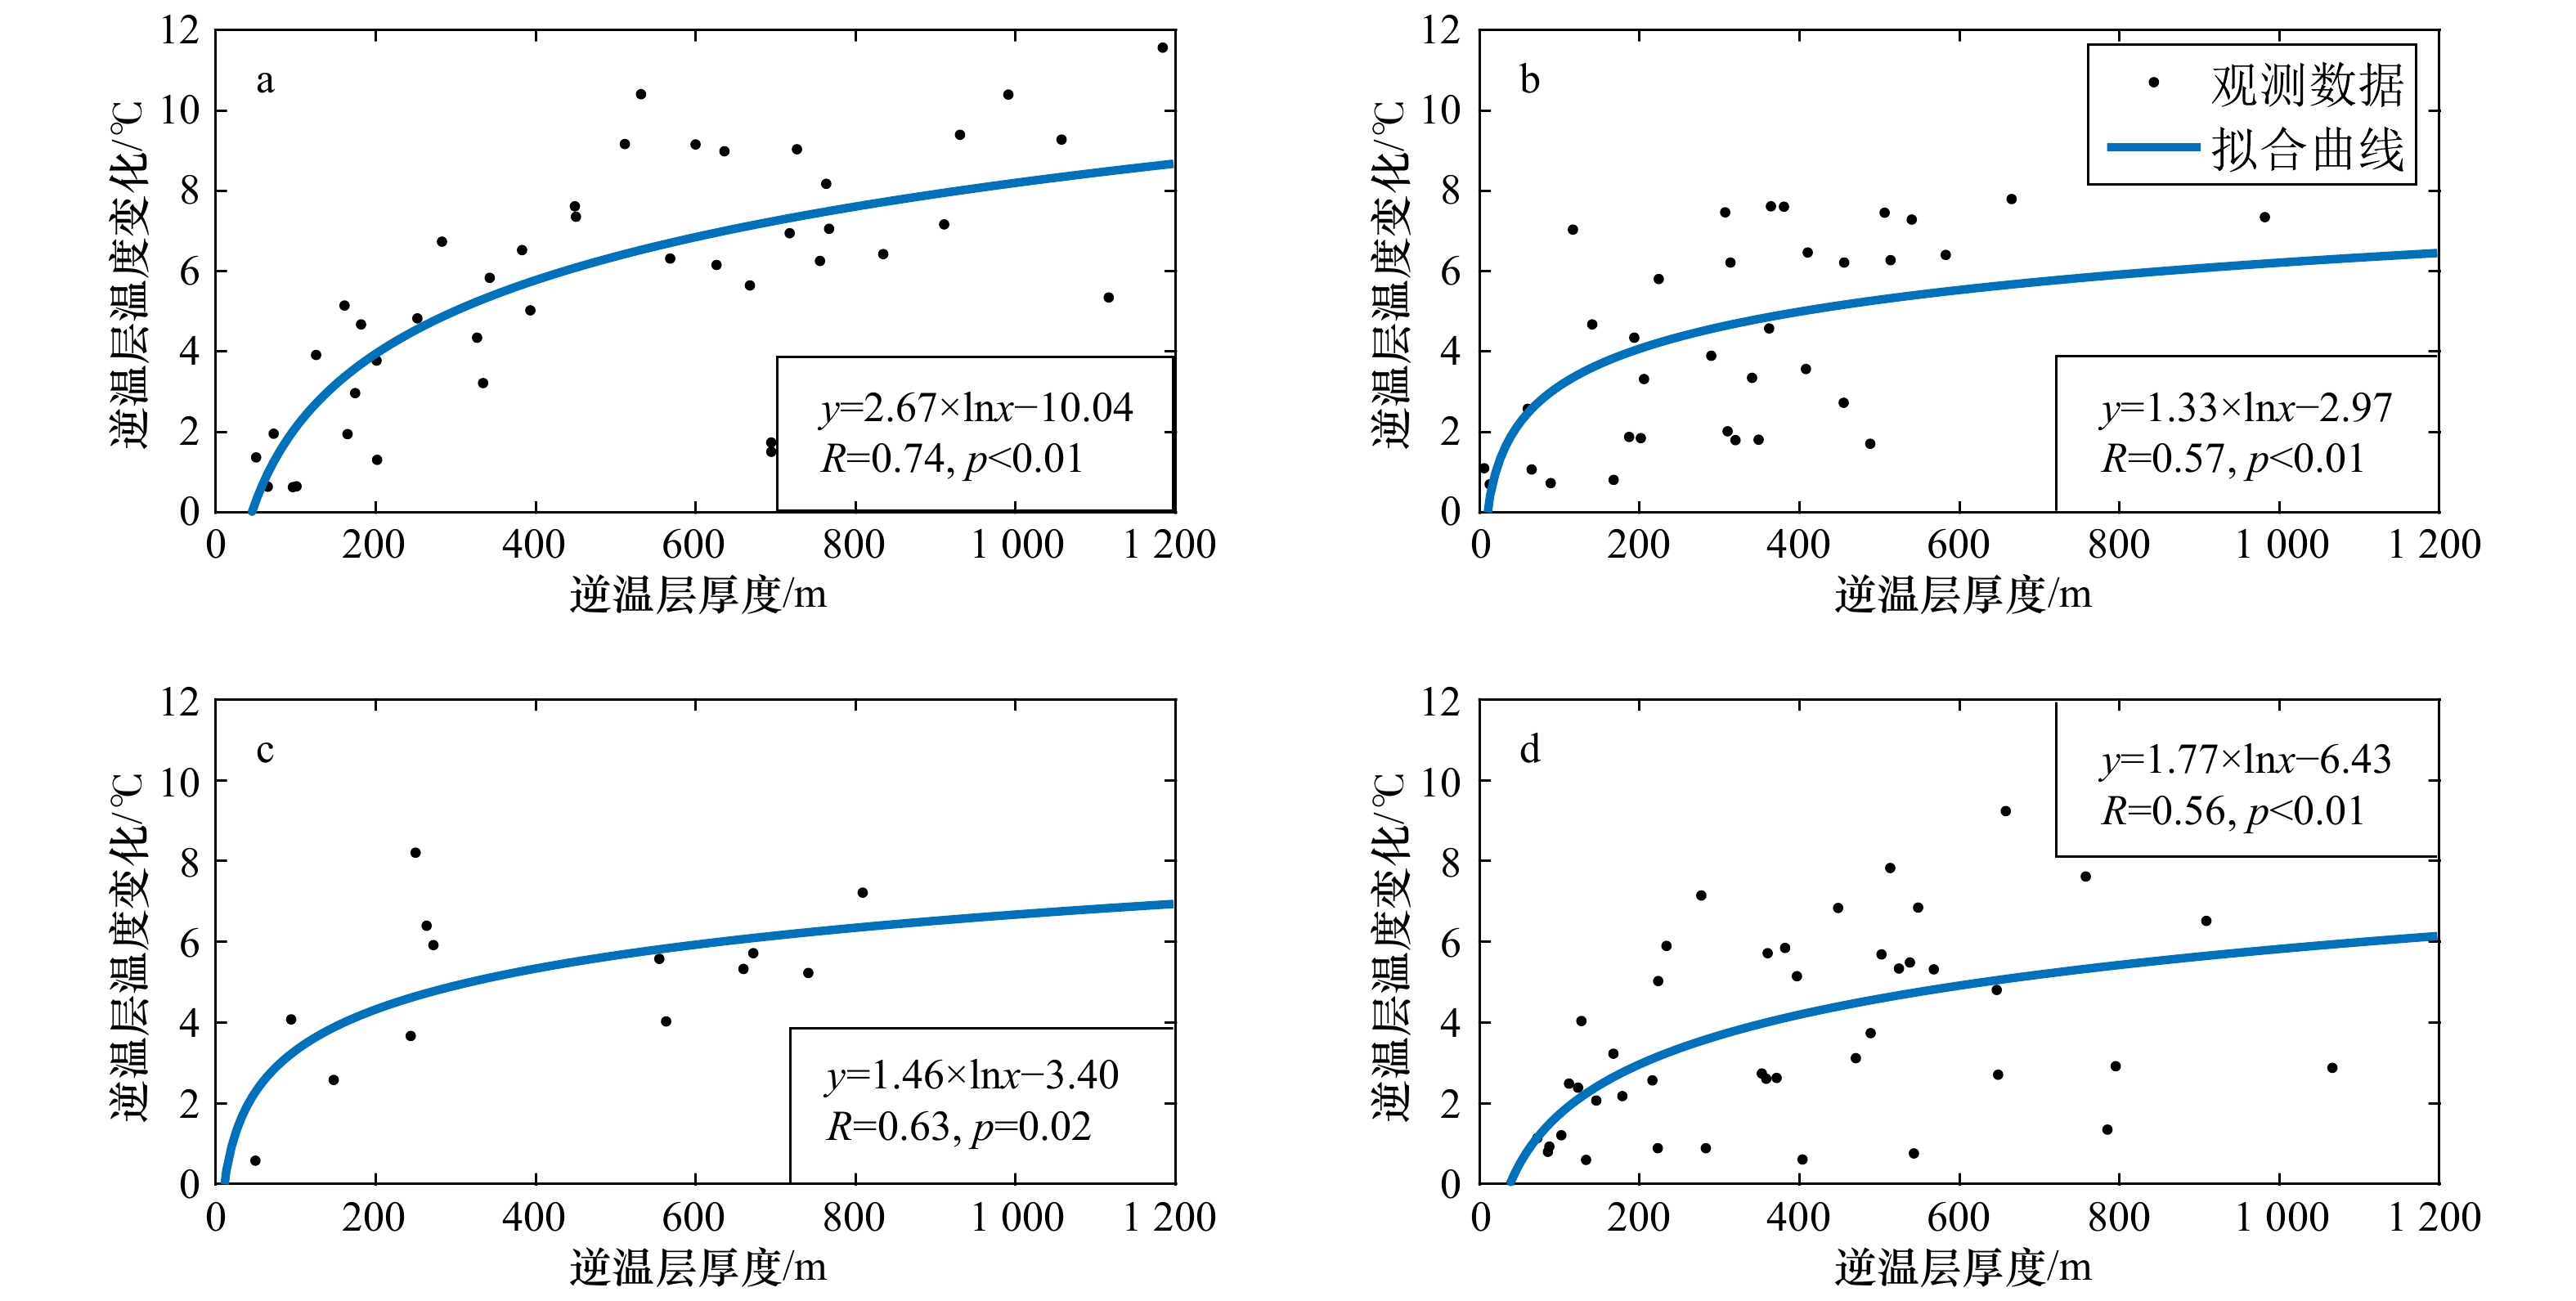
图 4 2014年(a)、2016年(b)、2017年(c)和2018年(d)逆温厚度和逆温层温差的关系
Fig. 4 The relationship between the temperature inversion depth and the temperature change in the inversion layer in 2014 (a), 2016 (b), 2017 (c) and 2018 (d)
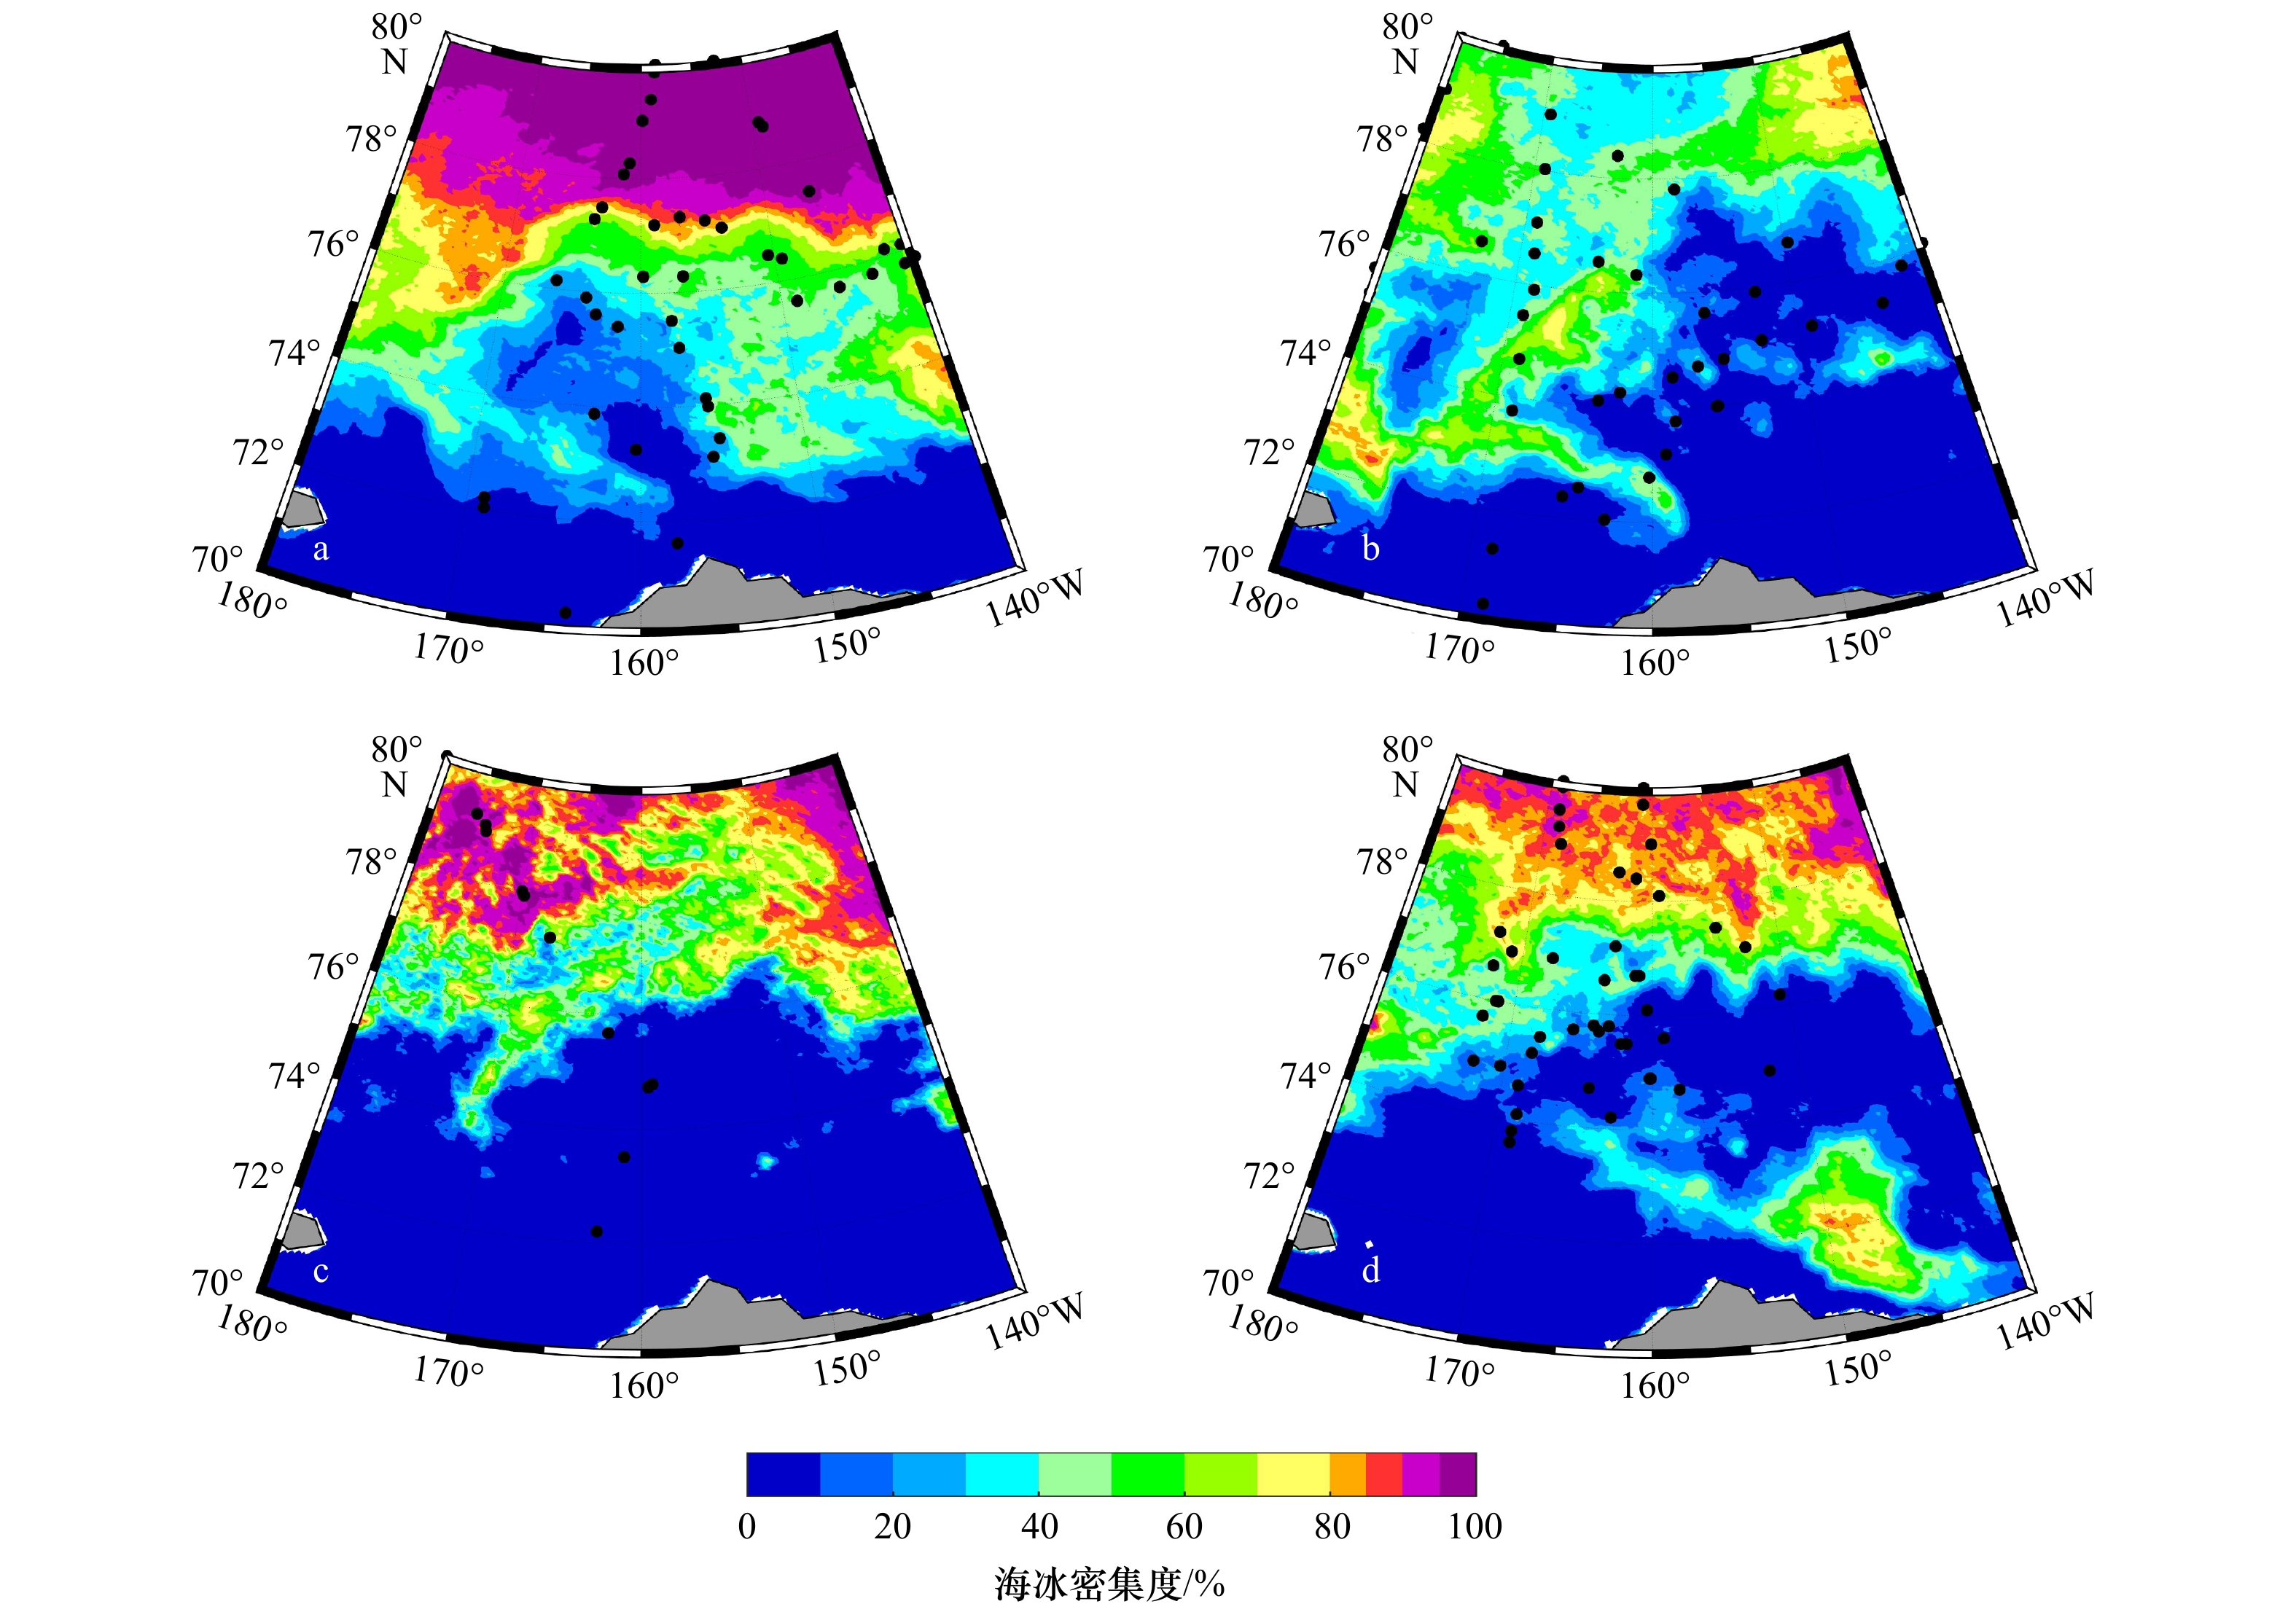
图 5 观测期间平均海冰密集度
a. 2014年7月31日至8月16日、8月28日至9月8日;b. 2016年7月25日至8月3日、8月17日至9月2日;c. 2017年8月1日至8月5日;d. 2018年7月31日至8月11日、8月28日至9月4日,黑色圆点为探空初始位置
Fig. 5 The average sea ice concentration during the observation period
a. 31 July to 16 August and 28 August to 8 September 2014; b. 25 July to 3 August and 17 August to 2 September 2016; c. 1 August to 5 August 2017, d. 31 July to 11 August and 28 August to 4 September 2018, respectively. The black dots represent the initial position of the observation

图 6 2014−2017年观测期间950 hPa高度和2018年观测期间925 hPa高度平均温度平流
a. 2014年7月31日至8月16日、8月28日至9月8日;b. 2016年7月25日至8月3日、8月17日至9月2日;c. 2017年8月1日至8月5日;d. 2018年7月31日至8月11日、8月28日至9月4日,黑色圆点为探空初始位置
Fig. 6 The average temperature advection at 950 hPa in 2014−2017 and at 925 hPa in 2018 during the observation period
a. 31 July to 16 August and 28 August to 8 September 2014; b. 25 July to 3 August and 17 August to 2 September 2016; c. 1 August to 5 August 2017; d. 31 July to 11 August and 28 August to 4 September 2018, respectively. The black dots represent the initial position of the observation
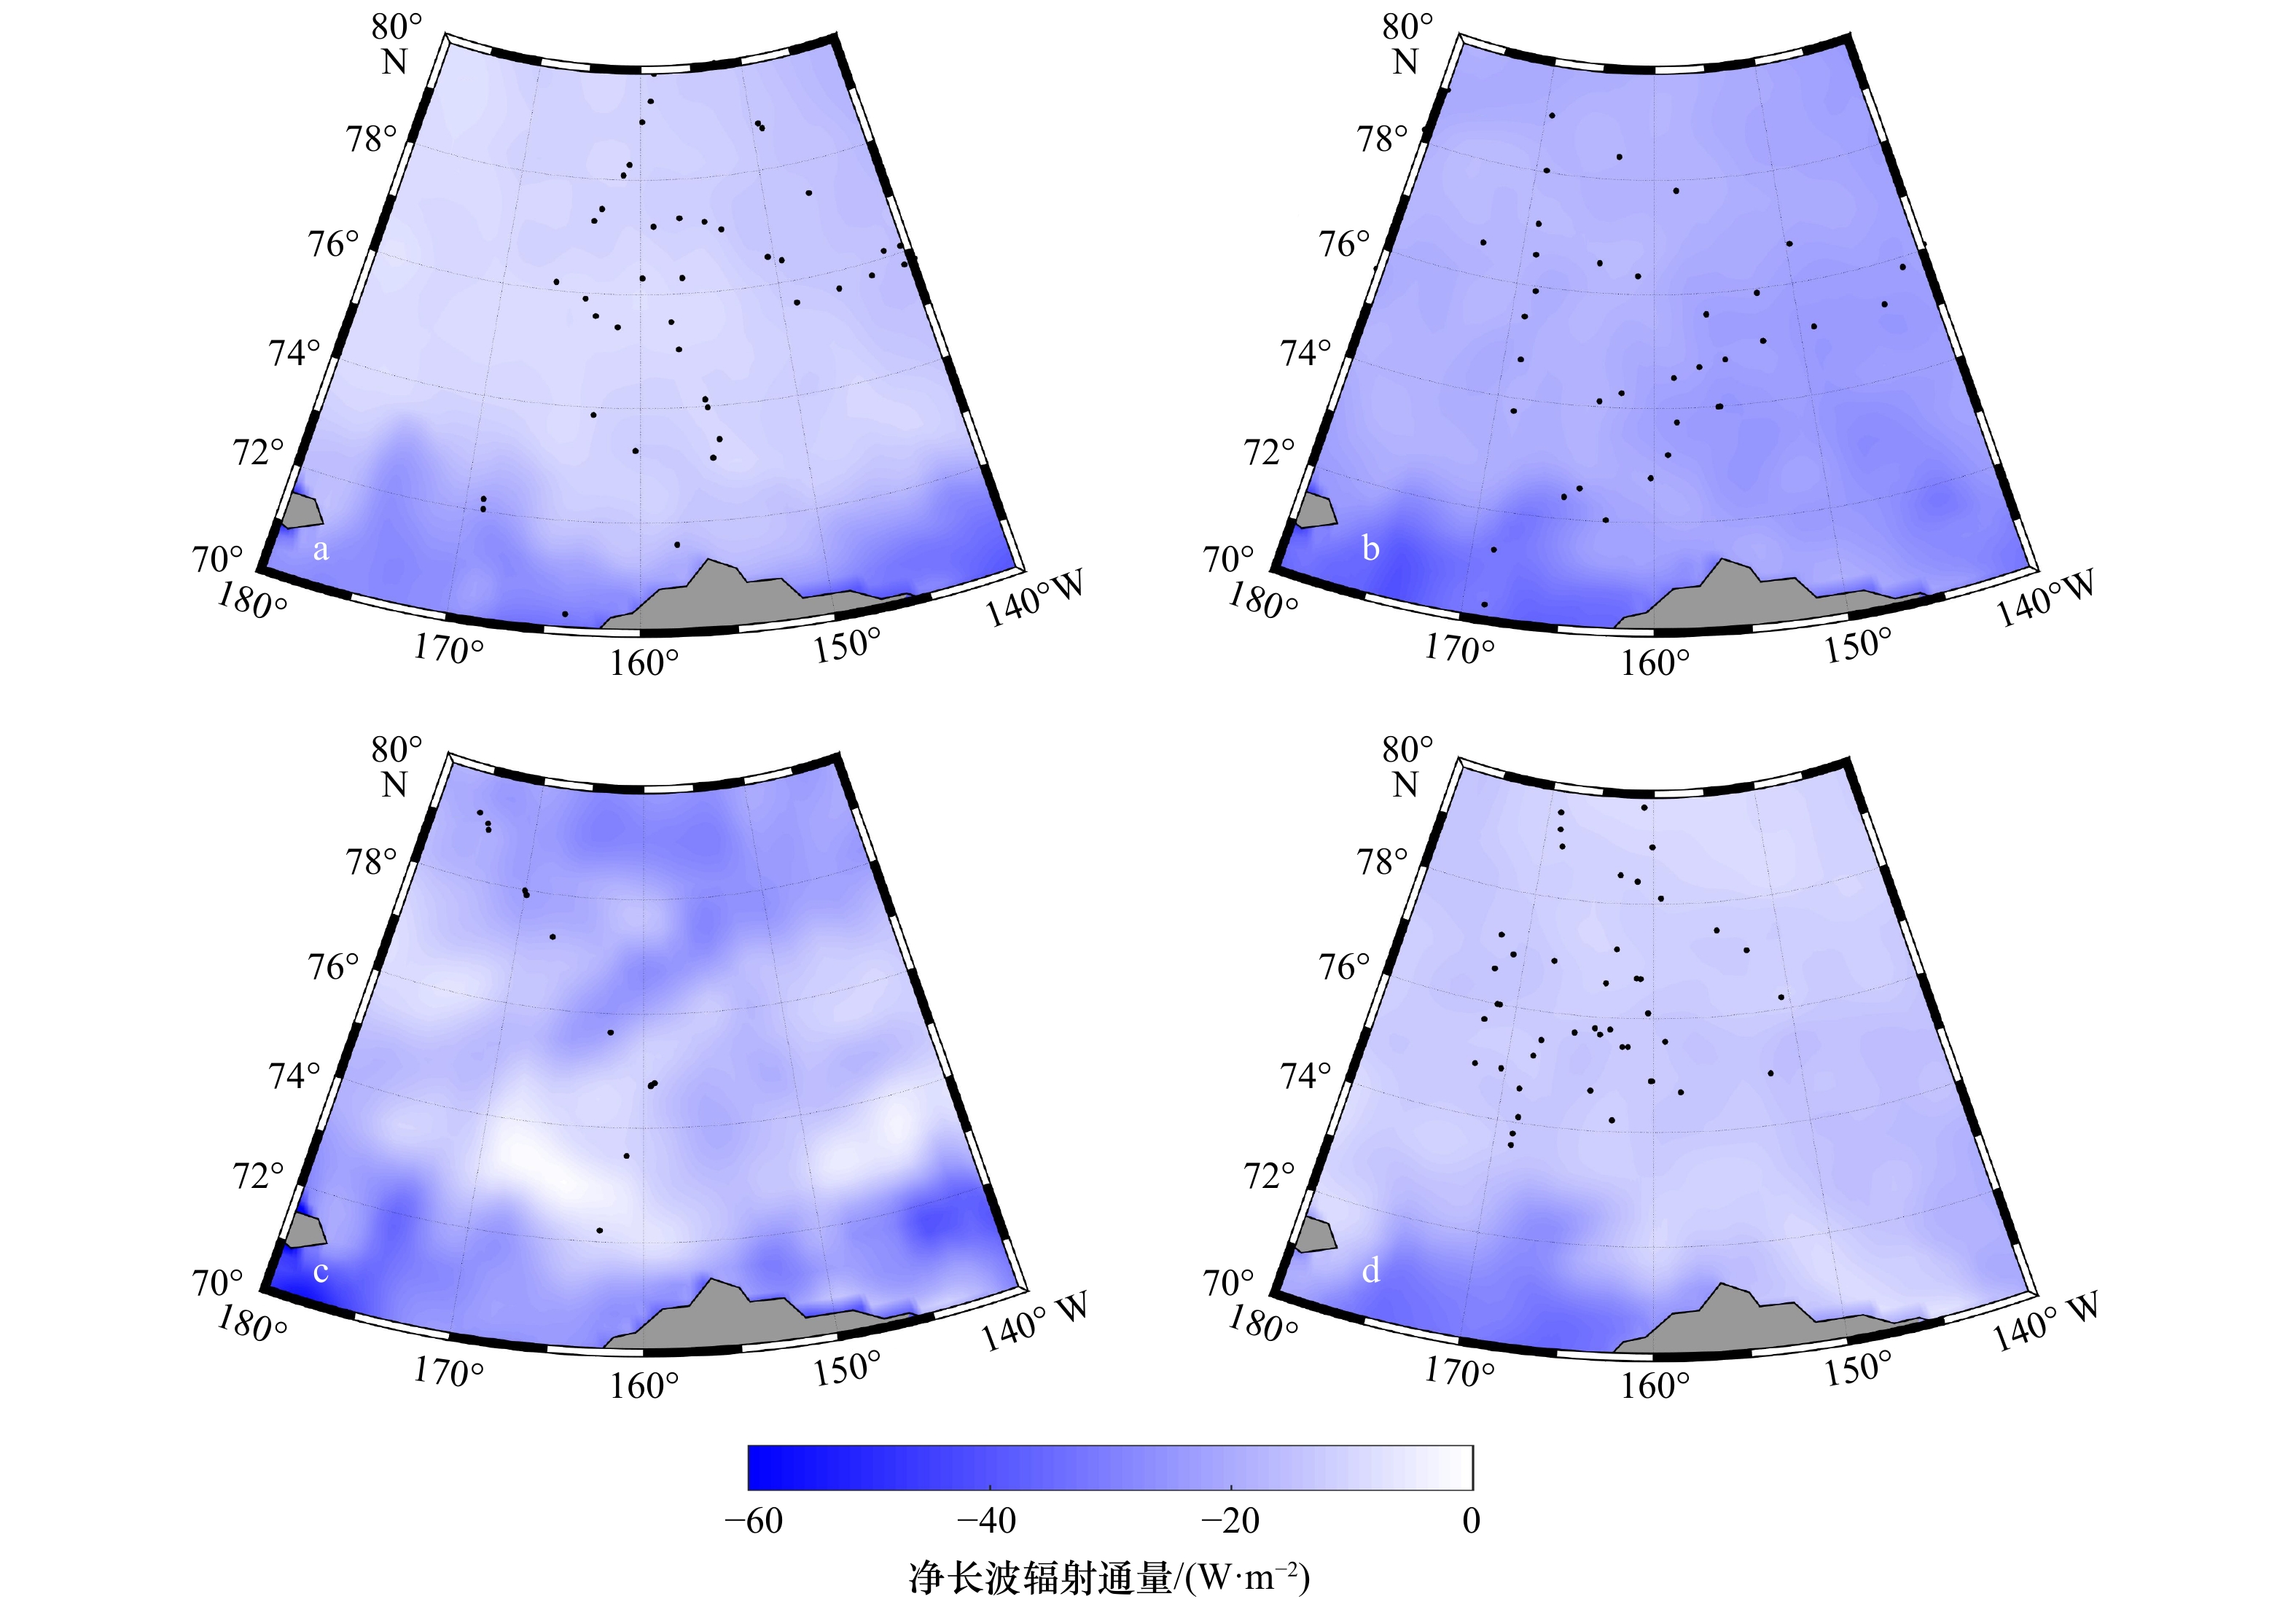
图 7 观测期间地面平均净长波辐射通量
a. 2014年7月31日至8月16日、8月28日至9月8日;b. 2016年7月25日至8月3日、8月17日至9月2日;c. 2017年8月1日至8月5日;d. 2018年7月31日至8月11日、8月28日至9月4日,黑色圆点为探空初始位置
Fig. 7 The mean surface net long wave radiation flux during the observation period
a. 31 July to 16 August and 28 August to 8 September 2014; b. 25 July to 3 August and 17 August to 2 September 2016; c. 1 August to 5 August 2017; d. 31 July to 11 August and 28 August to 4 September 2018, respectively. The black dots represent the initial position of the observation
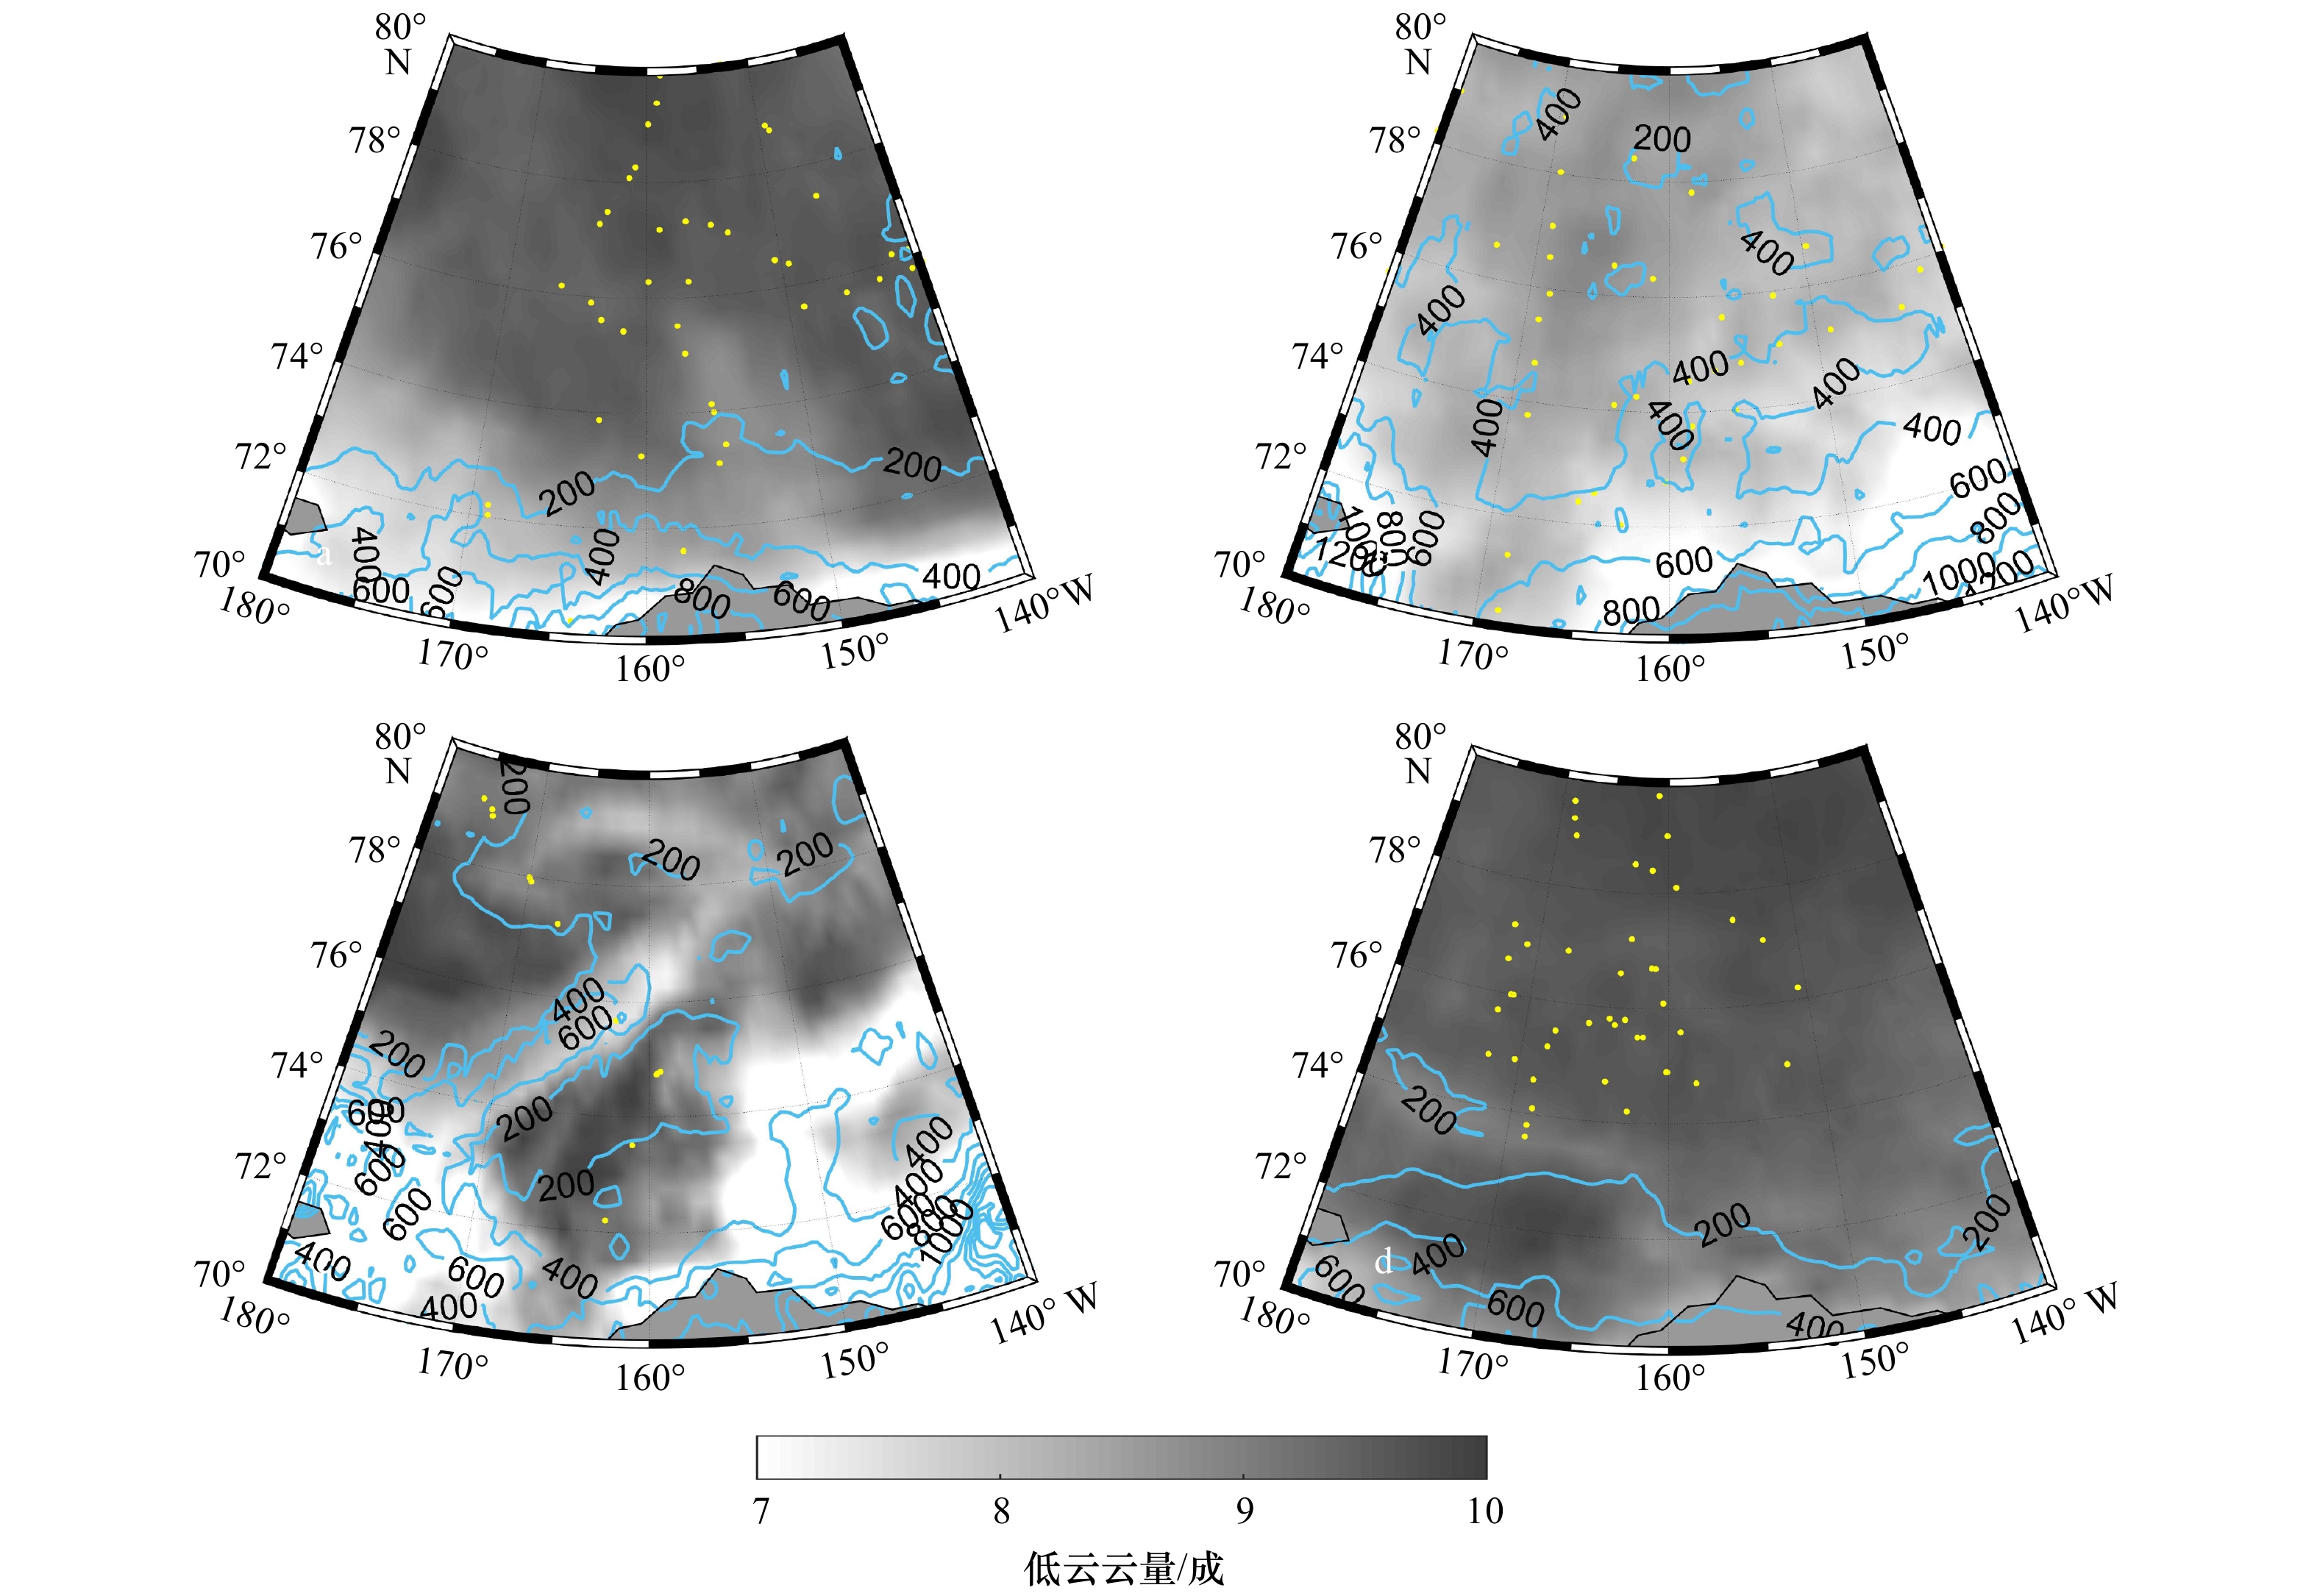
图 8 观测期间平均低云云量(填色)和云底高度(蓝色实线)分布
a. 2014年7月31日至8月16日、8月28日至9月8日;b. 2016年7月25日至8月3日、8月17日至9月2日;c. 2017年8月1日至8月5日;d. 2018年7月31日至8月11日、8月28日至9月4日,黄色圆点为探空初始位置
Fig. 8 The average cloud cover (shaded) and cloud base height (blue contour) during the observation period
a. 31 July to 16 August and 28 August to 8 September 2014; b. 25 July to 3 August and 17 August to 2 September 2016; c. 1 August to 5 August 2017; d. 31 July to 11 August and 28 August to 4 September 2018, respectively. The yellow dots represent the initial position of the observation
表 1 北极夏季最强边界层逆温参数与前人8月份的观测结果对比
Tab. 1 The comparison of the strongest boundary layer temperature inversion in summer in the Arctic with the previous studies in August
 下载: 导出CSV
-
[1] Zou Han, Zhou Libo, Jian Yongxiao, et al. Arctic upper air observations on Chinese Arctic research expedition 1999[J]. Polar Meteorology Glaciology, 2001, 15: 141−146. [2] Deser C, Tomas R, Alexander M, et al. The seasonal atmospheric response to projected Arctic sea ice loss in the late twenty-first century[J]. Journal of Climate, 2010, 23(2): 333−351. doi: 10.1175/2009JCLI3053.1 [3] Pavelsky T M, Boé J, Hall A, et al. Atmospheric inversion strength over polar oceans in winter regulated by sea ice[J]. Climate Dynamics, 2011, 36(5/6): 945−955. [4] 程刚, 高志球, 郑友飞, 等. 北极低空急流和低层逆温特征观测分析[J]. 气候与环境研究, 2013, 18(1): 23−31. doi: 10.3878/j.issn.1006-9585.2012.11001Cheng Gang, Gao Zhiqiu, Zheng Youfei, et al. A study on low-level jets and temperature inversion over the Arctic Ocean by using SHEBA data[J]. Climatic and Environmental Research, 2013, 18(1): 23−31. doi: 10.3878/j.issn.1006-9585.2012.11001 [5] Tjernström M, Graversen R G. The vertical structure of the lower Arctic troposphere analysed from observations and the ERA-40 reanalysis[J]. Quarterly Journal of the Royal Meteorological Society, 2009, 135(639): 431−443. doi: 10.1002/qj.380 [6] Serreze M C, Kahl J D, Schnell R C. Low-level temperature inversions of the Eurasian Arctic and comparisons with soviet drifting station data[J]. Journal of Climate, 1992, 5(6): 615−629. doi: 10.1175/1520-0442(1992)005<0615:LLTIOT>2.0.CO;2 [7] 马永锋, 卞林根, 周秀骥, 等. 北冰洋80°~85°N浮冰区对流层大气的垂直结构[J]. 海洋学报, 2011, 33(2): 48−59.Ma Yongfeng, Bian Lingen, Zhou Xiuji, et al. Vertical structure of troposphere in the floating ice zone over the Arctic Ocean[J]. Haiyang Xuebao, 2011, 33(2): 48−59. [8] 卞林根, 丁明虎, 林祥, 等. 北冰洋中心区夏季大气边界层结构特征及其与海冰范围变化的关系[J]. 中国科学: 地球科学, 2016, 59(5): 1057−1065. doi: 10.1007/s11430-015-5238-8Bian Lingen, Ding Minghu, Lin Xiang, et al. Structure of summer atmospheric boundary layer in the center of Arctic Ocean and its relation with sea ice extent change[J]. Science China Earth Sciences, 2016, 59(5): 1057−1065. doi: 10.1007/s11430-015-5238-8 [9] Bian Lingen, Ma Yongfeng, Lu Changgui, et al. The vertical structure of the atmospheric boundary layer over the central Arctic Ocean[J]. Acta Oceanologica Sinica, 2013, 32(10): 34−40. doi: 10.1007/s13131-013-0363-8 [10] Palo T, Vihma T, Jaagus J, et al. Observations of temperature inversions over central Arctic sea ice in summer[J]. Quarterly Journal of the Royal Meteorological Society, 2017, 143(708): 2741−2754. doi: 10.1002/qj.3123 [11] 曲绍厚, 胡非, 李亚秋, 等. 北冰洋及其邻近海域极昼期间大气边界层结构特征试验研究[J]. 地球物理学报, 2002, 45(1): 8−16. doi: 10.3321/j.issn:0001-5733.2002.01.002Qu Shaohou, Hu Fei, Li Yaqiu, et al. Experiment research on the characteristics of ABL structure over the Arctic Ocean and adjacent sea area during the polar day period[J]. Chinese Journal of Geophysics, 2002, 45(1): 8−16. doi: 10.3321/j.issn:0001-5733.2002.01.002 [12] 卞林根, 陆龙骅, 张占海, 等. 北冰洋浮冰站大气边界层结构的观测研究[J]. 极地研究, 2006, 18(2): 87−97.Bian Lingen, Lu Longhua, Zhang Zhanhai, et al. Analysis of structure of atmospheric layer in ice camp over Arctic Ocean[J]. Chinese Journal of Polar Research, 2006, 18(2): 87−97. [13] Busch N, Ebel U, Kraus H, et al. The structure of the subpolar inversion-capped ABL[J]. Archives for Meteorology, Geophysics, and Bioclimatology, Series A, 1982, 31(1/2): 1−18. [14] Curry J. On the formation of polar continental air[J]. Journal of the Atmospheric Sciences, 1983, 40(9): 2278−2292. doi: 10.1175/1520-0469(1983)040<2278:OTFOCP>2.0.CO;2 [15] Kahl J D. Characteristics of the low-level temperature inversion along the Alaskan Arctic coast[J]. International Journal of Climatology, 1990, 10(5): 537−548. doi: 10.1002/joc.3370100509 [16] Vihma T, Hartmann J, Lüpkes C. A case study of an on-ice air flow over the Arctic marginal sea-ice zone[J]. Boundary-Layer Meteorology, 2003, 107(1): 189−217. doi: 10.1023/A:1021599601948 [17] Vihma T, Kilpeläinen T, Manninen M, et al. Characteristics of temperature and humidity inversions and low-level jets over Svalbard fjords in spring[J]. Advances in Meteorology, 2011, 2011: 486807. [18] Vihma T, Pirazzini R, Fer I, et al. Advances in understanding and parameterization of small-scale physical processes in the marine Arctic climate system: A review[J]. Atmospheric Chemistry and Physics, 2014, 14(17): 9403−9450. doi: 10.5194/acp-14-9403-2014 [19] WMO, Nash J, Oakley T, et al. WMO intercomparison of high quality radiosonde systems[R]. Yangjiang, China: WMO, 2011. [20] 李伟, 赵培涛, 郭启云, 等. 国产GPS探空仪国际比对试验结果[J]. 应用气象学报, 2011, 22(4): 453−462. doi: 10.3969/j.issn.1001-7313.2011.04.008Li Wei, Zhao Peitao, Guo Qiyun, et al. The international radiosonde intercomparison results for China-made GPS radiosonde[J]. Journal of Applied Meteorological Science, 2011, 22(4): 453−462. doi: 10.3969/j.issn.1001-7313.2011.04.008 [21] Jensen M P, Holdridge D J, Survo P, et al. Comparison of Vaisala radiosondes RS41 and RS92 at the ARM southern great plains site[J]. Atmospheric Measurement Techniques, 2016, 9(7): 3115−3129. doi: 10.5194/amt-9-3115-2016 [22] Andreas E L, Claffy K J, Makshtas A P. Low-level atmospheric jets and inversions over the western Weddell Sea[J]. Boundary-Layer Meteorology, 2000, 97(3): 459−486. doi: 10.1023/A:1002793831076 [23] Tjernström M, Leck C, Persson P O G, et al. The summertime Arctic atmosphere: Meteorological measurements during the Arctic Ocean Experiment 2001[J]. Bulletin of the American Meteorological Society, 2004, 85(9): 1305−1322. doi: 10.1175/BAMS-85-9-Tjernstrom [24] Tjernström M, Birch C E, Brooks I M, et al. Meteorological conditions in the central Arctic summer during the Arctic Summer Cloud Ocean Study (ASCOS)[J]. Atmospheric Chemistry and Physics, 12(15): 6863−6889. [25] Kahl J D, Serreze M C, Schnell R C. Tropospheric low-level temperature inversions in the Canadian Arctic[J]. Atmosphere-Ocean, 1992, 30(4): 511−529. doi: 10.1080/07055900.1992.9649453 [26] Lei Ruibo, Tian-Kunze X, Li Bingrui, et al. Characterization of summer Arctic sea ice morphology in the 135°–175°W sector using multi-scale methods[J]. Cold Regions Science and Technology, 2017, 133: 108−120. doi: 10.1016/j.coldregions.2016.10.009 [27] Lei Ruibo, Gui Dawei, Heil P, et al. Comparisons of sea ice motion and deformation, and their responses to ice conditions and cyclonic activity in the western Arctic Ocean between two summers[J]. Cold Regions Science and Technology, 2020, 170: 102925. doi: 10.1016/j.coldregions.2019.102925 [28] 魏泽勋. 中国第九次北极科学考察报告[M]. 北京: 海洋出版社, 2019.Wei Zexun. The Report of 9th Chinese National Arctic Research Expedition[M]. Beijing: China Ocean Press, 2019. [29] Tian Zhongxiang, Zhang Dongqi, Song Xiaojiang, et al. Characteristics of the atmospheric vertical structure with different sea ice covers over the Pacific sector of the Arctic Ocean in summer[J]. Atmospheric Research, 2020, 245: 105074. doi: 10.1016/j.atmosres.2020.105074 [30] 卞林根, 马永锋, 逯昌贵. 北冰洋浮冰区湍流通量观测试验及参数化研究[J]. 海洋学报, 2011, 33(2): 27−35.Bian Lingen, Ma Yongfeng, Lu Changgui. Experiment of turbulent flux near surface layer and its parameterizations on an drift ice over the Arctic Ocean[J]. Haiyang Xuebao, 2011, 33(2): 27−35. [31] 史久新, 赵进平, 矫玉田, 等. 太平洋入流及其与北冰洋异常变化的联系[J]. 极地研究, 2004, 16(3): 253−260.Shi Jiuxin, Zhao Jinping, Jiao Yutian, et al. Pacific inflow and its links with abnormal variations in the Arctic Ocean[J]. Chinese Journal of Polar Research, 2004, 16(3): 253−260. [32] 李院生. 中国第七次北极科学考察报告[M]. 北京: 海洋出版社, 2018.Li Yuansheng. The Report of 7th Chinese National Arctic Research Expedition[M]. Beijing: China Ocean Press, 2018. [33] Lüpkes C, Vihma T, Jakobson E, et al. Meteorological observations from ship cruises during summer to the central Arctic: A comparison with reanalysis data[J]. Geophysical Research Letters, 2010, 37(9): L09810. [34] Graham R M, Rinke A, Cohen L, et al. A comparison of the two Arctic atmospheric winter states observed during N-ICE2015 and SHEBA[J]. Journal of Geophysical Research: Atmospheres, 2017, 122(11): 5716−5737. doi: 10.1002/2016JD025475 -

计量
- 文章访问数: 403
- HTML全文浏览量: 131
- PDF下载量: 59
- 被引次数: 0
