

Assessment of the ability of CMIP6 models to simulate the heat content of the Arctic Ocean
-
摘要: 本文利用PHC、ECCO2、SODA、GECCO3和CMIP6资料,分析了北冰洋热含量的水平分布特征、季节变化和长期变化趋势等,评估了CMIP6模式对北冰洋海洋热含量的模拟能力。研究发现,北冰洋海洋热含量表现出明显的季节变化:热含量在4月份最低,9月份最高;在历史情形下(1850−2014年),相较观测和再分析资料,CMIP6多模式集合平均(MME)的上层500 m热含量在格陵兰海偏暖,在挪威海、巴伦支海和欧亚海盆偏冷,MME的全水深热含量在北冰洋几乎所有区域均偏暖,在格陵兰海偏差最大;CMIP6模式对北冰洋温度剖面模拟偏差较大,MME平均温度在1 000 m以深均高于观测和再分析资料。在未来情形下(2015−2100年),MME表现出明显的北冰洋增暖情形,但绝大多数中国模式没有表现出明显的增暖情形。中国模式中,BCC-CSM2-MR和BCC-ESM1对北冰洋年平均热含量的模拟较差,CIESM对热含量季节和年代际变化模拟较差,FIO-ESM-2-0对北冰洋上层500 m年平均热含量及热含量季节和年代际变化的模拟都比较好。Abstract: The PHC, ECCO2, SODA, GECCO3 and CMIP6 data were used to analyze the horizontal distribution characteristics, seasonal variation and long-term trend of the Arctic Ocean heat content, and analyze the simulation ability of the CMIP6 models in this paper. The results show that the heat content of the Arctic Ocean shows obvious seasonal change, with the lowest in April and the highest in September. Under historical circumstances (1850−2014), compared with the observation and reanalysis data, the heat content of the upper 500 m of the CMIP6 models ensemble average (MME) is warmer in the Greenland Sea, colder in the Norwegian sea, Barents Sea and Eurasian Basin, while the whole water column heat content of MME is warmer in almost all regions of the Arctic Ocean, with the largest deviation in the Greenland Sea. CMIP6 models have a large deviation in the simulation of Arctic Ocean temperature profile, and the average temperature of MME is higher than the observation and reanalysis data at the depth of more than 1 000 m. In the future case (2015−2100), the simulation of ocean heat content of MME shows obvious Arctic Ocean warming, but most of the Chinese models show no obvious warming situation. BCC-CSM2-MR and BCC-ESM1 are poor in simulating the annual mean heat content of the Arctic Ocean, CIESM is poor in simulating the seasonal and interdecadal variations of ocean heat content, while FIO-ESM-2-0 is good in simulating the annual heat content of the upper 500 m, the seasonal and interdecadal variations of heat content of the Arctic Ocean.
-
Key words:
- Arctic Ocean heat content /
- spatial distribution /
- seasonal variation /
- CMIP6 models /
- model assessment
-

图 1 1992–2015年基于观测和再分析资料的北冰洋长期年平均上层500 m热含量水平分布
Fig. 1 Distribution of annual average upper 500 m heat content in the Arctic Ocean from 1992 to 2015 based on the observation reanalysis data
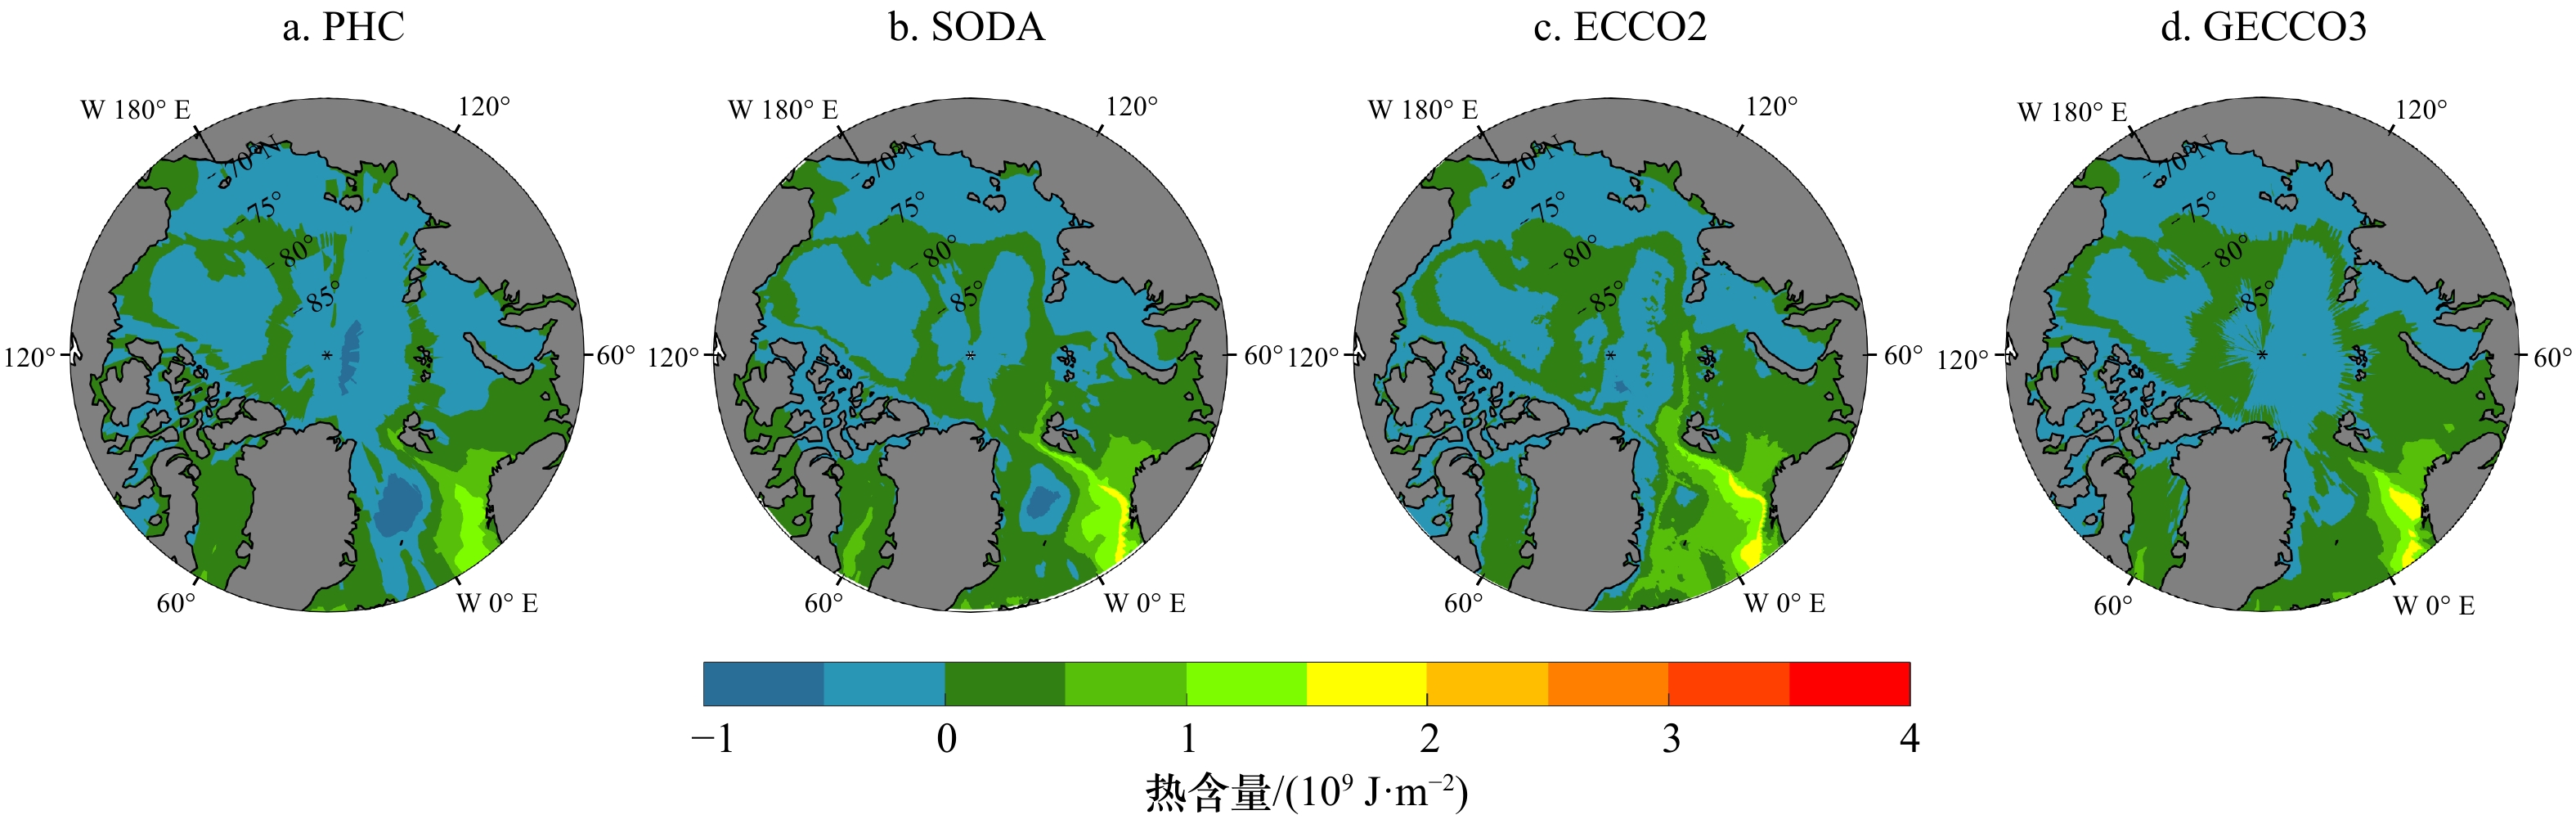
图 2 1992–2015年基于观测和再分析资料的北冰洋长期年均全水深热含量水平分布
Fig. 2 Distribution of annual average whole water heat content in the Arctic Ocean from 1992 to 2015 based on the observation reanalysis data
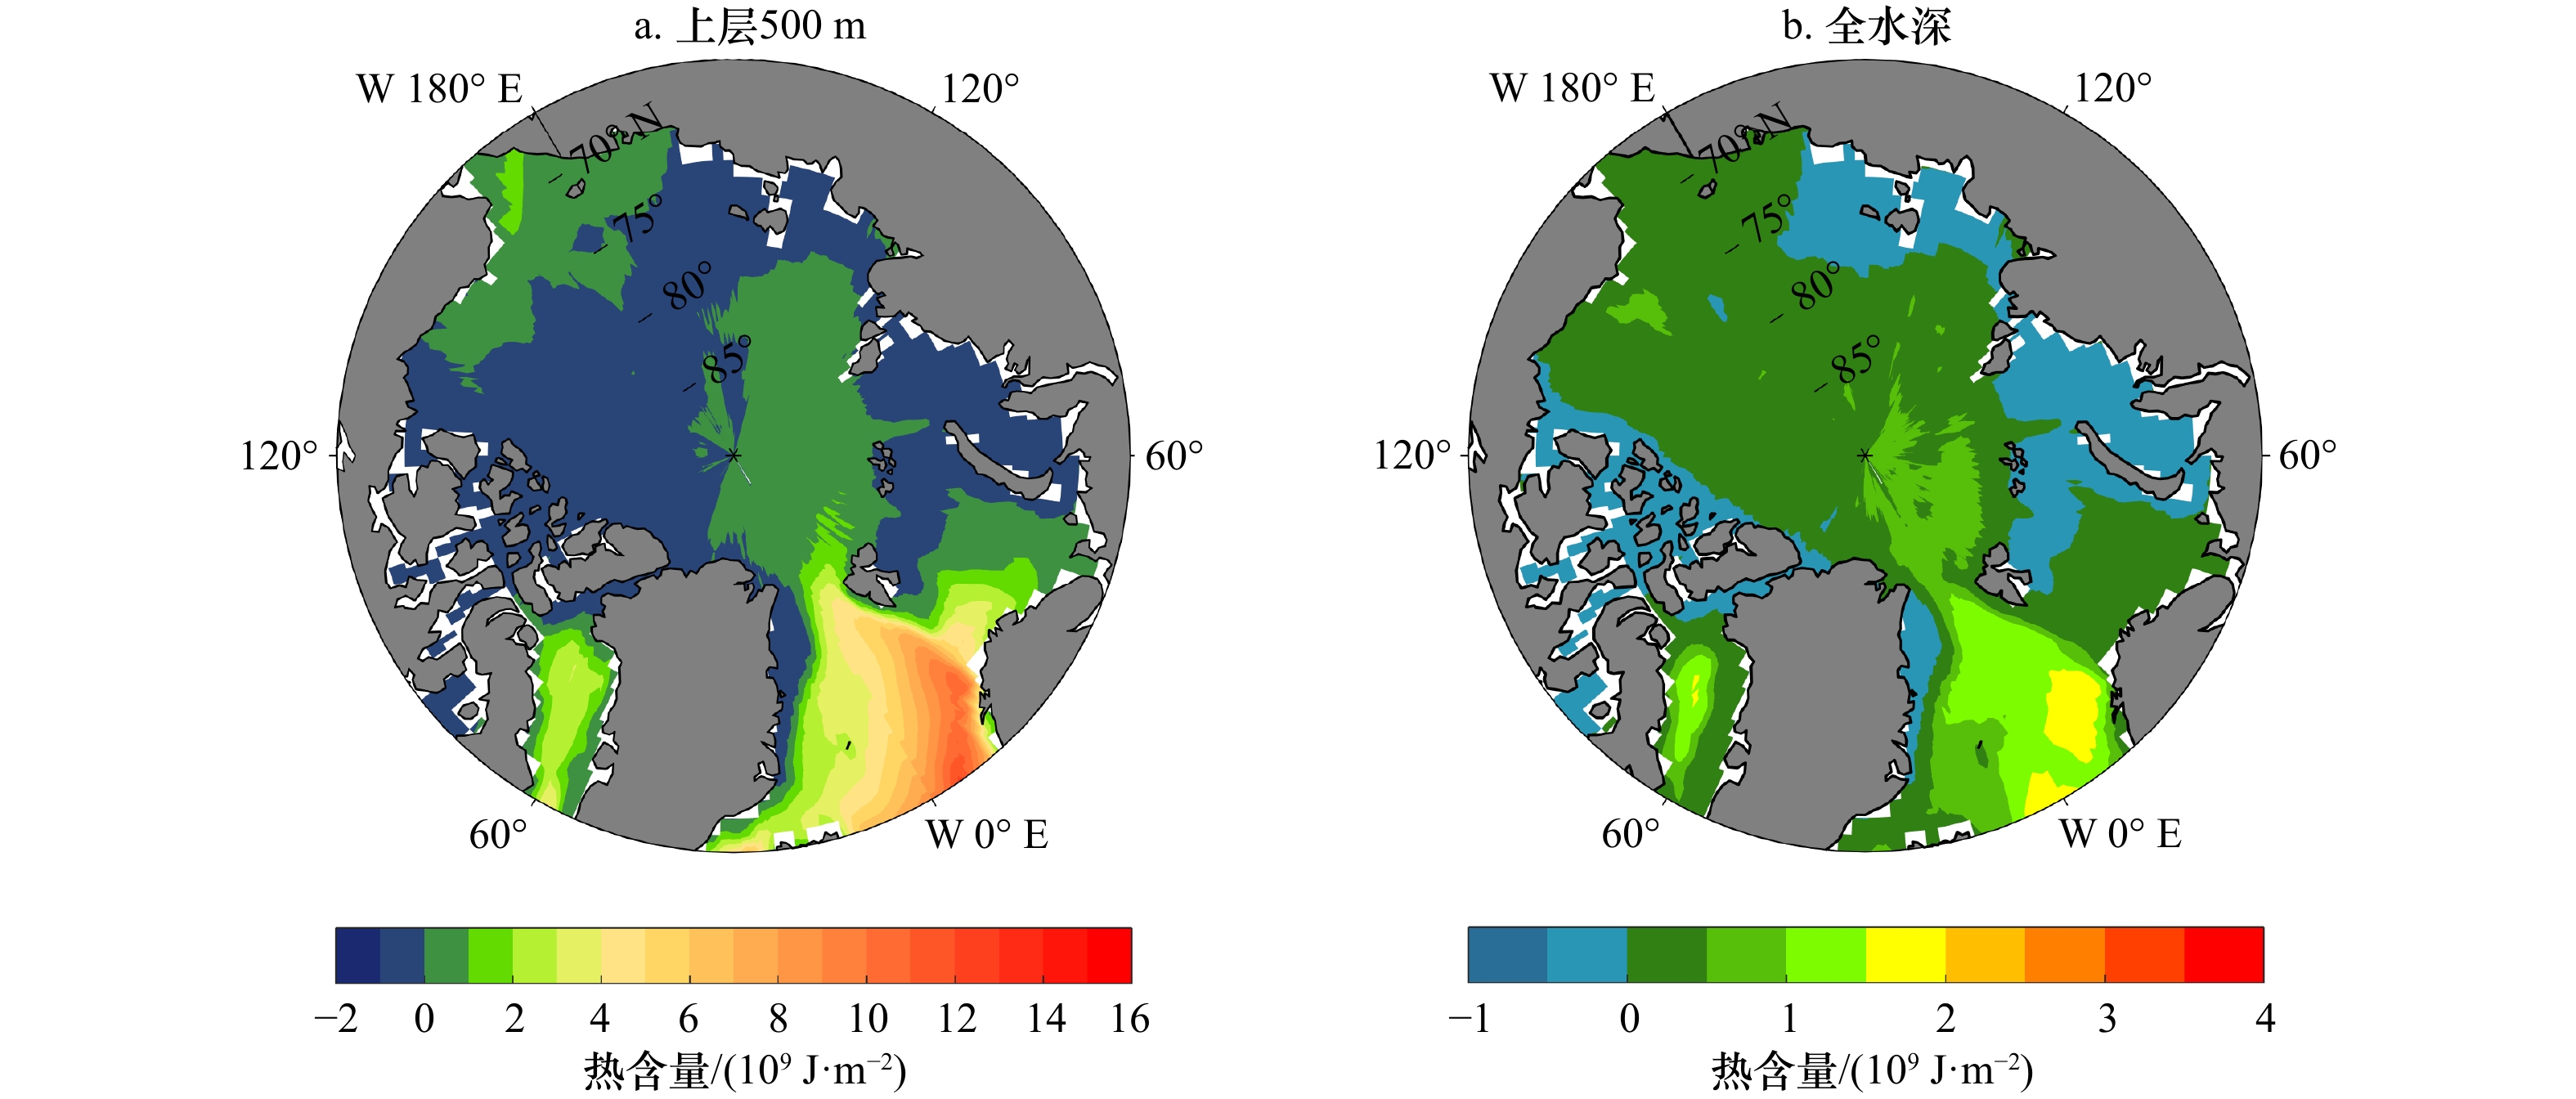
图 3 CMIP6多模式集合平均北冰洋热含量水平分布
Fig. 3 The Arctic Ocean heat content of multi-model ensemble mean

图 4 北冰洋热含量水平分布偏差
Fig. 4 Deviation of the Arctic Ocean heat content with respect to PHC and SODA, respectively

图 5 北冰洋各海盆和格陵兰海长期年平均垂直温度剖面
Fig. 5 Long-term annual mean vertical temperature profiles of the Arctic Ocean basins and Greenland Sea

图 6 中国模式与PHC的北冰洋上层500 m热含量水平分布偏差
Fig. 6 Deviation of the upper 500 m Arctic Ocean heat content of Chinese models with respect to PHC
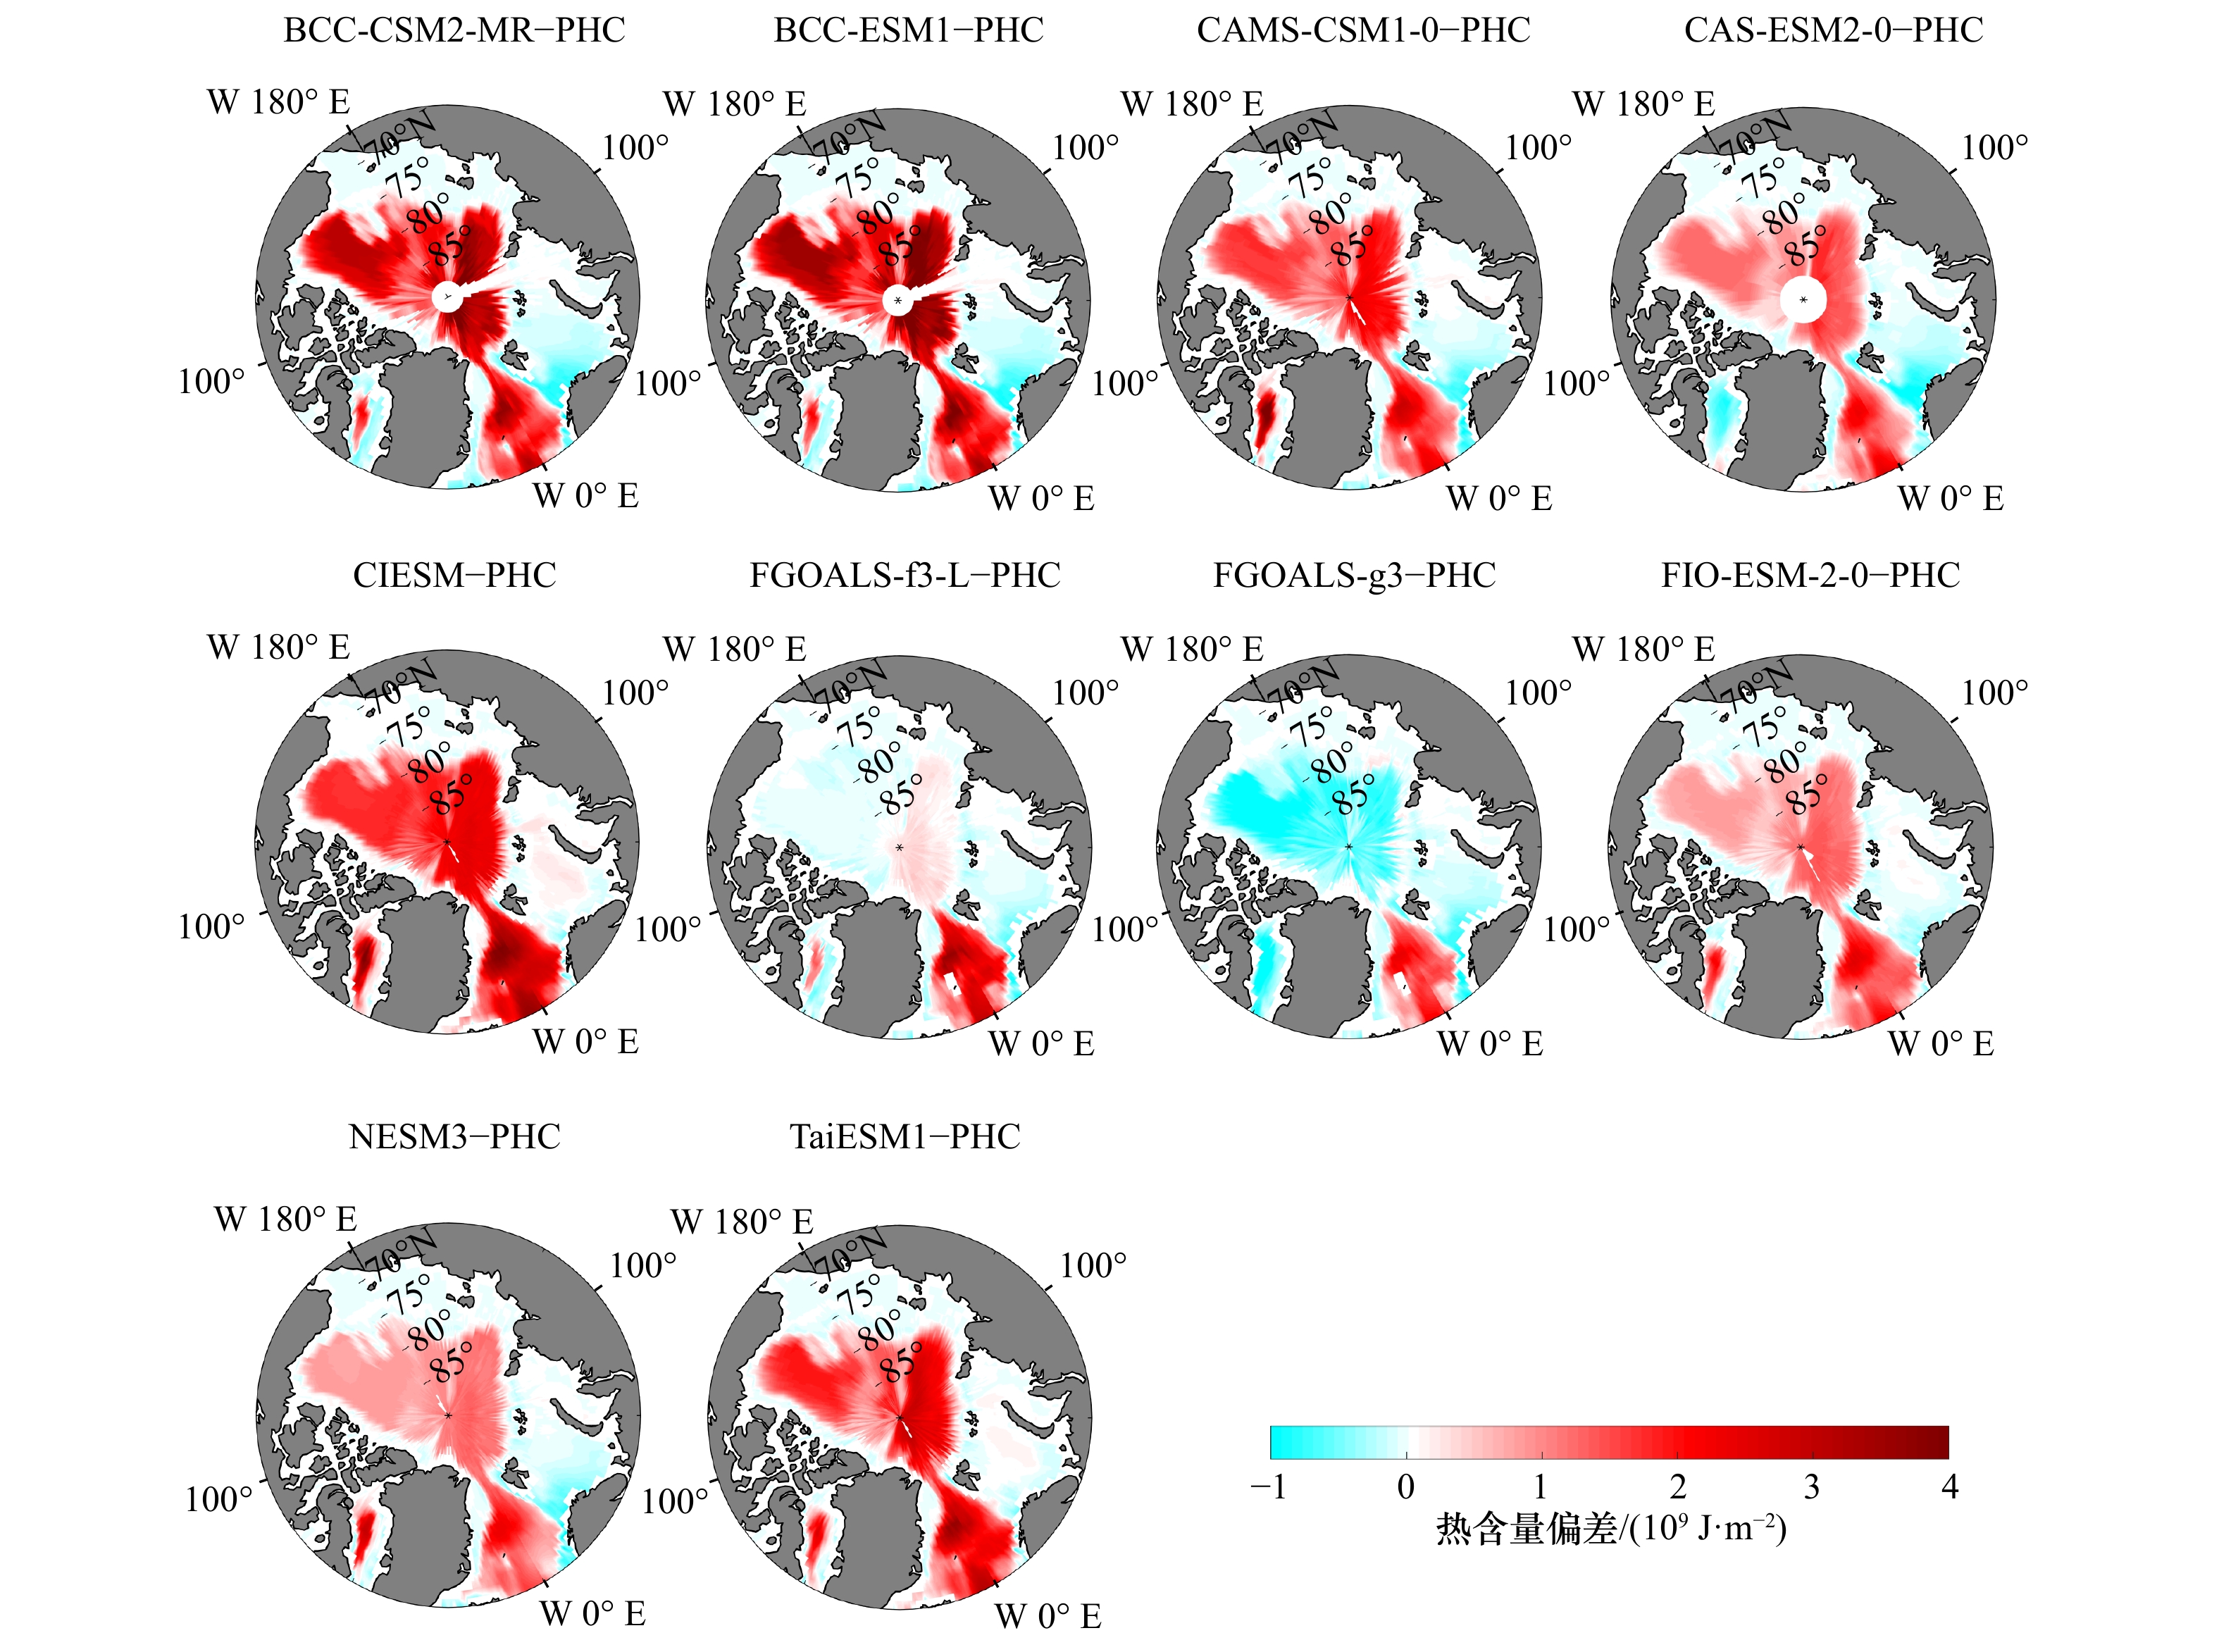
图 7 中国模式与PHC的北冰洋全水深热含量水平分布偏差
Fig. 7 Deviation of the whole water column Arctic Ocean heat content of Chinese models with respect to PHC
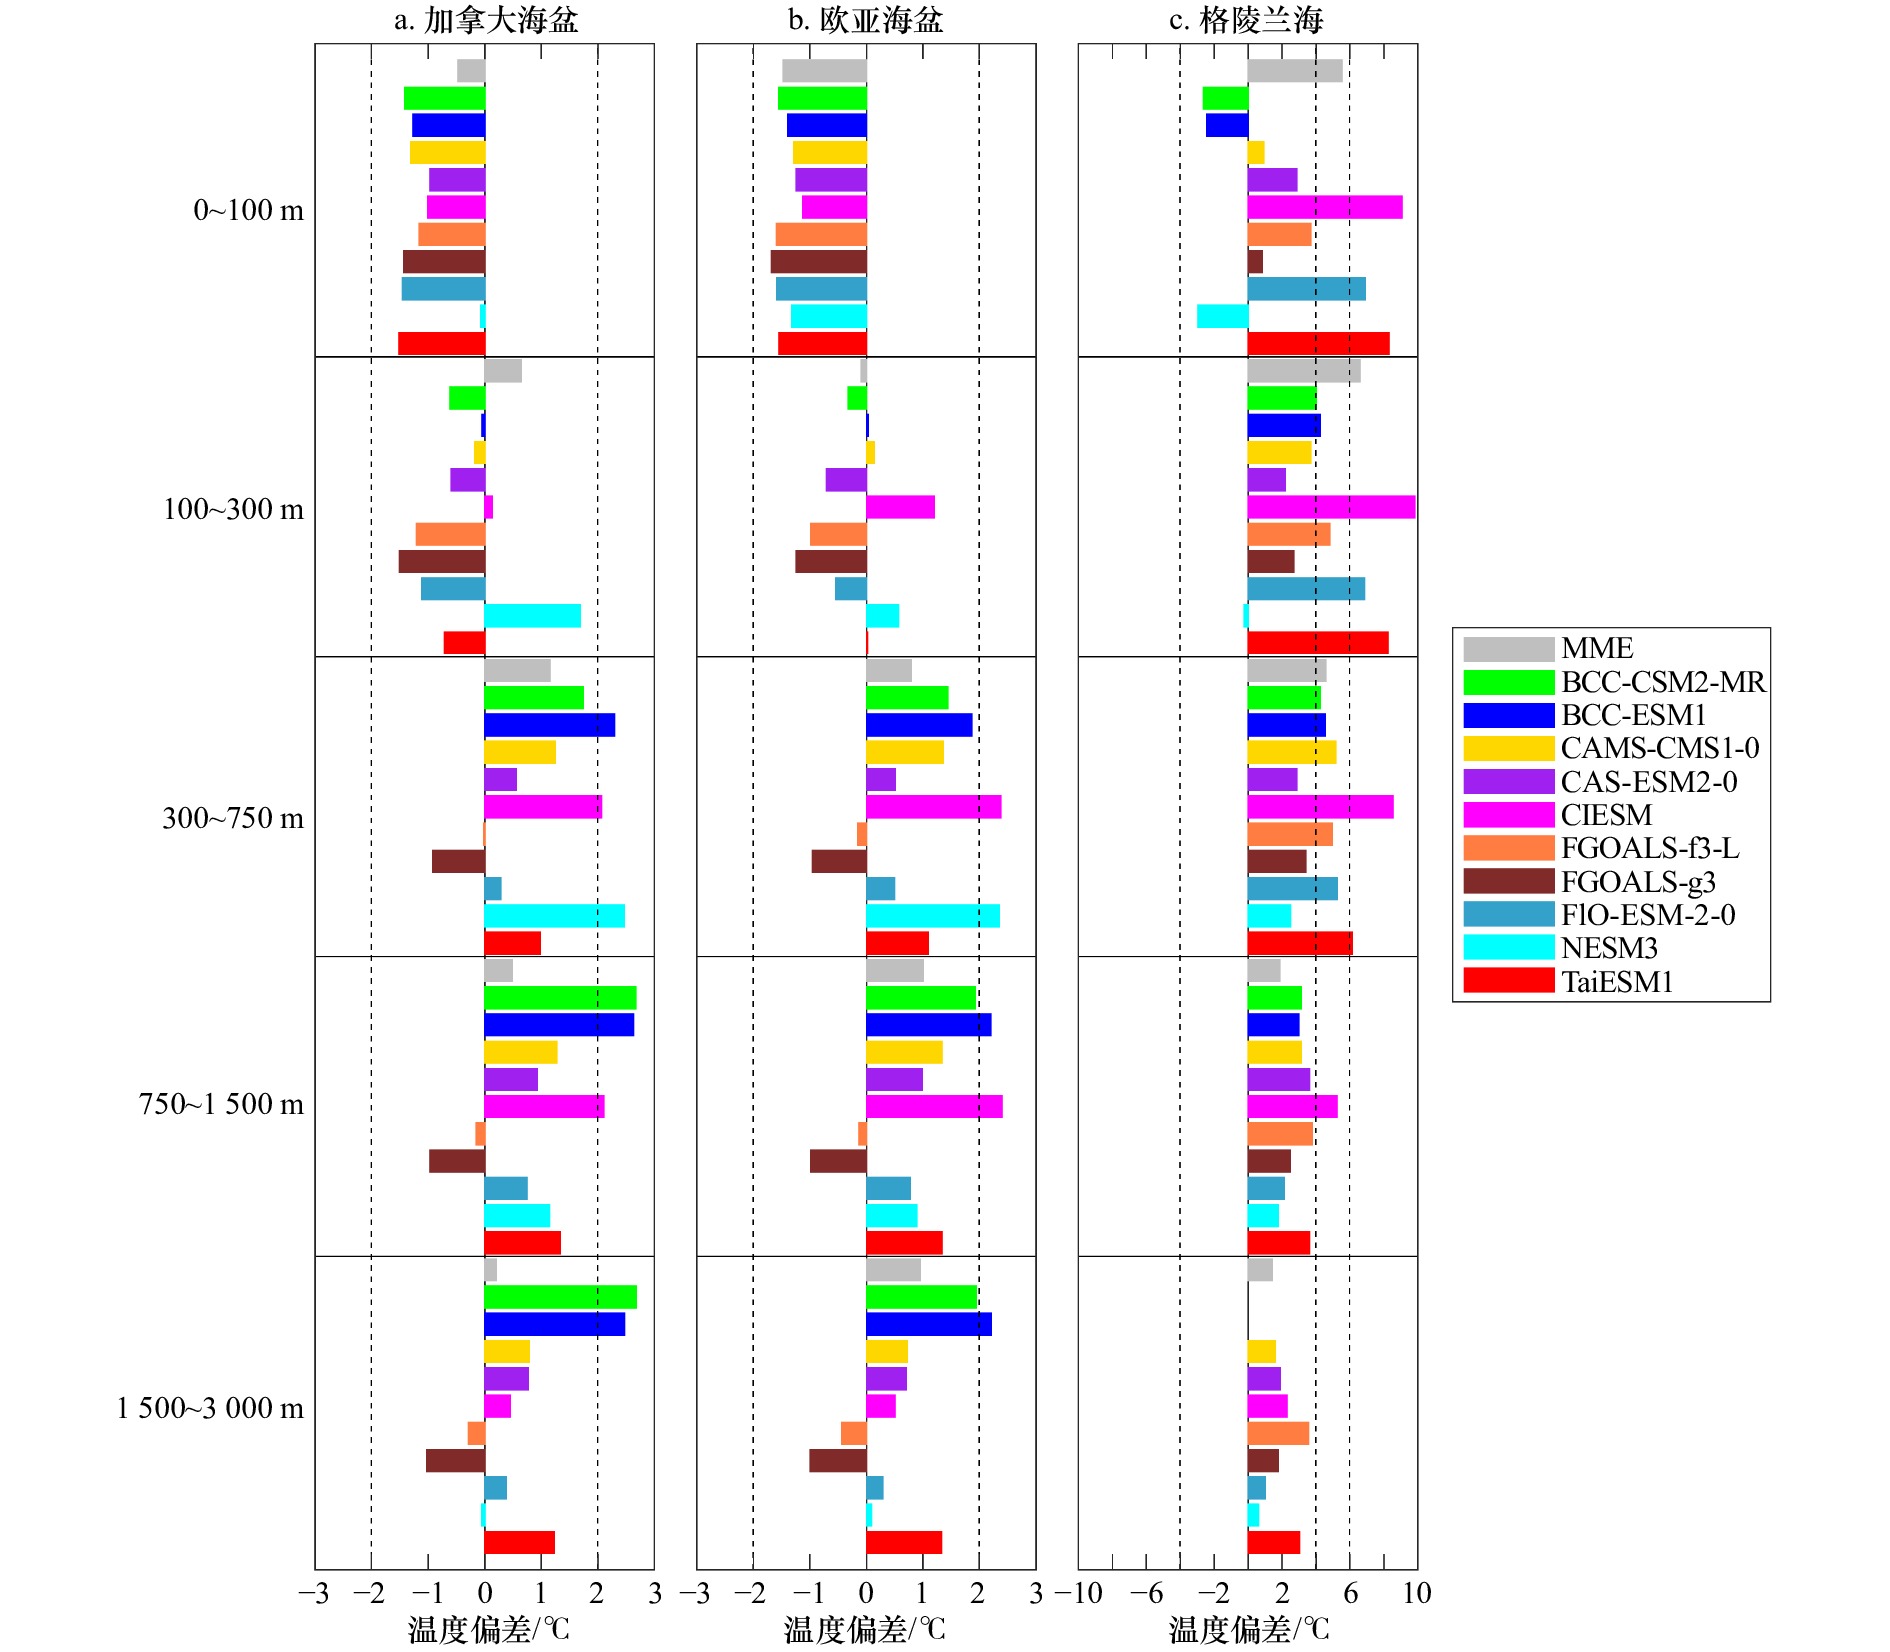
图 8 CMIP6模式平均温度剖面与PHC温度剖面的温度偏差
水平条形图代表温度偏差,正值代表模式偏暖,负值代表模式偏冷
Fig. 8 The temperature deviation between the average temperature profile of the CMIP6 models and the PHC temperature profile
Horizontal bar represents temperature deviation, positive value means that the model simulation is warmer than the PHC, negative value means model simulation is colder than PHC
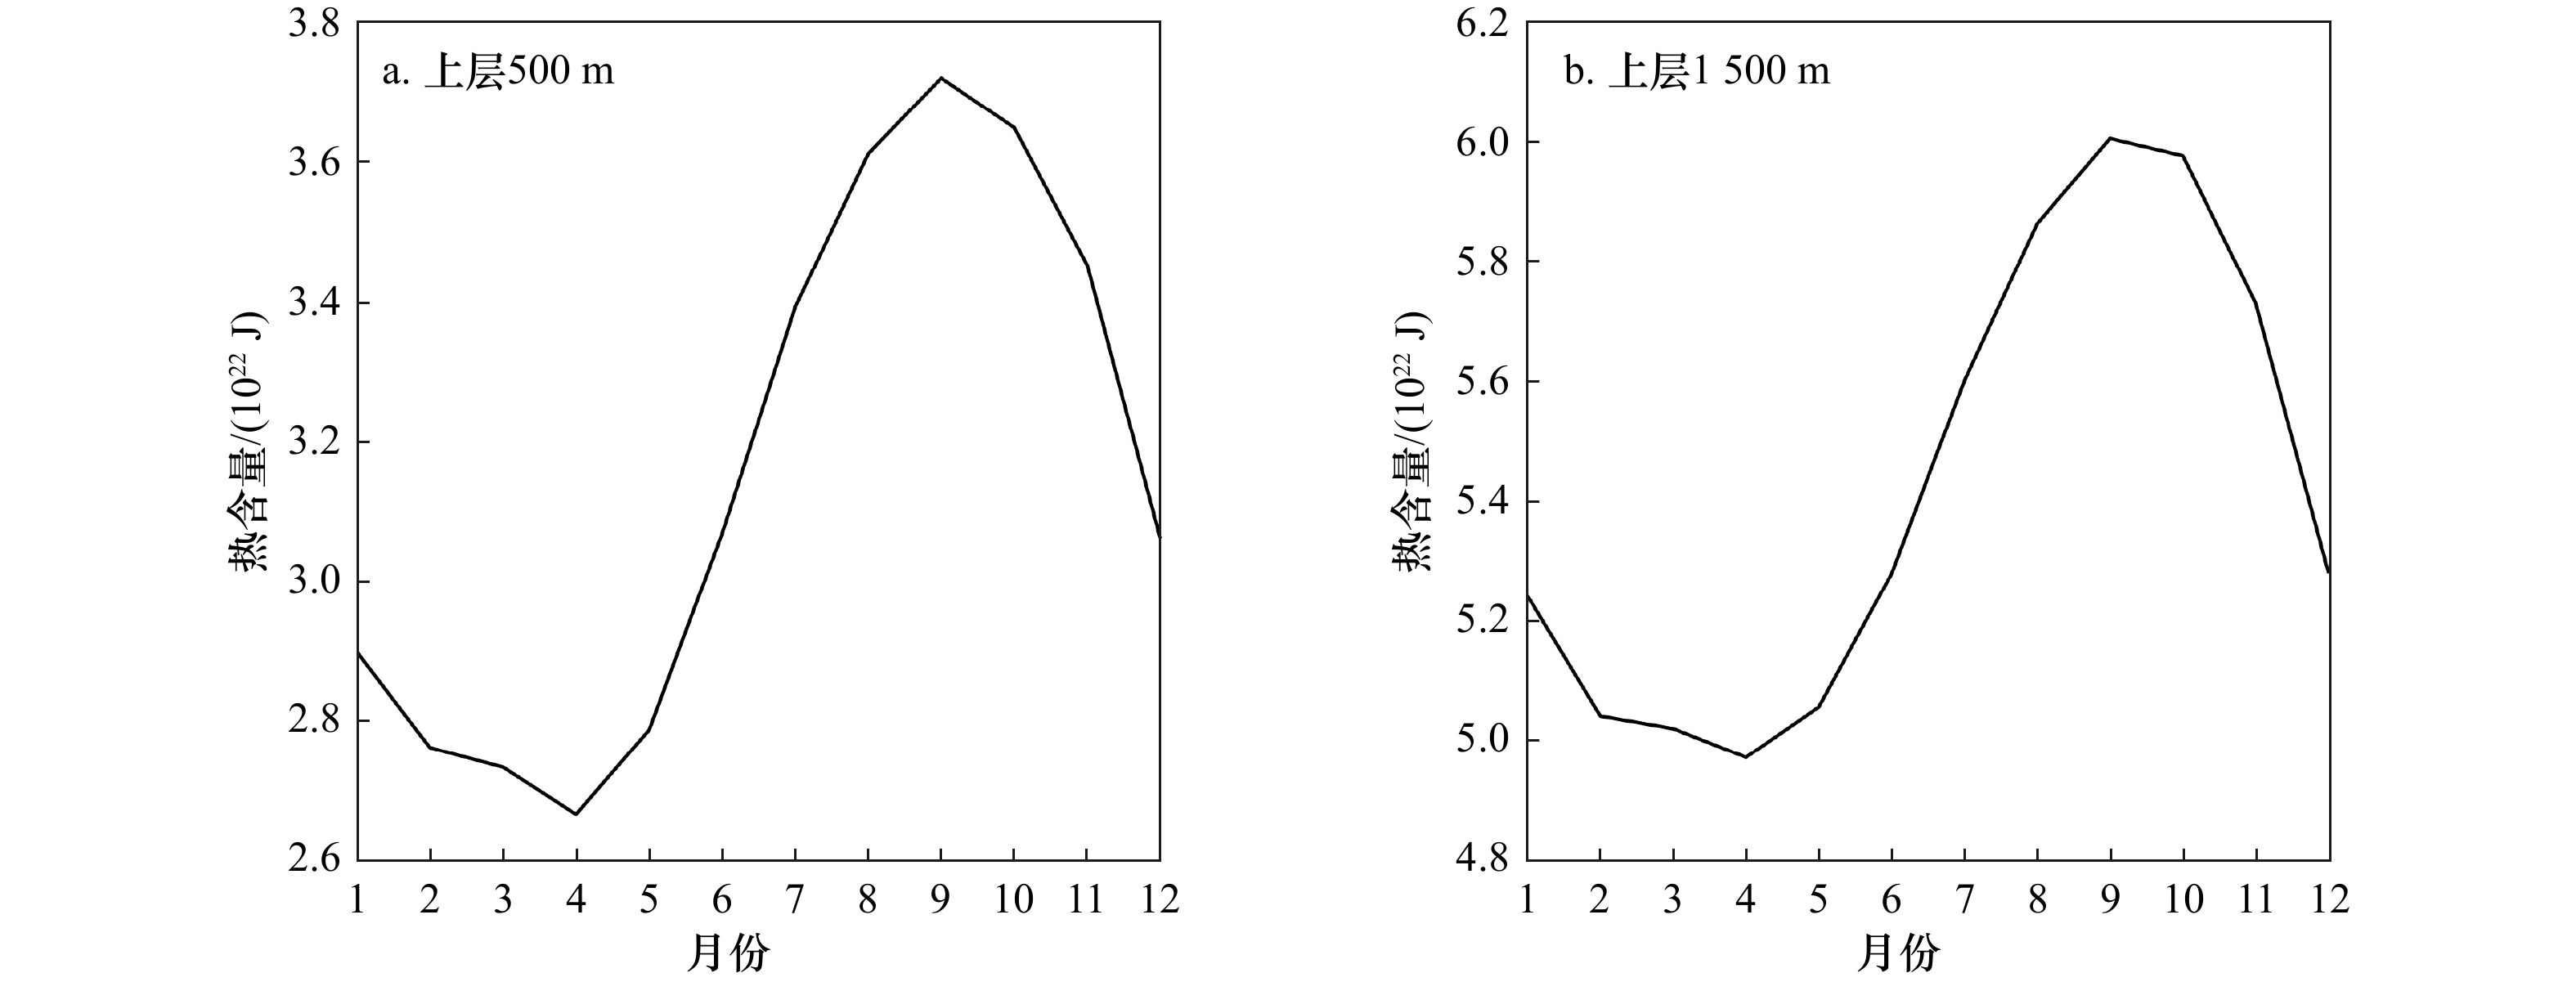
图 9 基于PHC观测资料的北冰洋热含量季节变化
Fig. 9 Seasonal variation of Arctic Ocean heat content based on the PHC observation data
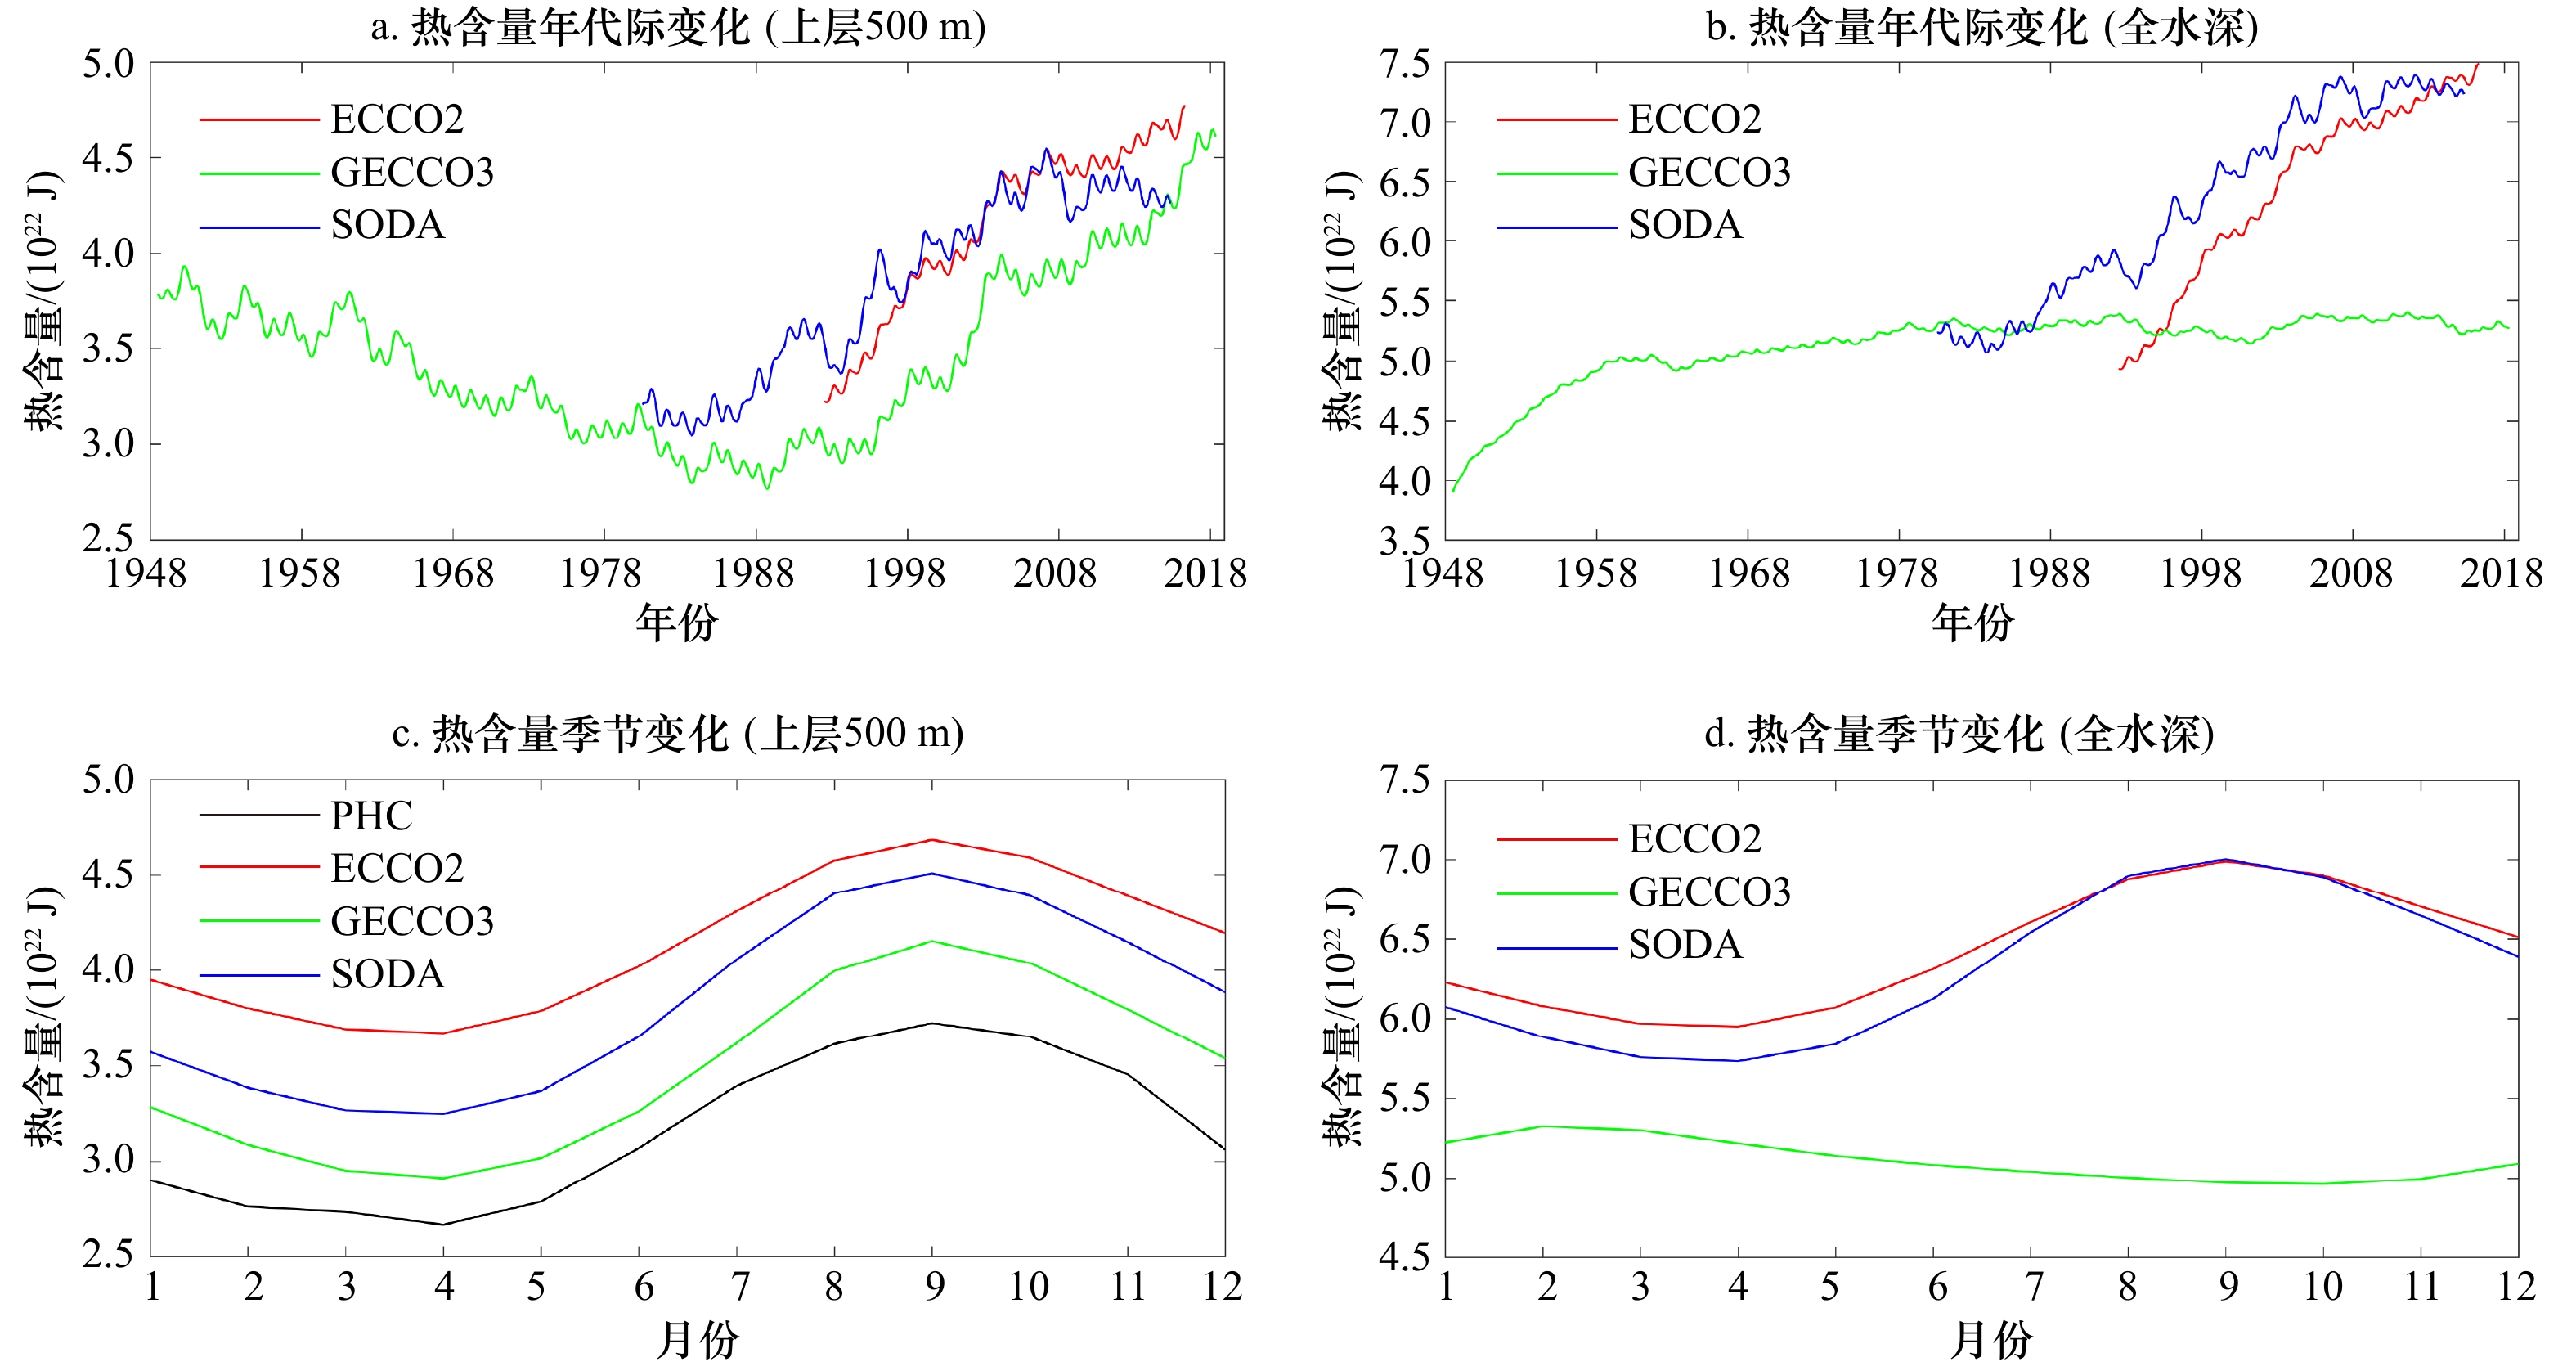
图 10 基于GECCO3、ECCO2、SODA再分析资料的北冰洋热含量年代际变化和季节变化
Fig. 10 Decadal and seasonal variations of heat content in the Arctic Ocean of GECCO3、ECCO2 and SODA reanalysis data
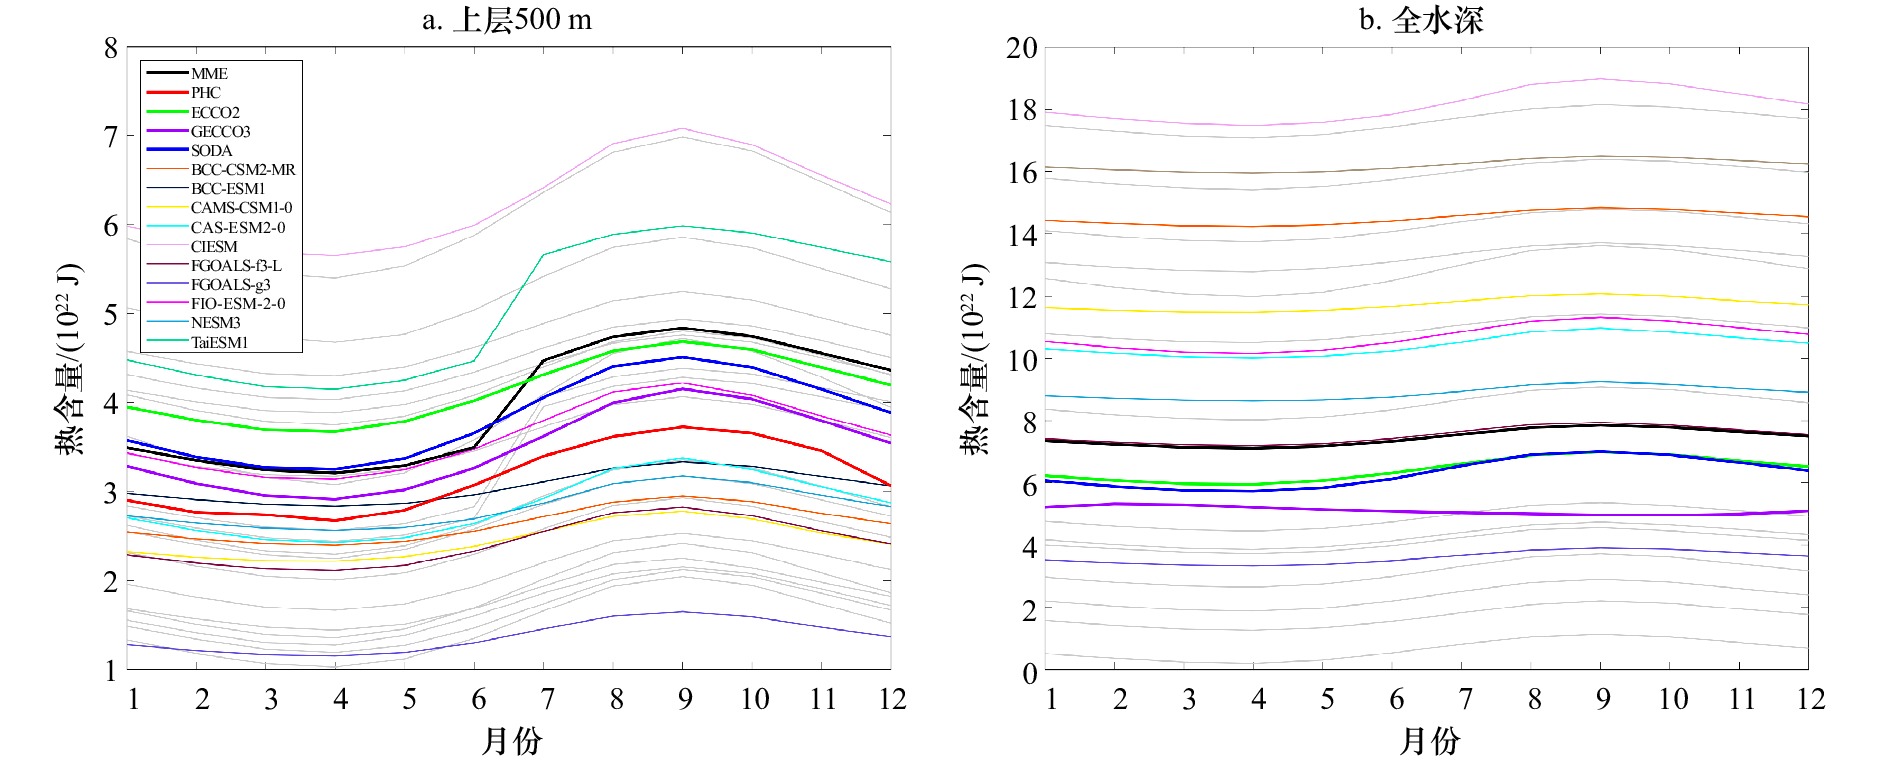
图 11 CMIP6模式模拟的北冰洋历史热含量季节变化(1850−2014年)
Fig. 11 Seasonal variation of the Arctic Ocean historical heat content of CMIP6 models (1850−2014)

图 12 CMIP6模式与PHC观测资料历史年平均热含量之间的空间泰勒图(1850−2014年)
Fig. 12 Taylor diagram of annual average heat content in history between CMIP6 models and PHC observation data (1850−2014)
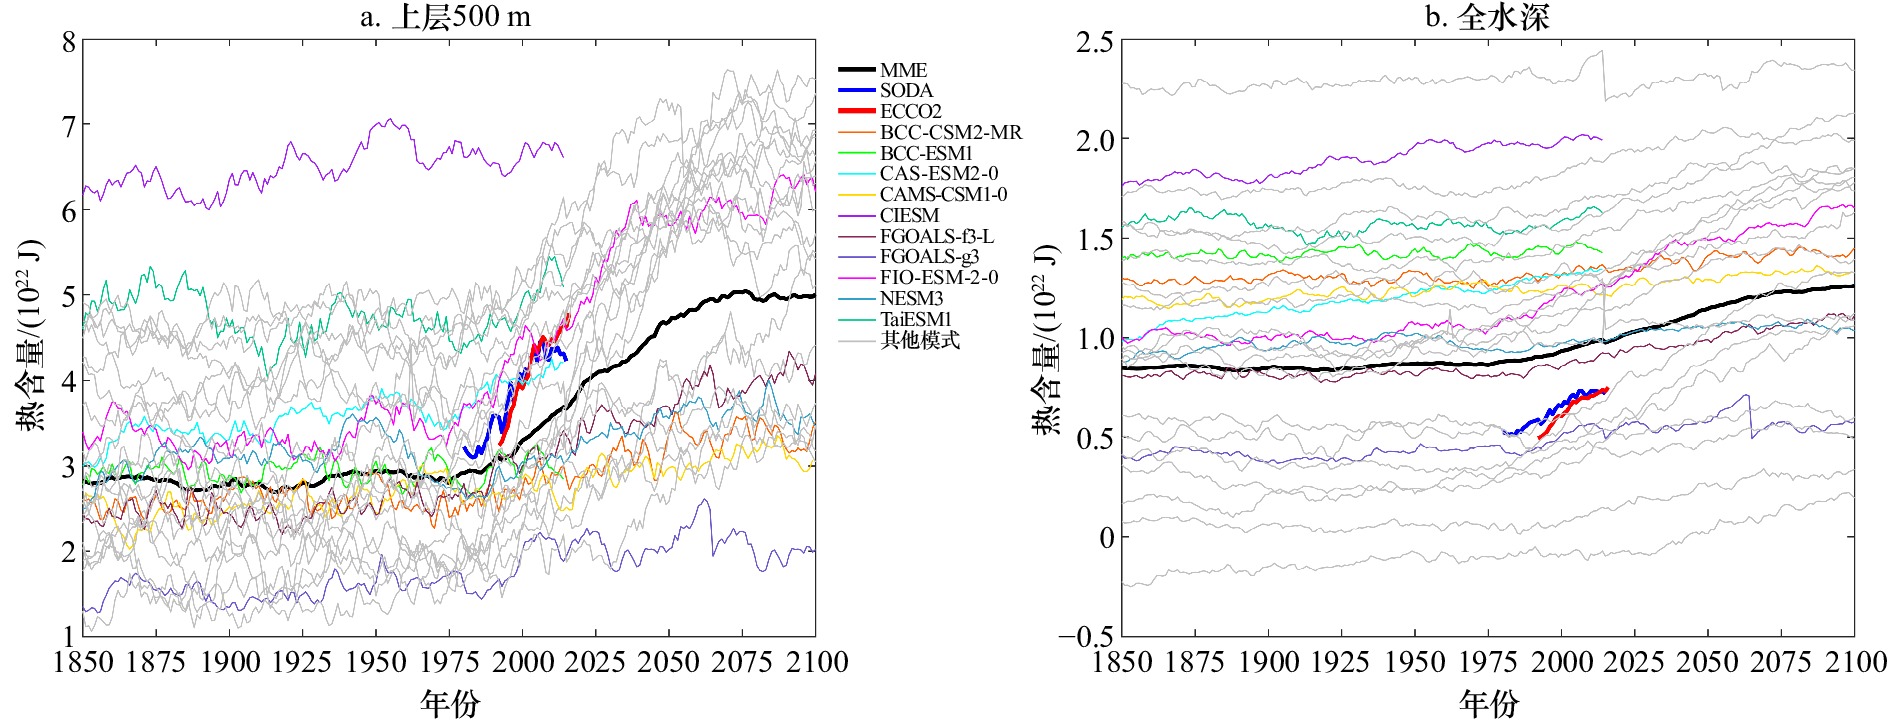
图 13 CMIP6模式模拟的北冰洋年平均热含量时间序列
Fig. 13 Time series of the Arctic Ocean annual mean heat content of CMIP6 models
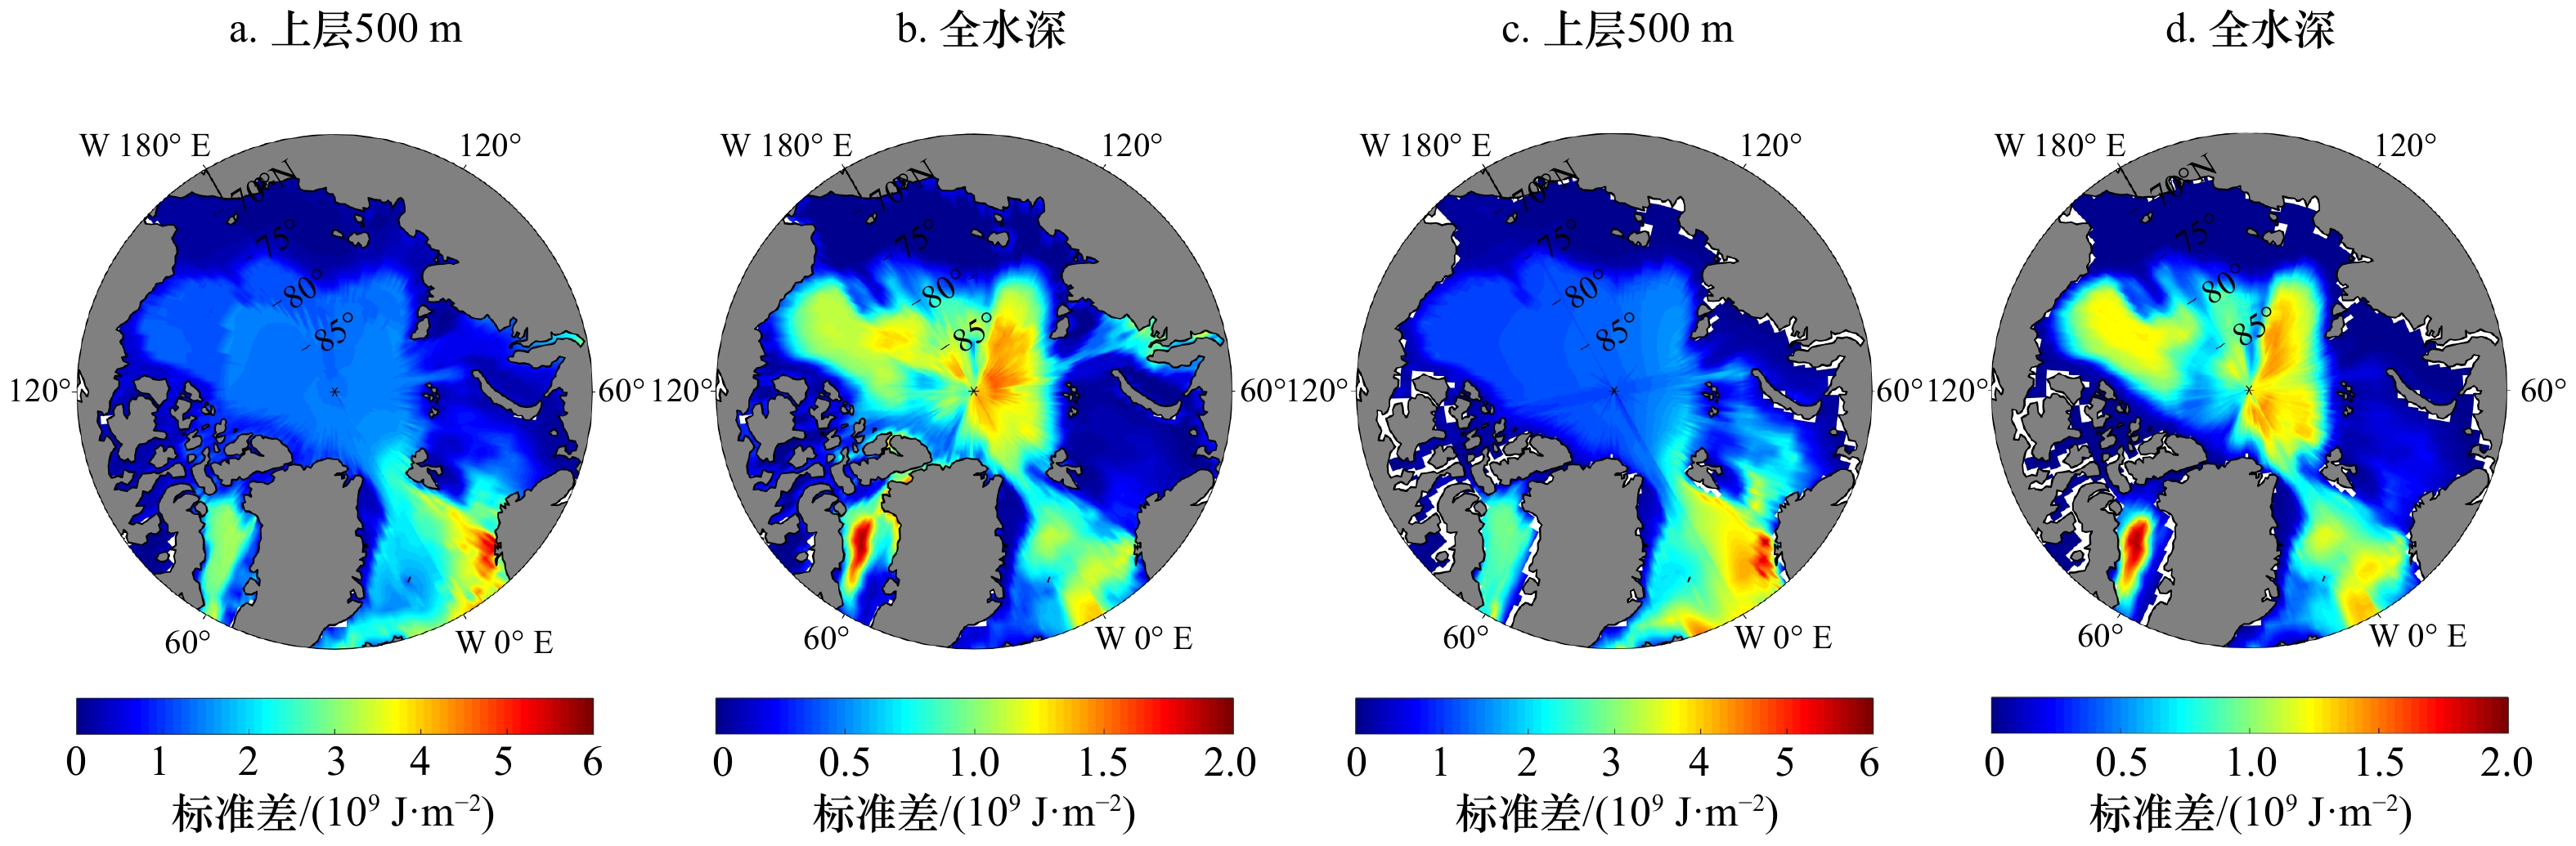
图 14 北冰洋CMIP6模式间热含量偏差的标准差
a, b. 历史;c, d. 未来
Fig. 14 Standard deviation of the Arctic Ocean heat content between models
a, b. Historical; c, d. future

图 15 北冰洋上层500 m历史热含量的CMIP6模式间EOF第一模态分布(a)和模式间序列(b)(1850–2014年)
Fig. 15 Distribution of the first EOF mode between CMIP6 models of the historical upper 500 m heat content of the Arctic Ocean (a) and sequence between models (b) (1850–2014)
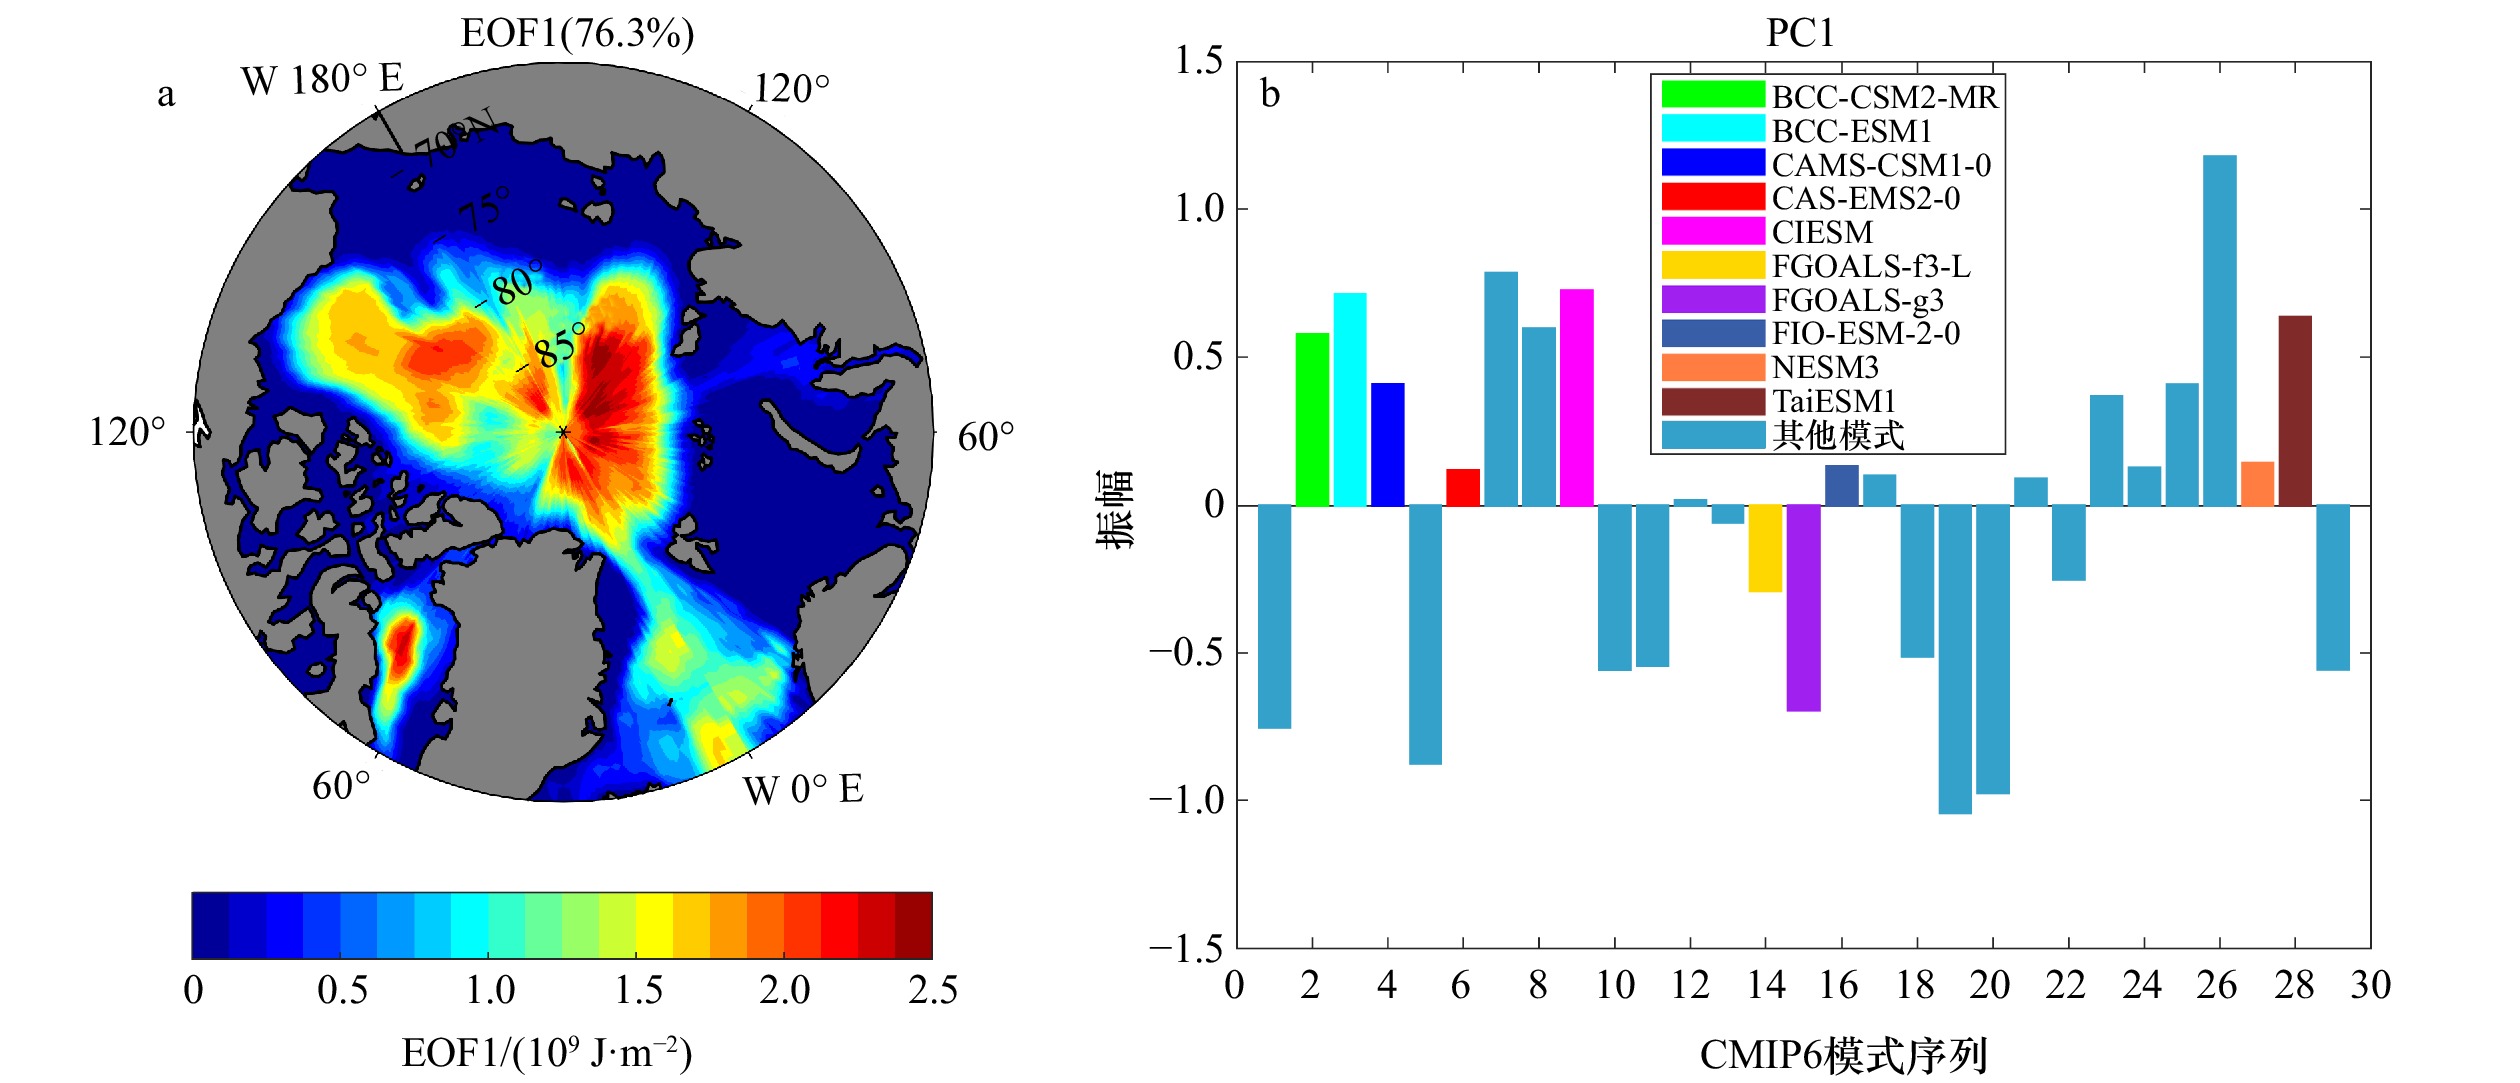
图 16 北冰洋历史全水深热含量的CMIP6模式间EOF第一模态(a)和模式间序列(b)(1850–2014年)
Fig. 16 Distribution of the first EOF mode between CMIP6 models of the historical whole water column heat content of the Arctic Ocean (a) and sequence between models (b) (1850–2014)
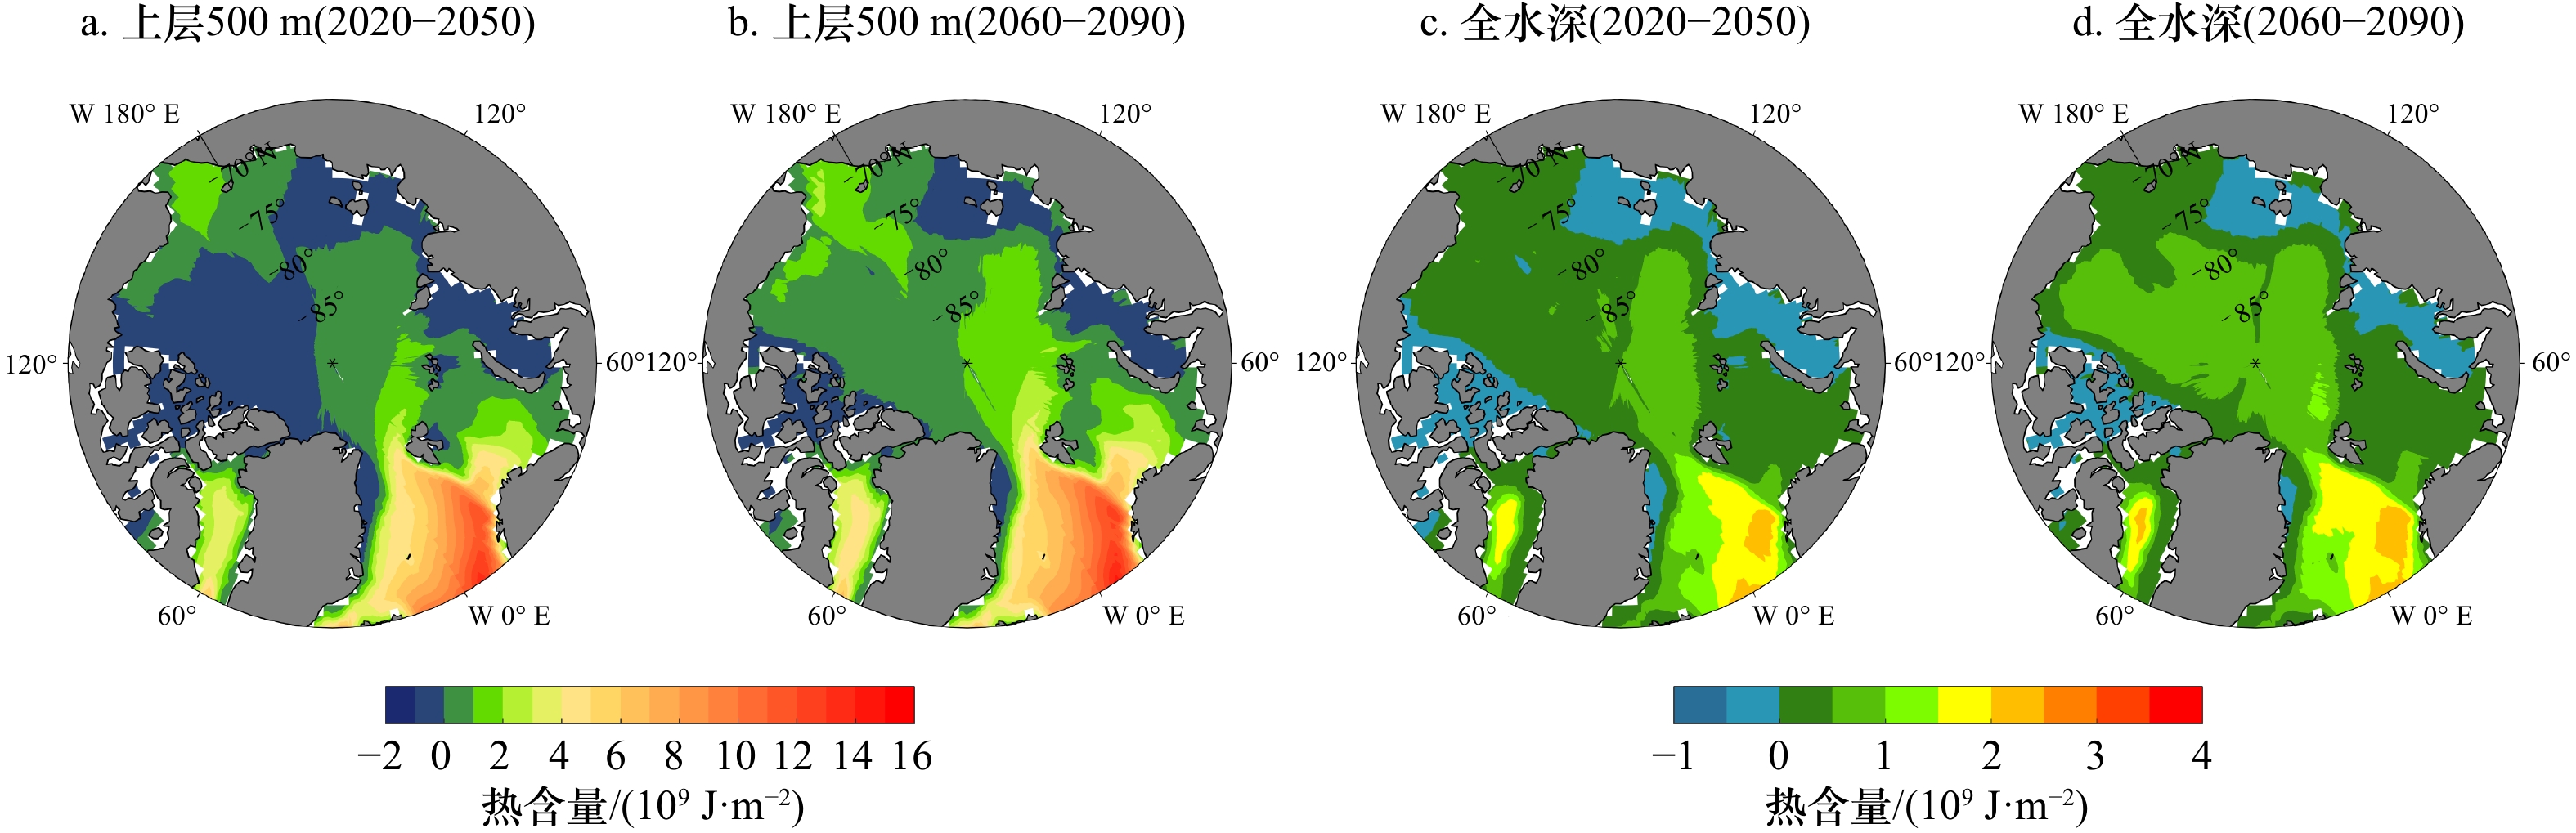
图 17 CMIP6多模式集合平均未来北冰洋热含量水平分布
Fig. 17 The future heat content of the Arctic Ocean of CMIP6 multi-model ensemble mean
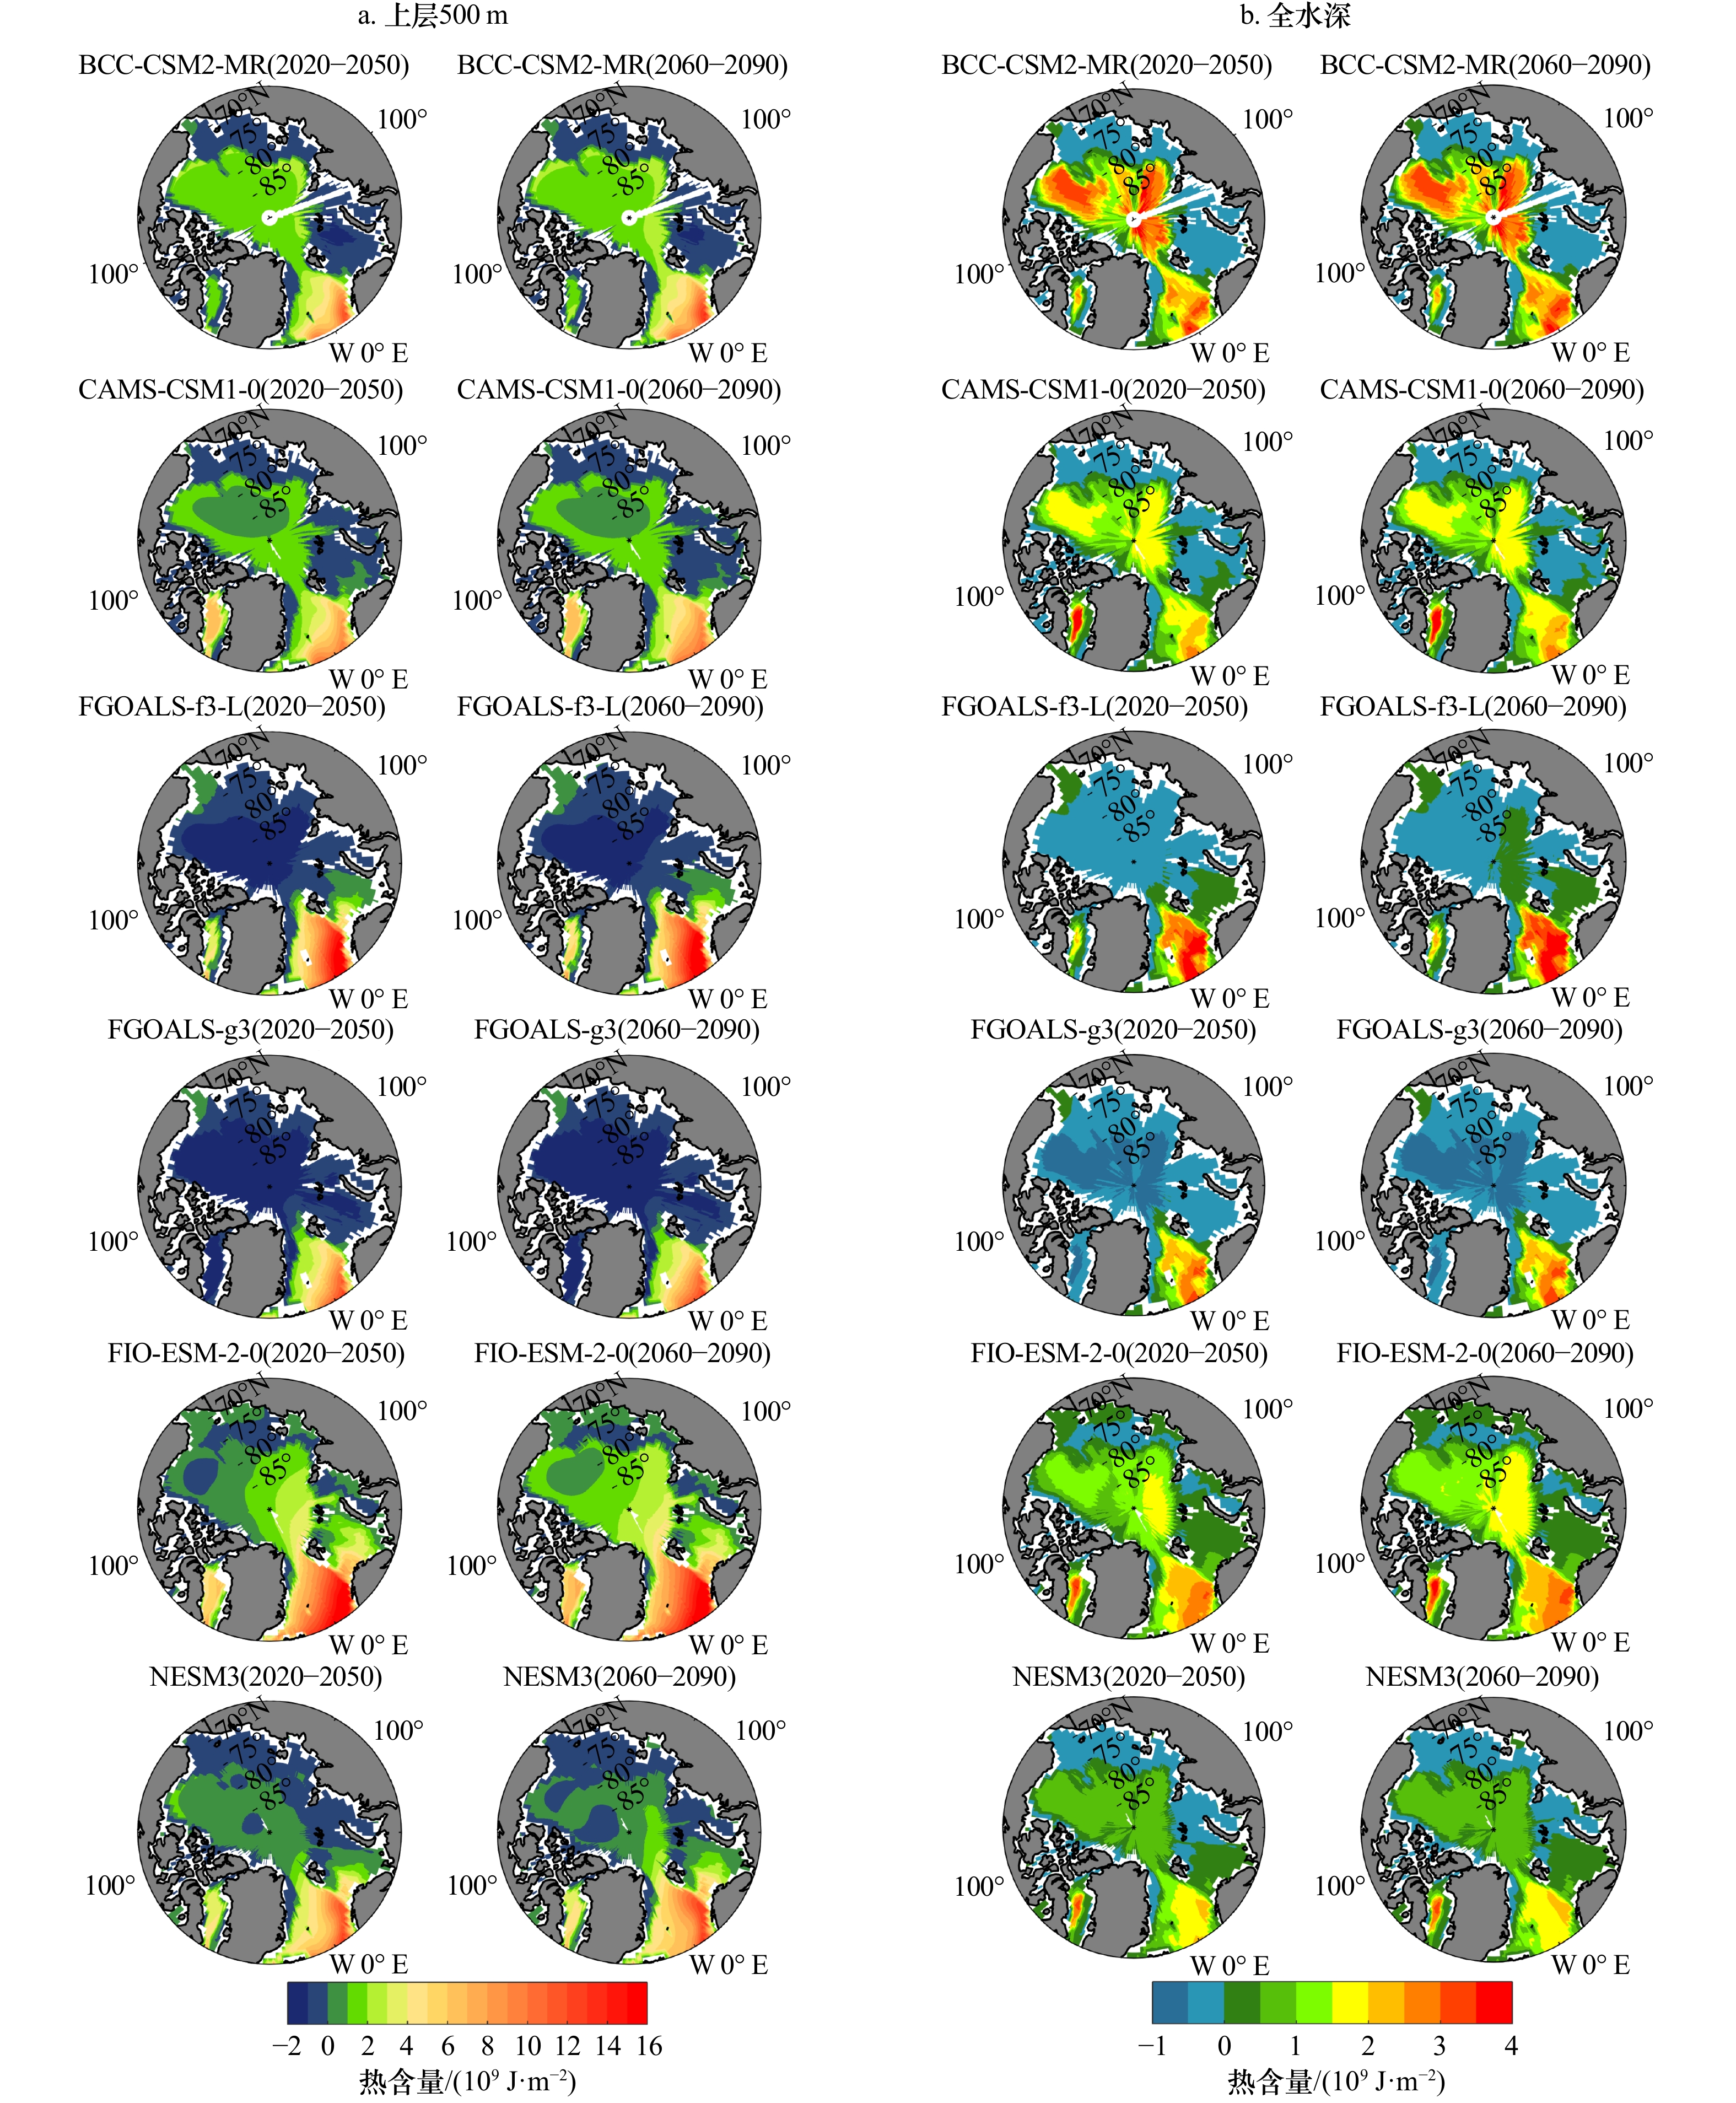
图 18 CMIP6中国模式模拟2020–2050年、2060–2090年北冰洋年平均热含量水平分布
Fig. 18 The annual mean heat content in the Arctic Ocean of CMIP6 Chinese models in 2020–2050 and 2060–2090
表 1 模式介绍
Tab. 1 Models introduction
模式 所属机构(国别) 网格 ACCESS-CM2 CSRIO-BOM(澳大利亚) 360×300×50 BCC-CSM2-MR BCC(中国) 360×232×40 BCC-ESM1 BCC(中国) 360×232×40 CAMS-CSM1-0 CAMS(中国) 360×200×50 CAS-ESM2-0 CAS(中国) 360×196×30 CanESM5 CCCMA(加拿大) 360×291×45 CESM2 NCAR(美国) 360×180×33 CESM2-WACCM NCAR(美国) 360×180×33 CIESM THU(中国) 320×384×60 CNRM-CM6-1 CNRM-CERFACS(法国) 362×294×75 CNRM-ESM2-1 CNRM-CERFACS(法国) 362×294×75 EC-Earth3 EC-Earth(欧洲) 362×292×75 EC-Earth3-Veg EC-Earth(欧洲) 362×292×75 FGOALS-f3-L CAS(中国) 360×218×30 FGOALS-g3 CAS(中国) 360×218×30 FIO-ESM-2-0 FIO(中国) 320×384×60 GFDL-ESM4 NOAA-GFDL(美国) 360×180×35 HadGEM3-GC31-LL MOHC(英国) 360×330×75 INM-CM4-8 INM(俄国) 360×180×33 INM-CM5-0 INM(俄国) 360×180×33 IPSL-CM6A-LR IPSL(法国) 362×332×75 MIROC-ES2L MIROC(日本) 360×256×63 MIROC6 MIROC(日本) 360×256×63 MPI-ESM1-2-HR MPI-M(德国) 802×404×40 MPI-ESM1-2-LR MPI-M(德国) 256×220×40 MRI-ESM2-0 MRI(日本) 360×180×61 NESM3 NUIST(中国) 362×292×46 TaiESM1 AS-RCEC(中国) 320×384×60 UKESM1-0-LL MOHC(英国) 360×330×75 注:黑色加粗字体表示的为中国模式。  下载: 导出CSV
表 2 CMIP6模式与PHC观测资料历史年平均热含量之间的标准偏差、中心均方根差和相关系数
Tab. 2 Standard deviation, center root mean square difference and correlation of annual average heat content in history between CMIP6 models and PHC observation data
模式 标准偏差 中心均方根差 相关系数 上层500 m 全水深 上层500 m 全水深 上层500 m 全水深 PHC 1.000 0 1.000 0 0.000 0 0.000 0 1.000 0 1.000 0 ACCESS-CM2 1.163 6 1.572 8 0.672 6 0.873 9 0.817 1 0.861 5 BCC-CSM2-MR 0.775 6 2.012 7 1.317 1 2.361 8 0.085 9 0.131 0 BCC-ESM1 0.833 9 2.258 5 1.357 9 2.591 1 0.089 1 0.135 8 CAMS-CSM1-0 0.684 1 1.526 3 0.598 4 1.421 0 0.811 8 0.437 6 CAS-ESM2-0 1.217 0 1.324 5 0.791 7 0.993 4 0.761 8 0.667 2 CESM2 1.147 8 1.924 4 0.410 0 1.802 5 0.936 3 0.337 9 CESM2-WACCM 1.105 0 1.714 5 0.385 5 1.542 5 0.937 7 0.454 7 CIESM 1.321 8 1.956 7 0.703 9 1.735 4 0.851 7 0.464 3 CNRM-CM6-1 0.854 4 0.968 9 0.543 0 0.510 0 0.841 6 0.866 4 CNRM-ESM2-1 0.915 1 1.083 5 0.524 9 0.537 2 0.853 4 0.870 0 CanESM5 1.089 7 1.362 5 0.661 2 0.795 9 0.803 1 0.815 8 EC-Earth3 0.929 0 1.265 5 0.467 8 0.912 5 0.884 9 0.696 9 EC-Earth3-Veg 0.973 9 1.267 9 0.474 6 0.856 5 0.884 7 0.739 0 FGOALS-f3-L 1.025 6 1.298 9 0.573 2 0.793 2 0.840 1 0.792 2 FGOALS-g3 1.054 4 1.425 9 0.684 0 0.832 0 0.779 5 0.820 9 FIO-ESM-2-0 1.101 8 1.233 0 0.389 0 0.938 5 0.936 0 0.664 9 GFDL-ESM4 1.137 0 1.480 5 0.541 1 0.986 9 0.879 5 0.749 0 HadGEM3-GC31-LL 1.099 5 1.223 5 0.558 9 0.581 1 0.862 4 0.882 4 INM-CM4-8 0.881 0 1.232 4 0.566 3 0.931 4 0.826 0 0.669 9 INM-CM5-0 0.883 1 1.344 6 0.484 1 0.815 8 0.875 0 0.665 4 IPSL-CM6A-LR 0.943 7 1.144 4 0.507 1 0.991 6 0.865 5 0.579 5 MIROC6 1.212 8 1.654 6 0.546 0 1.285 3 0.895 8 0.630 3 MIROC-ES2L 1.156 2 1.425 0 0.620 4 0.773 9 0.844 1 0.853 3 MPI-ESM1-2-HR 1.143 0 1.432 2 0.499 8 0.986 8 0.899 7 0.725 2 MPI-ESM1-2-LR 1.171 8 1.626 8 0.547 4 1.346 4 0.884 7 0.563 5 MRI-ESM2-0 1.115 3 2.316 7 0.409 0 2.233 6 0.931 0 0.297 4 NESM3 0.744 1 1.097 6 1.286 5 1.555 3 0.068 2 0.097 5 TaiESM1 1.234 7 1.778 0 0.529 7 1.602 9 0.908 7 0.447 7 UKESM1-0-LL 1.076 7 1.251 3 0.602 1 0.628 5 0.834 4 0.867 4
下载: 导出CSV
-
[1] Screen J A, Simmonds I. The central role of diminishing sea ice in recent Arctic temperature amplification[J]. Nature, 2010, 464(7293): 1334−1337. doi: 10.1038/nature09051 [2] Comiso J C. A rapidly declining perennial sea ice cover in the Arctic[J]. Geophysical Research Letters, 2002, 29(20): 17. doi: 10.1029/2002GL015650 [3] Meier W N, Stroeve J, Fetterer F. Whither Arctic sea ice? A clear signal of decline regionally, seasonally and extending beyond the satellite record[J]. Annals of Glaciology, 2007, 46: 428−434. doi: 10.3189/172756407782871170 [4] Stroeve J, Holland M M, Meier W, et al. Arctic sea ice decline: Faster than forecast[J]. Geophysical Research Letters, 2007, 34(9): L09501. [5] Comiso J C, Parkinson C L, Gersten R, et al. Accelerated decline in the Arctic sea ice cover[J]. Geophysical Research Letters, 2008, 35(1): L01703. [6] Maslanik J A, Fowler C, Stroeve J, et al. A younger, thinner Arctic ice cover: Increased potential for rapid, extensive sea-ice loss[J]. Geophysical Research Letters, 2007, 34(24): L24501. doi: 10.1029/2007GL032043 [7] Kwok R, Cunningham G F, Wensnahan M, et al. Thinning and volume loss of the Arctic Ocean sea ice cover: 2003–2008[J]. Journal of Geophysical Research: Oceans, 2009, 114(C7): C07005. [8] Meier W, Stroeve J, Fetterer F, et al. Reductions in Arctic sea ice cover no longer limited to summer[J]. Eos, Transactions American Geophysical Union, 2005, 86(36): 326. [9] Holland M M, Bitz C M, Tremblay B. Future abrupt reductions in the summer Arctic sea ice[J]. Geophysical Research Letters, 2006, 33(23): L23503. doi: 10.1029/2006GL028024 [10] Kumar A, Perlwitz J, Eischeid J, et al. Contribution of sea ice loss to Arctic amplification[J]. Geophysical Research Letters, 2010, 37(21): L21701. [11] Perovich D K, Light B, Eicken H, et al. Increasing solar heating of the Arctic Ocean and adjacent seas, 1979–2005: Attribution and role in the ice-albedo feedback[J]. Geophysical Research Letters, 2007, 34(19): L19505. doi: 10.1029/2007GL031480 [12] Serreze M C, Barrett A P, Slater A G, et al. The large-scale energy budget of the Arctic[J]. Journal of Geophysical Research: Atmospheres, 2007, 112(D11): D11122. doi: 10.1029/2006JD008230 [13] Timmermans M L, Toole J, Krishfield R. Warming of the interior Arctic Ocean linked to sea ice losses at the basin margins[J]. Science Advances, 2018, 4(8): eaat6773. doi: 10.1126/sciadv.aat6773 [14] M. S. M, Thompson B. Decadal variability of the Arctic Ocean thermal structure[J]. Ocean Dynamics, 2011, 61(7): 873−880. doi: 10.1007/s10236-011-0386-7 [15] Lique C, Steele M. Seasonal to decadal variability of Arctic Ocean heat content: A model-based analysis and implications for autonomous observing systems[J]. Journal of Geophysical Research: Oceans, 2013, 118(4): 1673−1695. doi: 10.1002/jgrc.20127 [16] Polyakov I V, Bhatt U S, Walsh J E, et al. Recent oceanic changes in the Arctic in the context of long-term observations[J]. Ecological Applications, 2013, 23(8): 1745−1764. doi: 10.1890/11-0902.1 [17] 邵秋丽, 赵进平. 北欧海深层水的研究进展[J]. 地球科学进展, 2014, 29(1): 42−55. doi: 10.11867/j.issn.1001-8166.2014.01-0042Shao Qiuli, Zhao Jinping. On the deep water of the Nordic Seas[J]. Advances in Earth Science, 2014, 29(1): 42−55. doi: 10.11867/j.issn.1001-8166.2014.01-0042 [18] Carmack E C, Macdonald R W, Perkin R G, et al. Evidence for warming of Atlantic water in the Southern Canadian Basin of the Arctic Ocean: Results from the Larsen-93 Expedition[J]. Geophysical Research Letters, 1995, 22(9): 1061−1064. doi: 10.1029/95GL00808 [19] McLaughlin F, Carmack E, Macdonald R, et al. The Canada Basin, 1989−1995: Upstream events and far-field effects of the Barents Sea[J]. Journal of Geophysical Research: Oceans, 2002, 107(C7): 19-1−19-20. [20] Rudels B, Friedrich H J, Quadfasel D. The Arctic circumpolar boundary current[J]. Deep–Sea Research Part II: Topical Studies in Oceanography, 1999, 46(6/7): 1023−1062. [21] Pickard, George L. Descriptive physical oceanography: An introduction[J]. Deep Sea Research & Oceanographic Abstracts, 2005, 23(6): 557−557. [22] Pnyushkov A V, Polyakov I V, Ivanov V V, et al. Structure and variability of the boundary current in the Eurasian Basin of the Arctic Ocean[J]. Deep–Sea Research Part I: Oceanographic Research Papers, 2015, 101: 80−97. doi: 10.1016/j.dsr.2015.03.001 [23] Dmitrenko I A, Rudels B, Kirillov S A, et al. Atlantic water flow into the Arctic Ocean through the St. Anna Trough in the northern Kara Sea[J]. Journal of Geophysical Research: Oceans, 2015, 120(7): 5158−5178. doi: 10.1002/2015JC010804 [24] Dmitrenko I A, Polyakov I V, Kirillov S A, et al. Toward a warmer Arctic Ocean: Spreading of the early 21st century Atlantic Water warm anomaly along the Eurasian Basin margins[J]. Journal of Geophysical Research: Oceans, 2008, 113(C5): C05023. [25] Polyakov I V, Pnyushkov A V, Alkire M B, et al. Greater role for Atlantic inflows on sea-ice loss in the Eurasian Basin of the Arctic Ocean[J]. Science, 2017, 356(6335): 285−291. doi: 10.1126/science.aai8204 [26] Carmack E, Polyakov I, Padman L, et al. Toward quantifying the increasing role of oceanic heat in sea ice loss in the new Arctic[J]. Bulletin of the American Meteorological Society, 2015, 96(12): 2079−2105. doi: 10.1175/BAMS-D-13-00177.1 [27] Polyakov I V, Timokhov L A, Alexeev V A, et al. Arctic Ocean warming contributes to reduced polar ice cap[J]. Journal of Physical Oceanography, 2010, 40(12): 2743−2756. doi: 10.1175/2010JPO4339.1 [28] 牟龙江, 赵进平. 北极冰海耦合模式对两种不同大气再分析资料响应的分析[J]. 海洋学报, 2015, 37(11): 79−91.Mu Longjiang, Zhao Jinping. Analysis on the response of an Arctic ice-ocean coupled model to two different atmospheric reanalysis datasets[J]. Haiyang Xuebao, 2015, 37(11): 79−91. [29] 杨清华, 刘骥平, 张占海, 等. 北极海冰数值预报的初步研究——基于海冰–海洋耦合模式MITgcm的模拟试验[J]. 大气科学, 2011, 35(3): 473−482. doi: 10.3878/j.issn.1006-9895.2011.03.08Yang Qinghua, Liu Jiping, Zhang Zhanhai, et al. A preliminary study of the Arctic sea ice numerical forecasting: Coupled sea ice-ocean modelling experiments based on MITgcm[J]. Chinese Journal of Atmospheric Sciences, 2011, 35(3): 473−482. doi: 10.3878/j.issn.1006-9895.2011.03.08 [30] 周天军, 邹立维, 陈晓龙. 第六次国际耦合模式比较计划(CMIP6)评述[J]. 气候变化研究进展, 2019, 15(5): 445−456. doi: 10.12006/j.issn.1673-1719.2019.193Zhou Tianjun, Zou Liwei, Chen Xiaolong. Commentary on the Coupled Model Intercomparison Project Phase 6 (CMIP6)[J]. Climate Change Research, 2019, 15(5): 445−456. doi: 10.12006/j.issn.1673-1719.2019.193 [31] 李晓婷, 郑沛楠, 王建丰, 等. 常用海洋数据资料简介[J]. 海洋预报, 2010, 27(5): 81−89. doi: 10.3969/j.issn.1003-0239.2010.05.014Li Xiaoting, Zheng Peinan, Wang Jianfeng, et al. Introduction of the ocean data in common use[J]. Marine Forecasts, 2010, 27(5): 81−89. doi: 10.3969/j.issn.1003-0239.2010.05.014 [32] Marotzke J, Giering R, Zhang K Q, et al. Construction of the adjoint MIT ocean general circulation model and application to Atlantic heat transport sensitivity[J]. Journal of Geophysical Research: Oceans, 1999, 104(C12): 29529−29547. doi: 10.1029/1999JC900236 [33] Swift J H, Aagaard K. Seasonal transitions and water mass formation in the Iceland and Greenland seas[J]. Deep–Sea Research Part A. Oceanographic Research Papers, 1981, 28(10): 1107−1129. doi: 10.1016/0198-0149(81)90050-9 [34] Hansen B, Østerhus S. North Atlantic–Nordic Seas exchanges[J]. Progress in Oceanography, 2000, 45(2): 109−208. doi: 10.1016/S0079-6611(99)00052-X [35] Rossby T, Prater M D, Søiland H. Pathways of inflow and dispersion of warm waters in the Nordic seas[J]. Journal of Geophysical Research: Oceans, 2009, 114(C4): C04011. [36] 何琰, 赵进平. 北欧海的锋面分布特征及其季节变化[J]. 地球科学进展, 2011, 26(10): 1079−1091.He Yan, Zhao Jinping. Distributions and seasonal variations of fronts in GIN seas[J]. Advances in Earth Science, 2011, 26(10): 1079−1091. -

计量
- 文章访问数: 624
- HTML全文浏览量: 341
- PDF下载量: 56
- 被引次数: 0
