

Identification of the mangrove species using UAV hyperspectral images: A case study of Zhangjiangkou mangrove national nature reserve
-
摘要: 红树林种群的组成和分布对于红树林生态系统的保护和恢复至关重要。本研究以漳江口红树林保护区为研究对象,通过获取无人机高光谱影像,进行光谱特征分析、光谱微分变换和包络线去除,提取了911组17个光谱特征参数,通过逐步判别分析筛选出13个用于决策树构建的特征参数,最终通过C5.0决策树模型获得了研究区红树林种群的分布状况。结果表明,漳江口红树林保护区植被种群呈现自上到下不同类型的分布情况,研究区上部以桐花树和秋茄混合类型为主,中间区域呈现白骨壤、桐花树和秋茄三者共生的现状,研究区下部则以白骨壤分布为主,伴生有少量的秋茄。通过混淆矩阵计算,得到研究区总体分类精度为 87.95%,Kappa系数为 83.81%,具有较好的精度。研究结果可为区域红树林湿地保护提供数据支撑,为红树林种群识别研究提供方法参考。Abstract: The composition and distribution of mangrove species are crucial to the protection and restoration of mangrove wetland ecosystems. In this study, mangrove species distribution was identified by unmanned aerial vehicle (UAV) hyperspectral images from Zhangjiangkou mangrove national nature reserve. Spectral characteristics, spectral differential, and spectral continuum removal were analyzed, 17 spectral parameters of 911 group spectral data from different vegetation species were obtained. Furthermore, 13 parameters for decision tree construction were selected by stepwise discriminant analysis. As a result, an accurate distribution map of mangrove species in the study area was obtained through C5.0 decision tree classification model. The vegetation species present different distribution types from top to bottom in the Zhangjiangkou mangrove national nature reserve. The upper part of the study area was dominated by the mixed type of Aegiceras corniculatum and Kandelia obovata. The middle area showed symbiosis status of three different mangrove species Avicennia marina, Aegiceras corniculatum and Kandelia obovata. The lower part of the study area was dominated by Avicennia marina, and a small amount of Kandelia obovata. Through the confusion matrix, the overall classification accuracy is 87.95% and the Kappa coefficient is 83.81%, showed a satisfactory precision. Therefore, our mangrove species identification results from UAV hyperspectral images could be used as a reference for ecological protection of regional mangrove wetland, and also as a identification method reference for mangrove species.
-
Key words:
- mangrove /
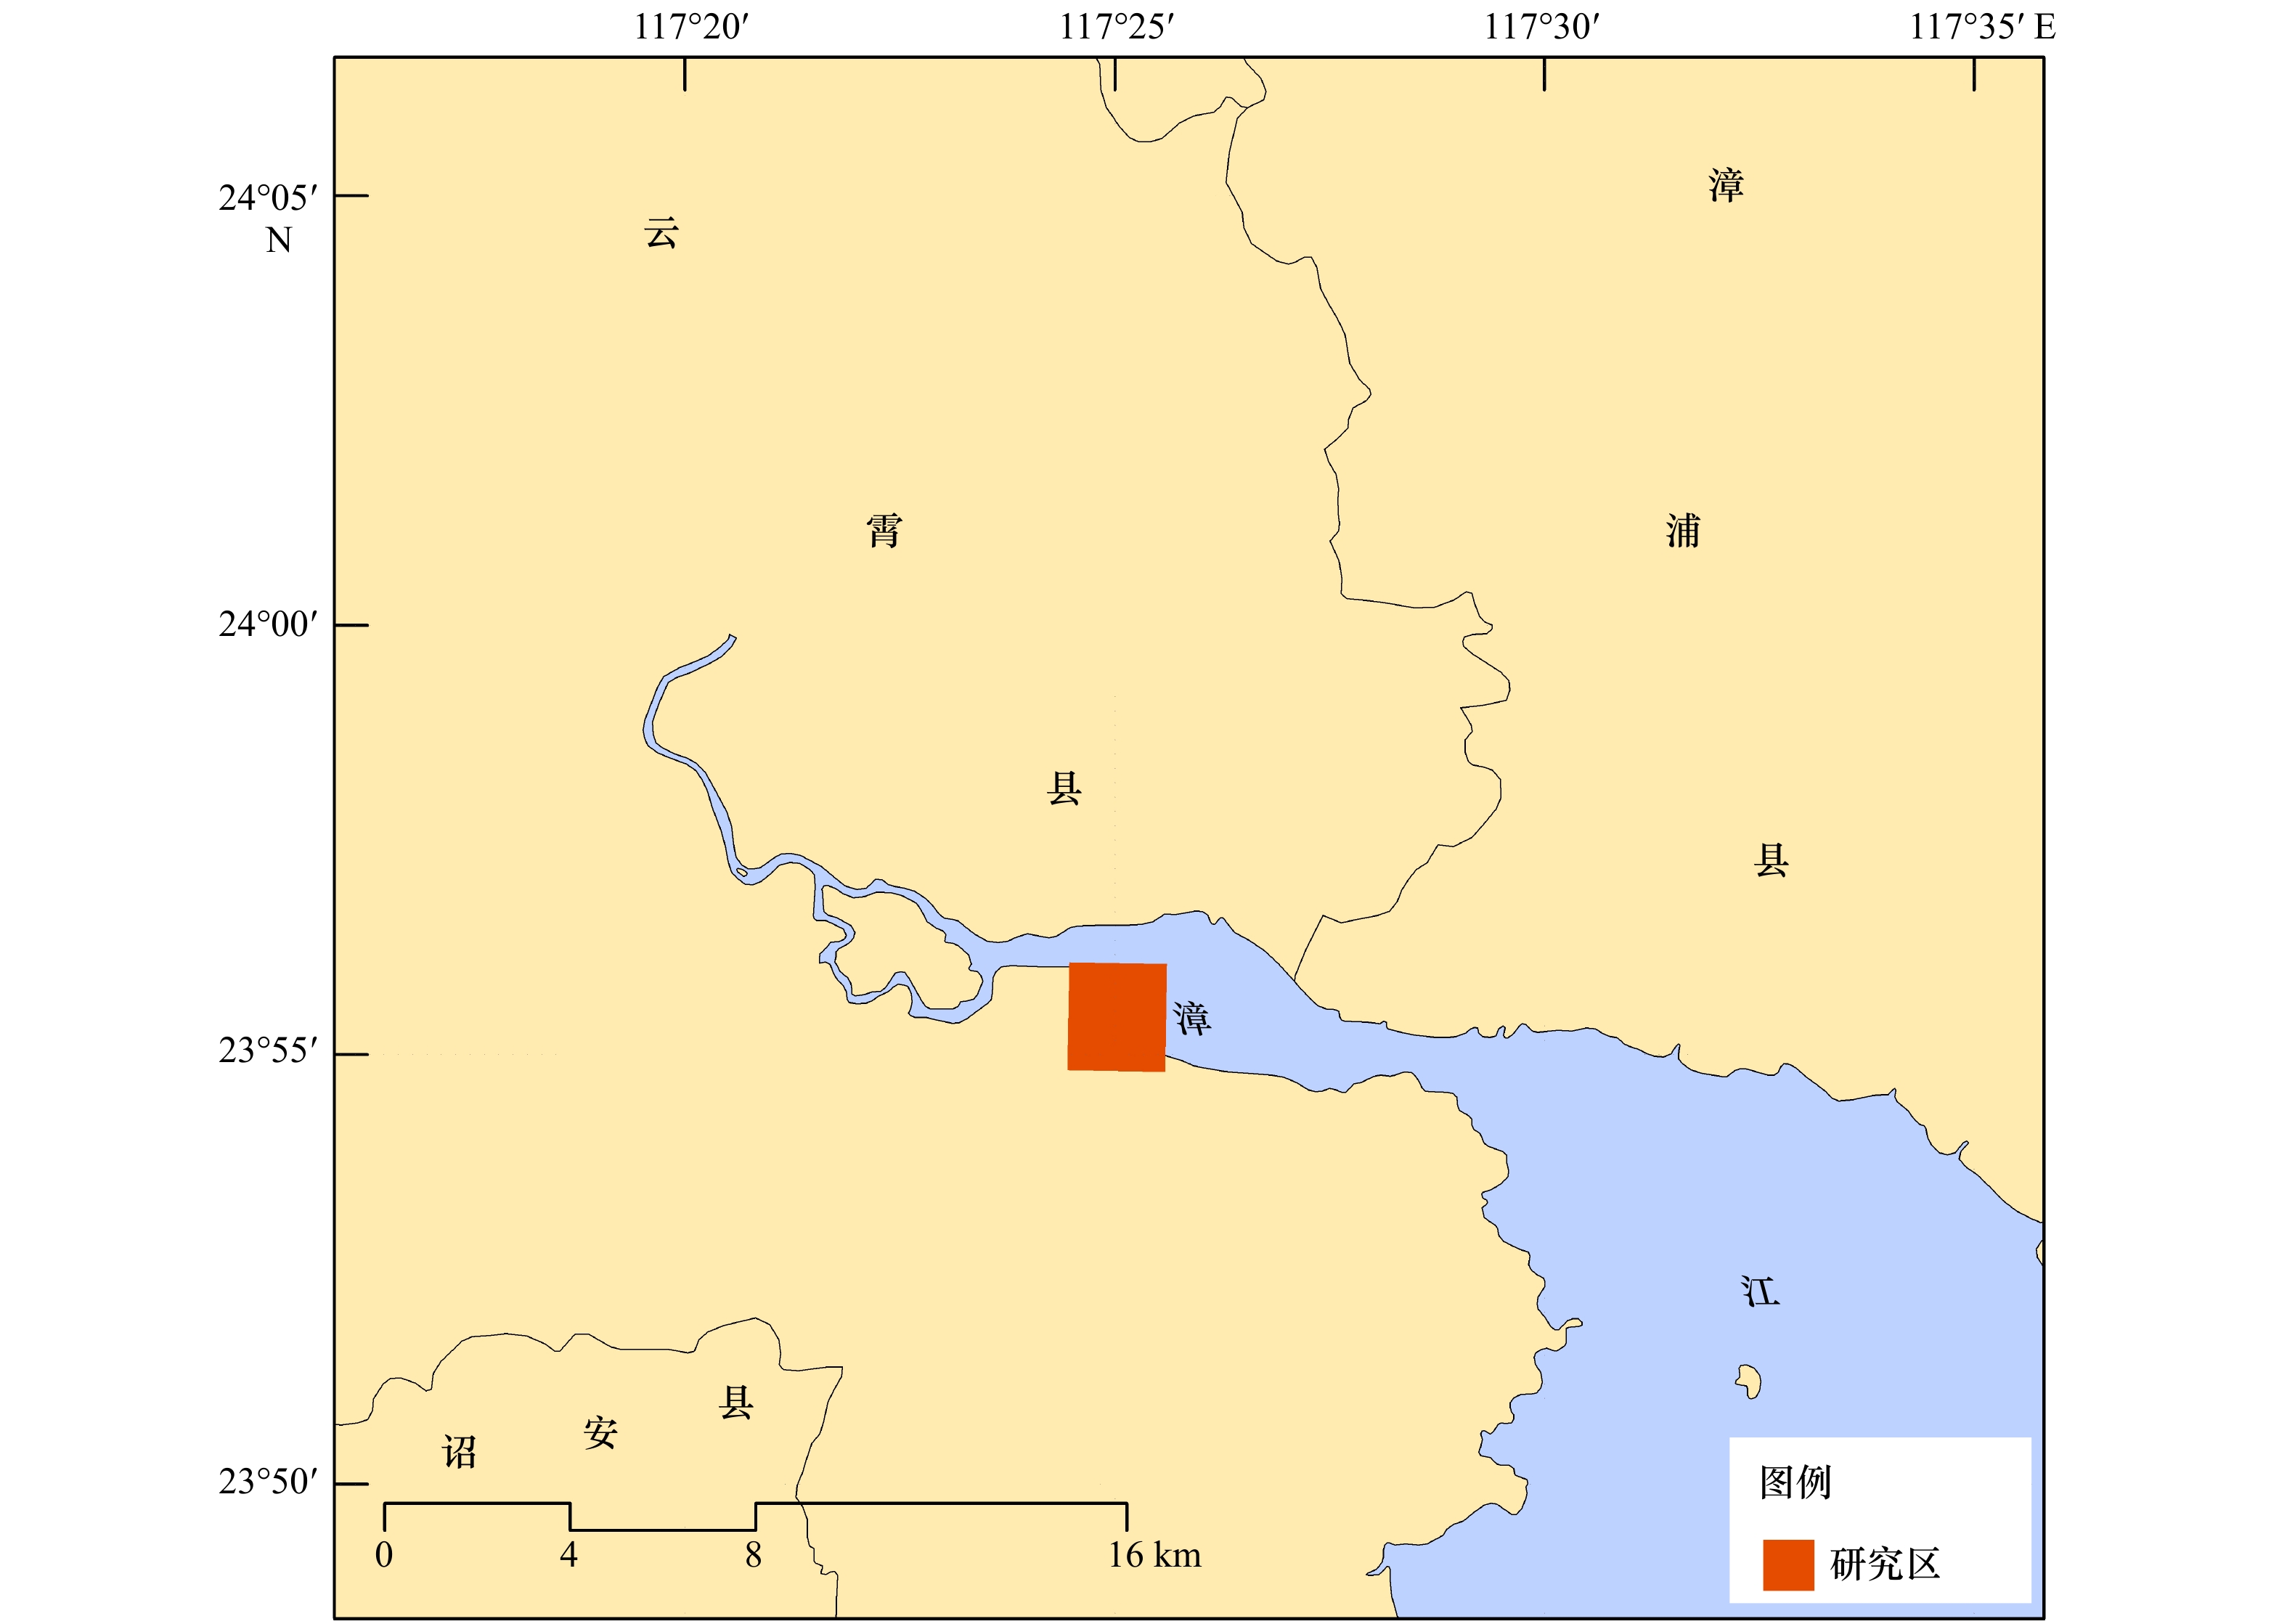
- Zhangjiangkou /
- unmanned aerial vehicle (UAV) /
- hyperspectral images /
- species identification
-
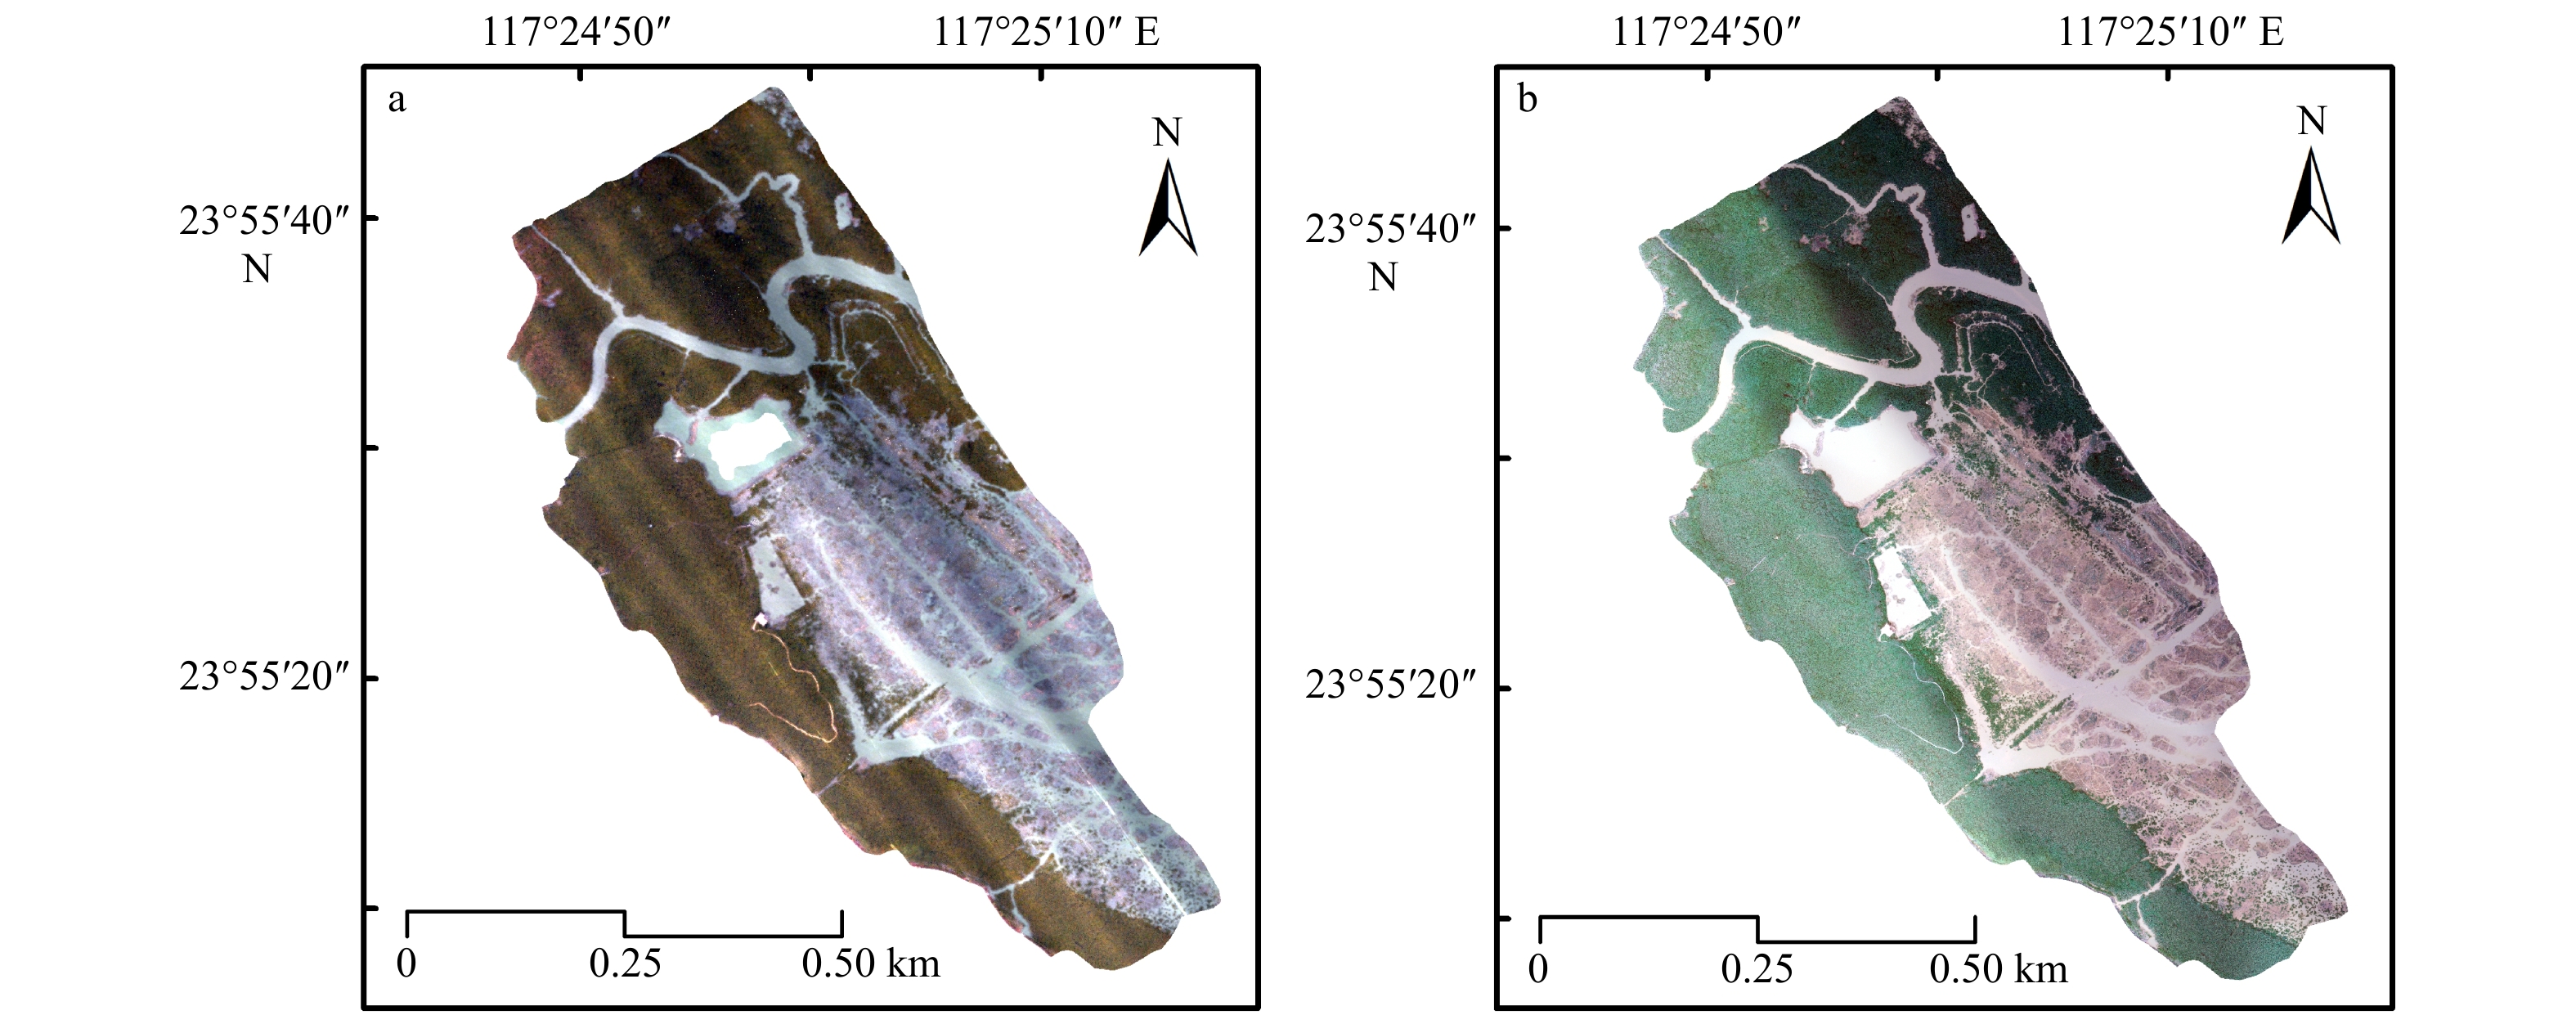
图 2 研究区无人机高光谱影像图(a)和普通光学影像(b)
Fig. 2 Unmanned aerial vehicle hyperspectral image (a) and RGB image (b) in the study area
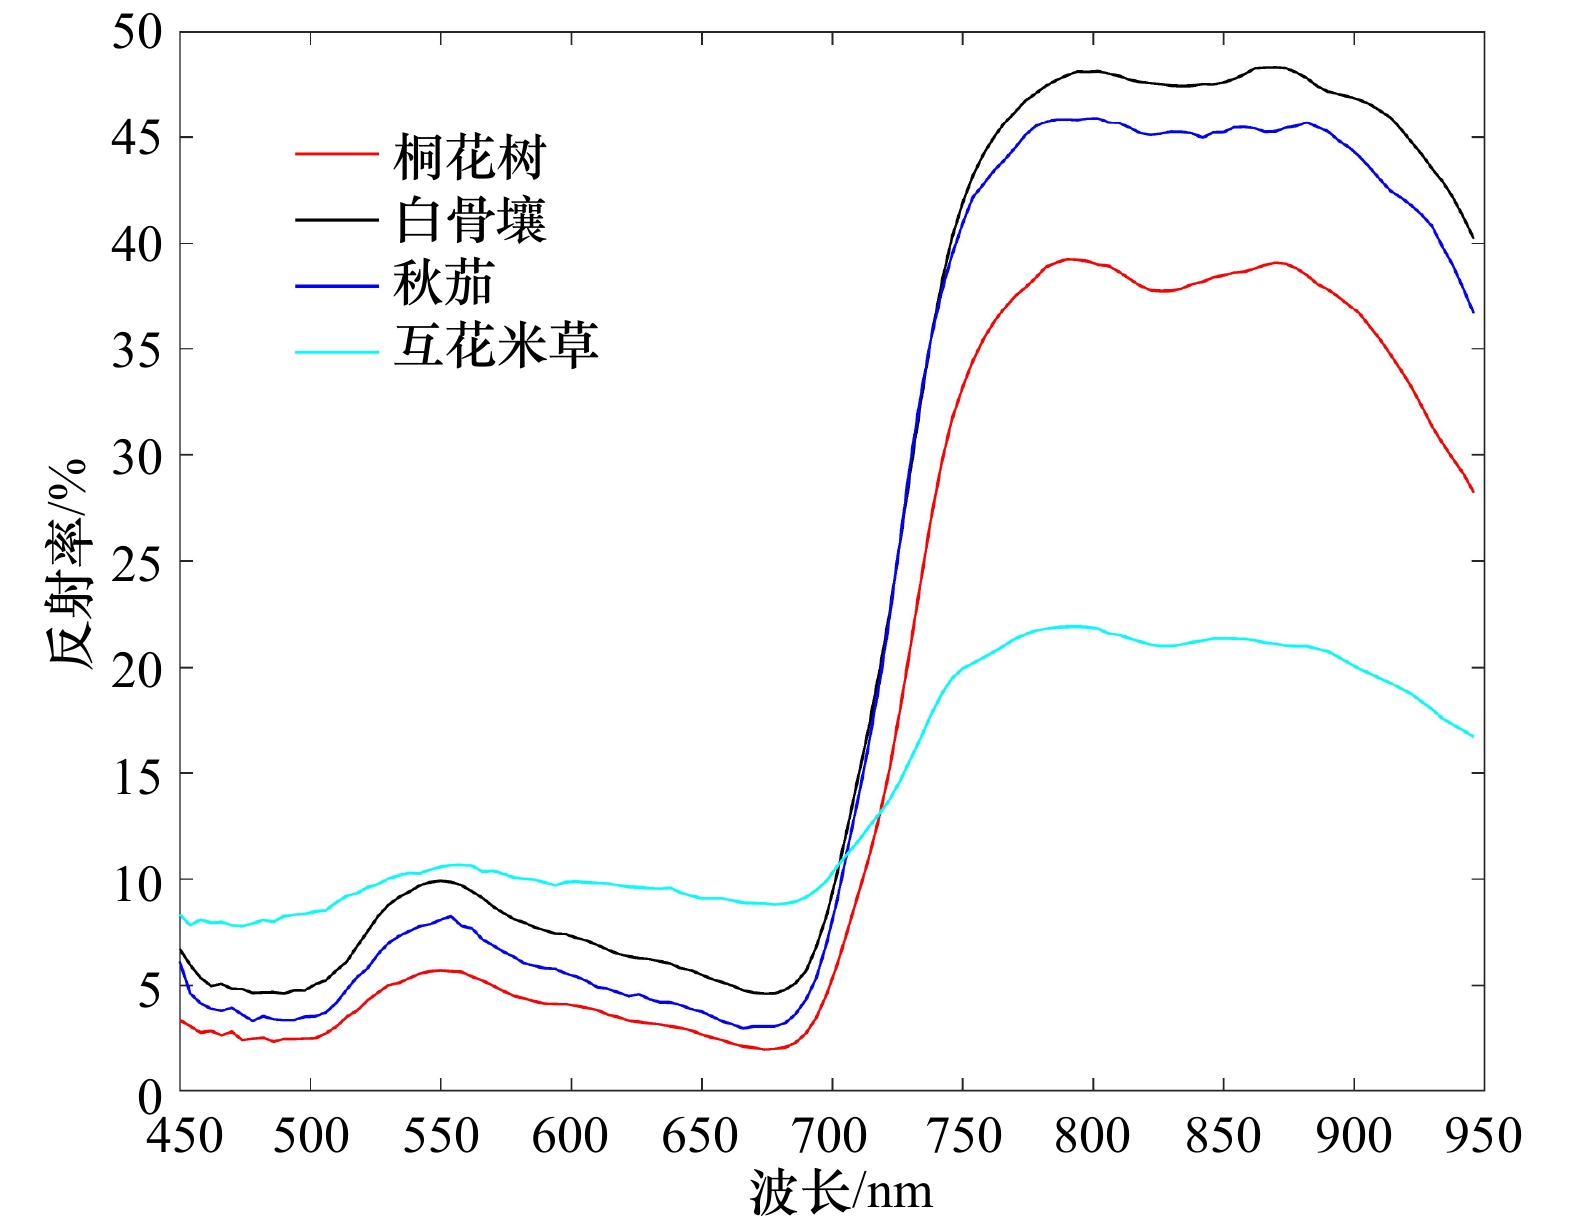
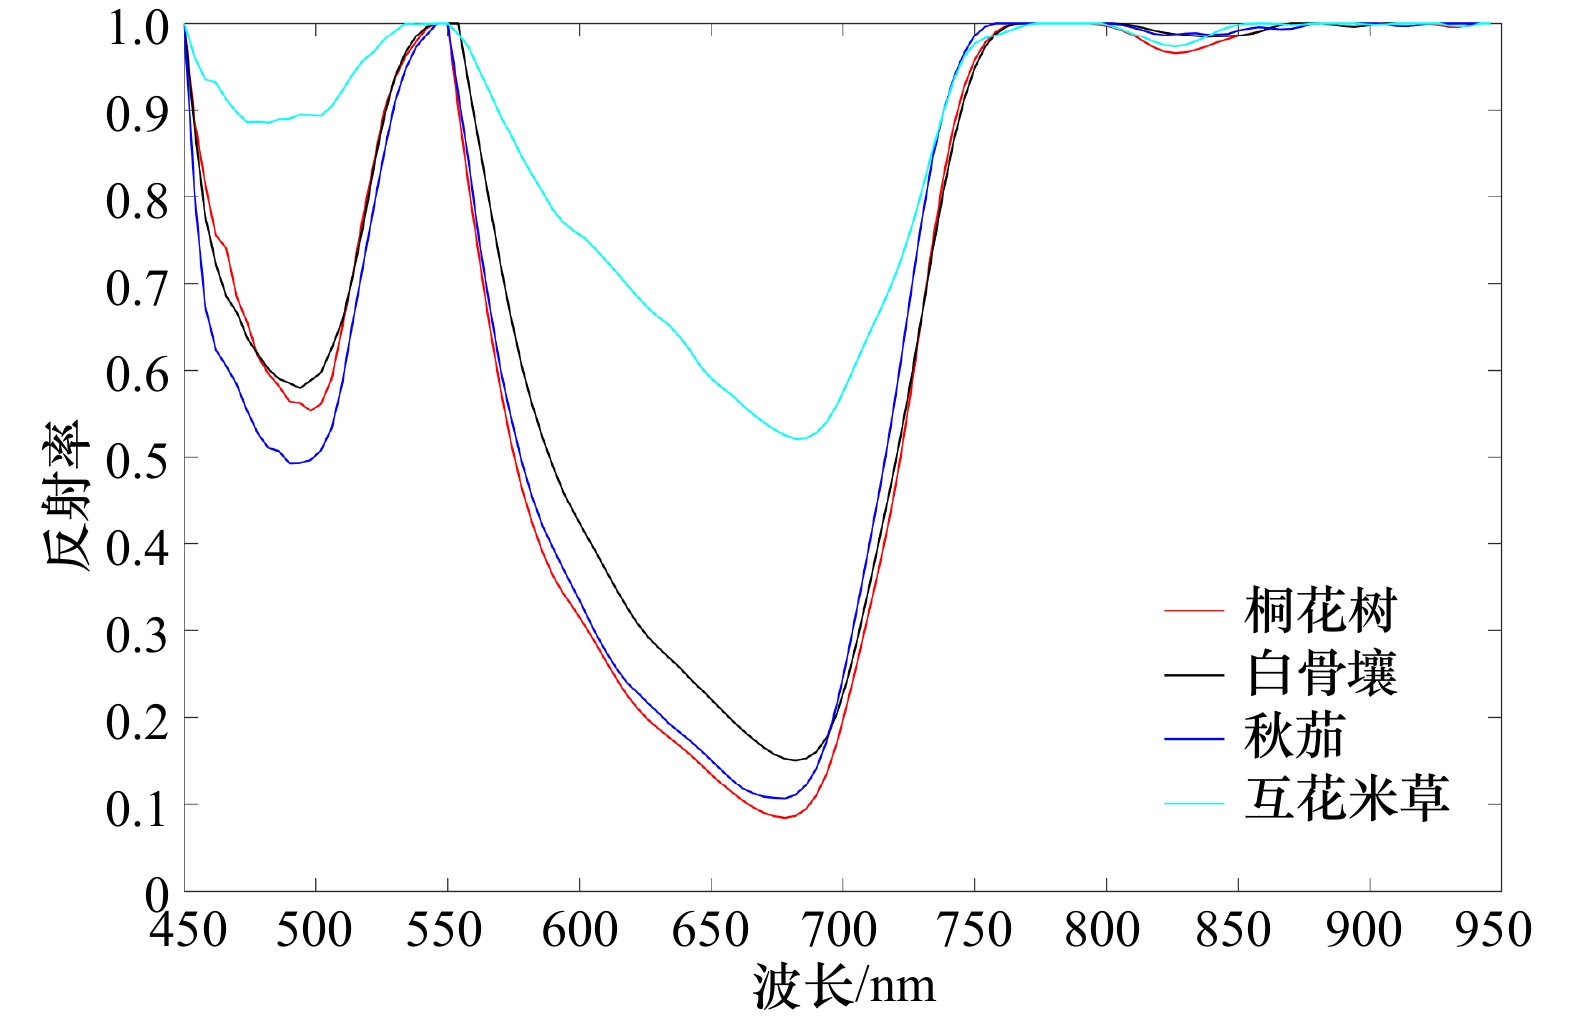
图 3 研究区典型植被类型光谱反射率曲线
Fig. 3 Spectral reflectance curves of typical vegetation species in the study area
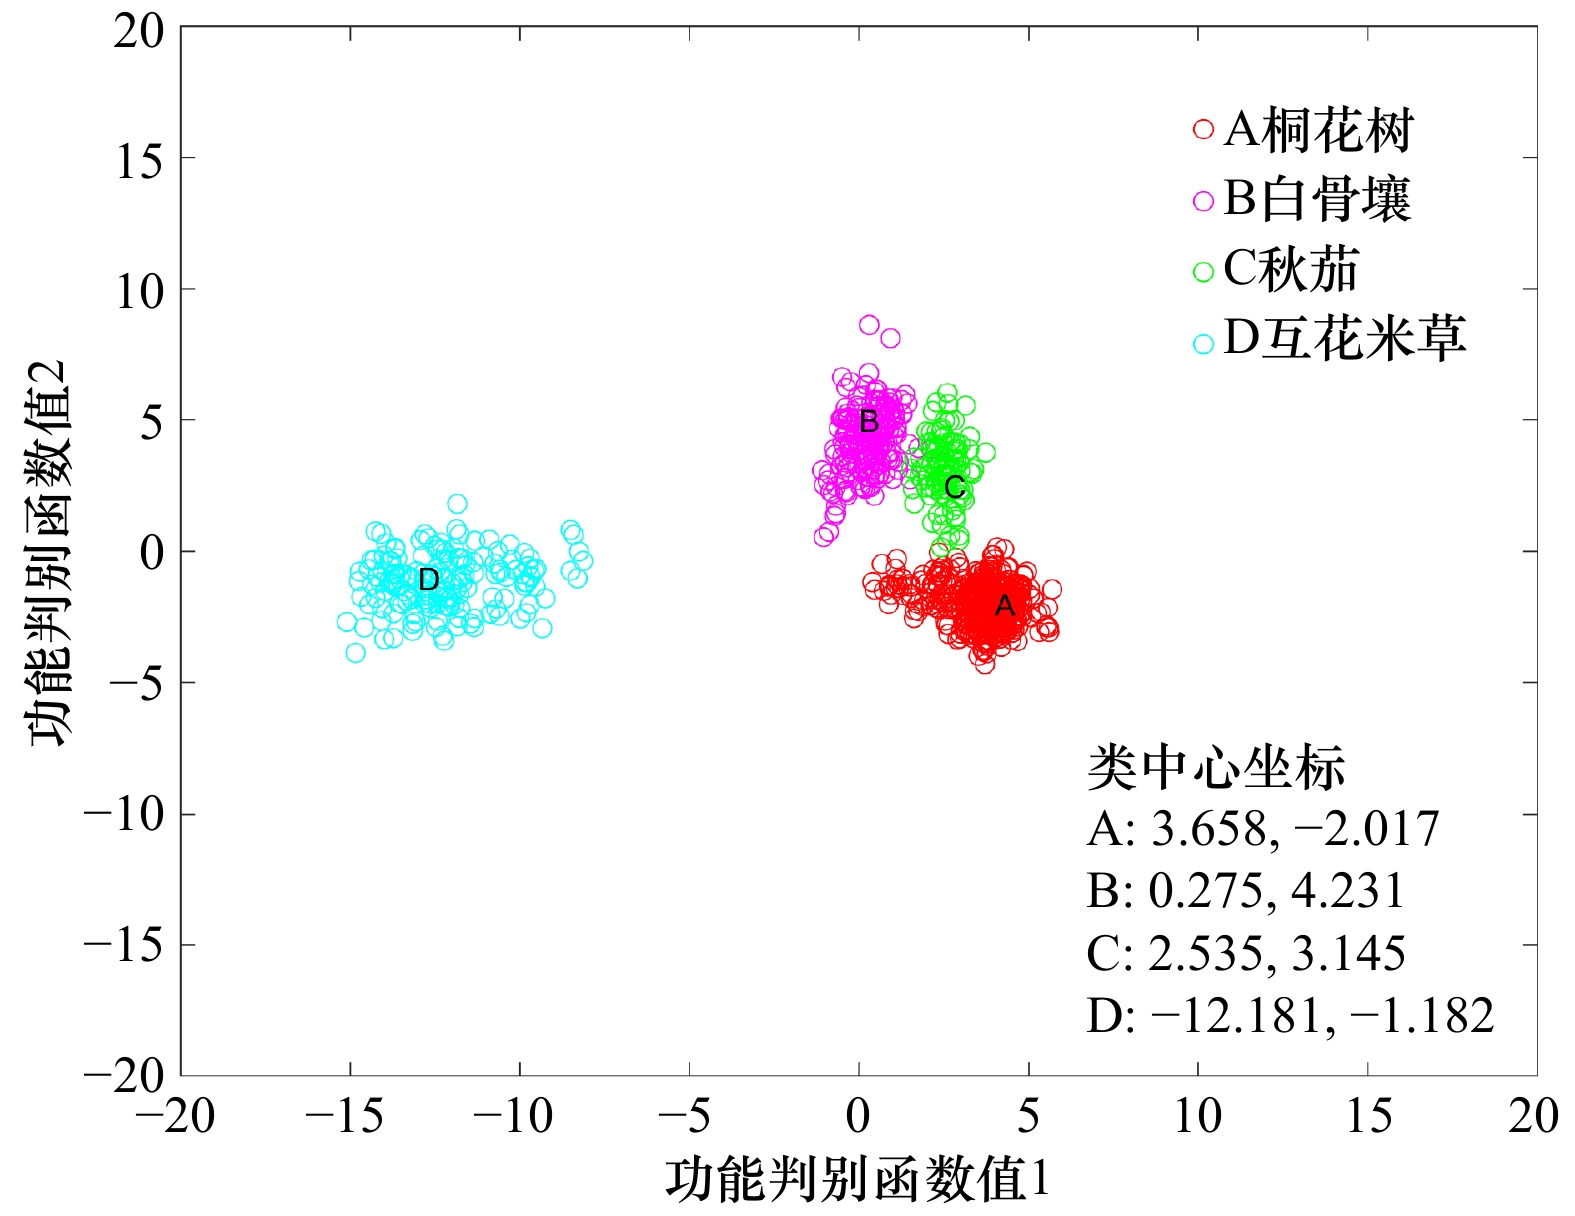
图 5 研究区典型植被类型逐步判别分析结果
Fig. 5 Stepwise discriminant analysis result of the typical vegetation species in the study area
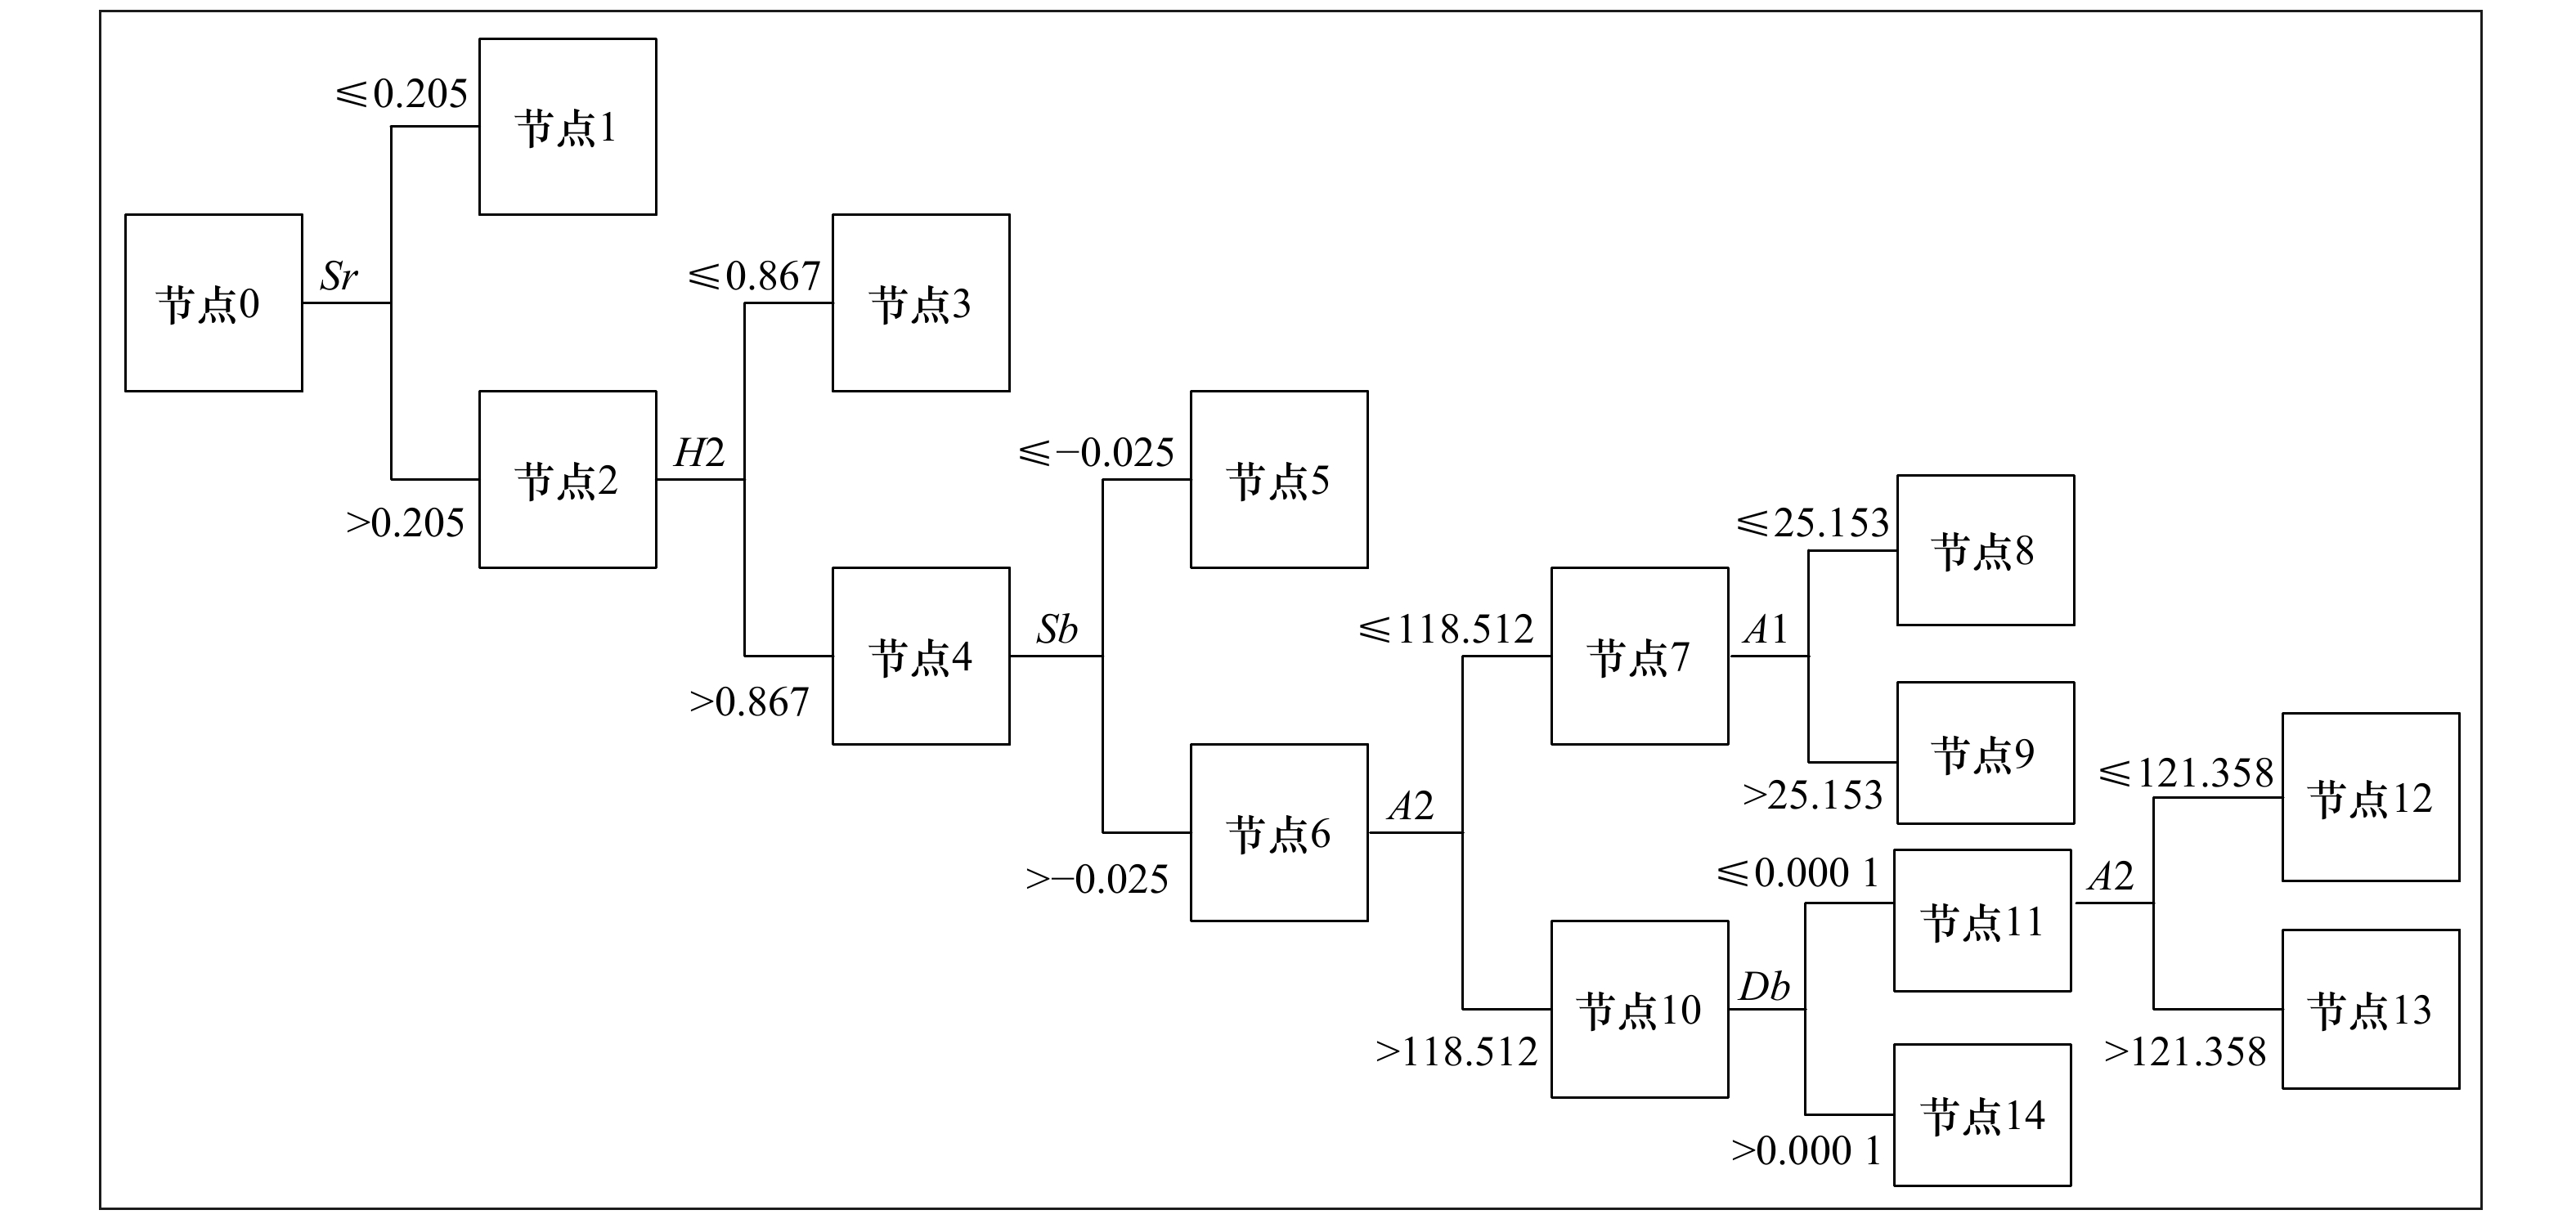
图 6 研究区典型植被类型决策树模型示意图
Fig. 6 The sketch map of decision tree classification model of the typical vegetation species in the study area
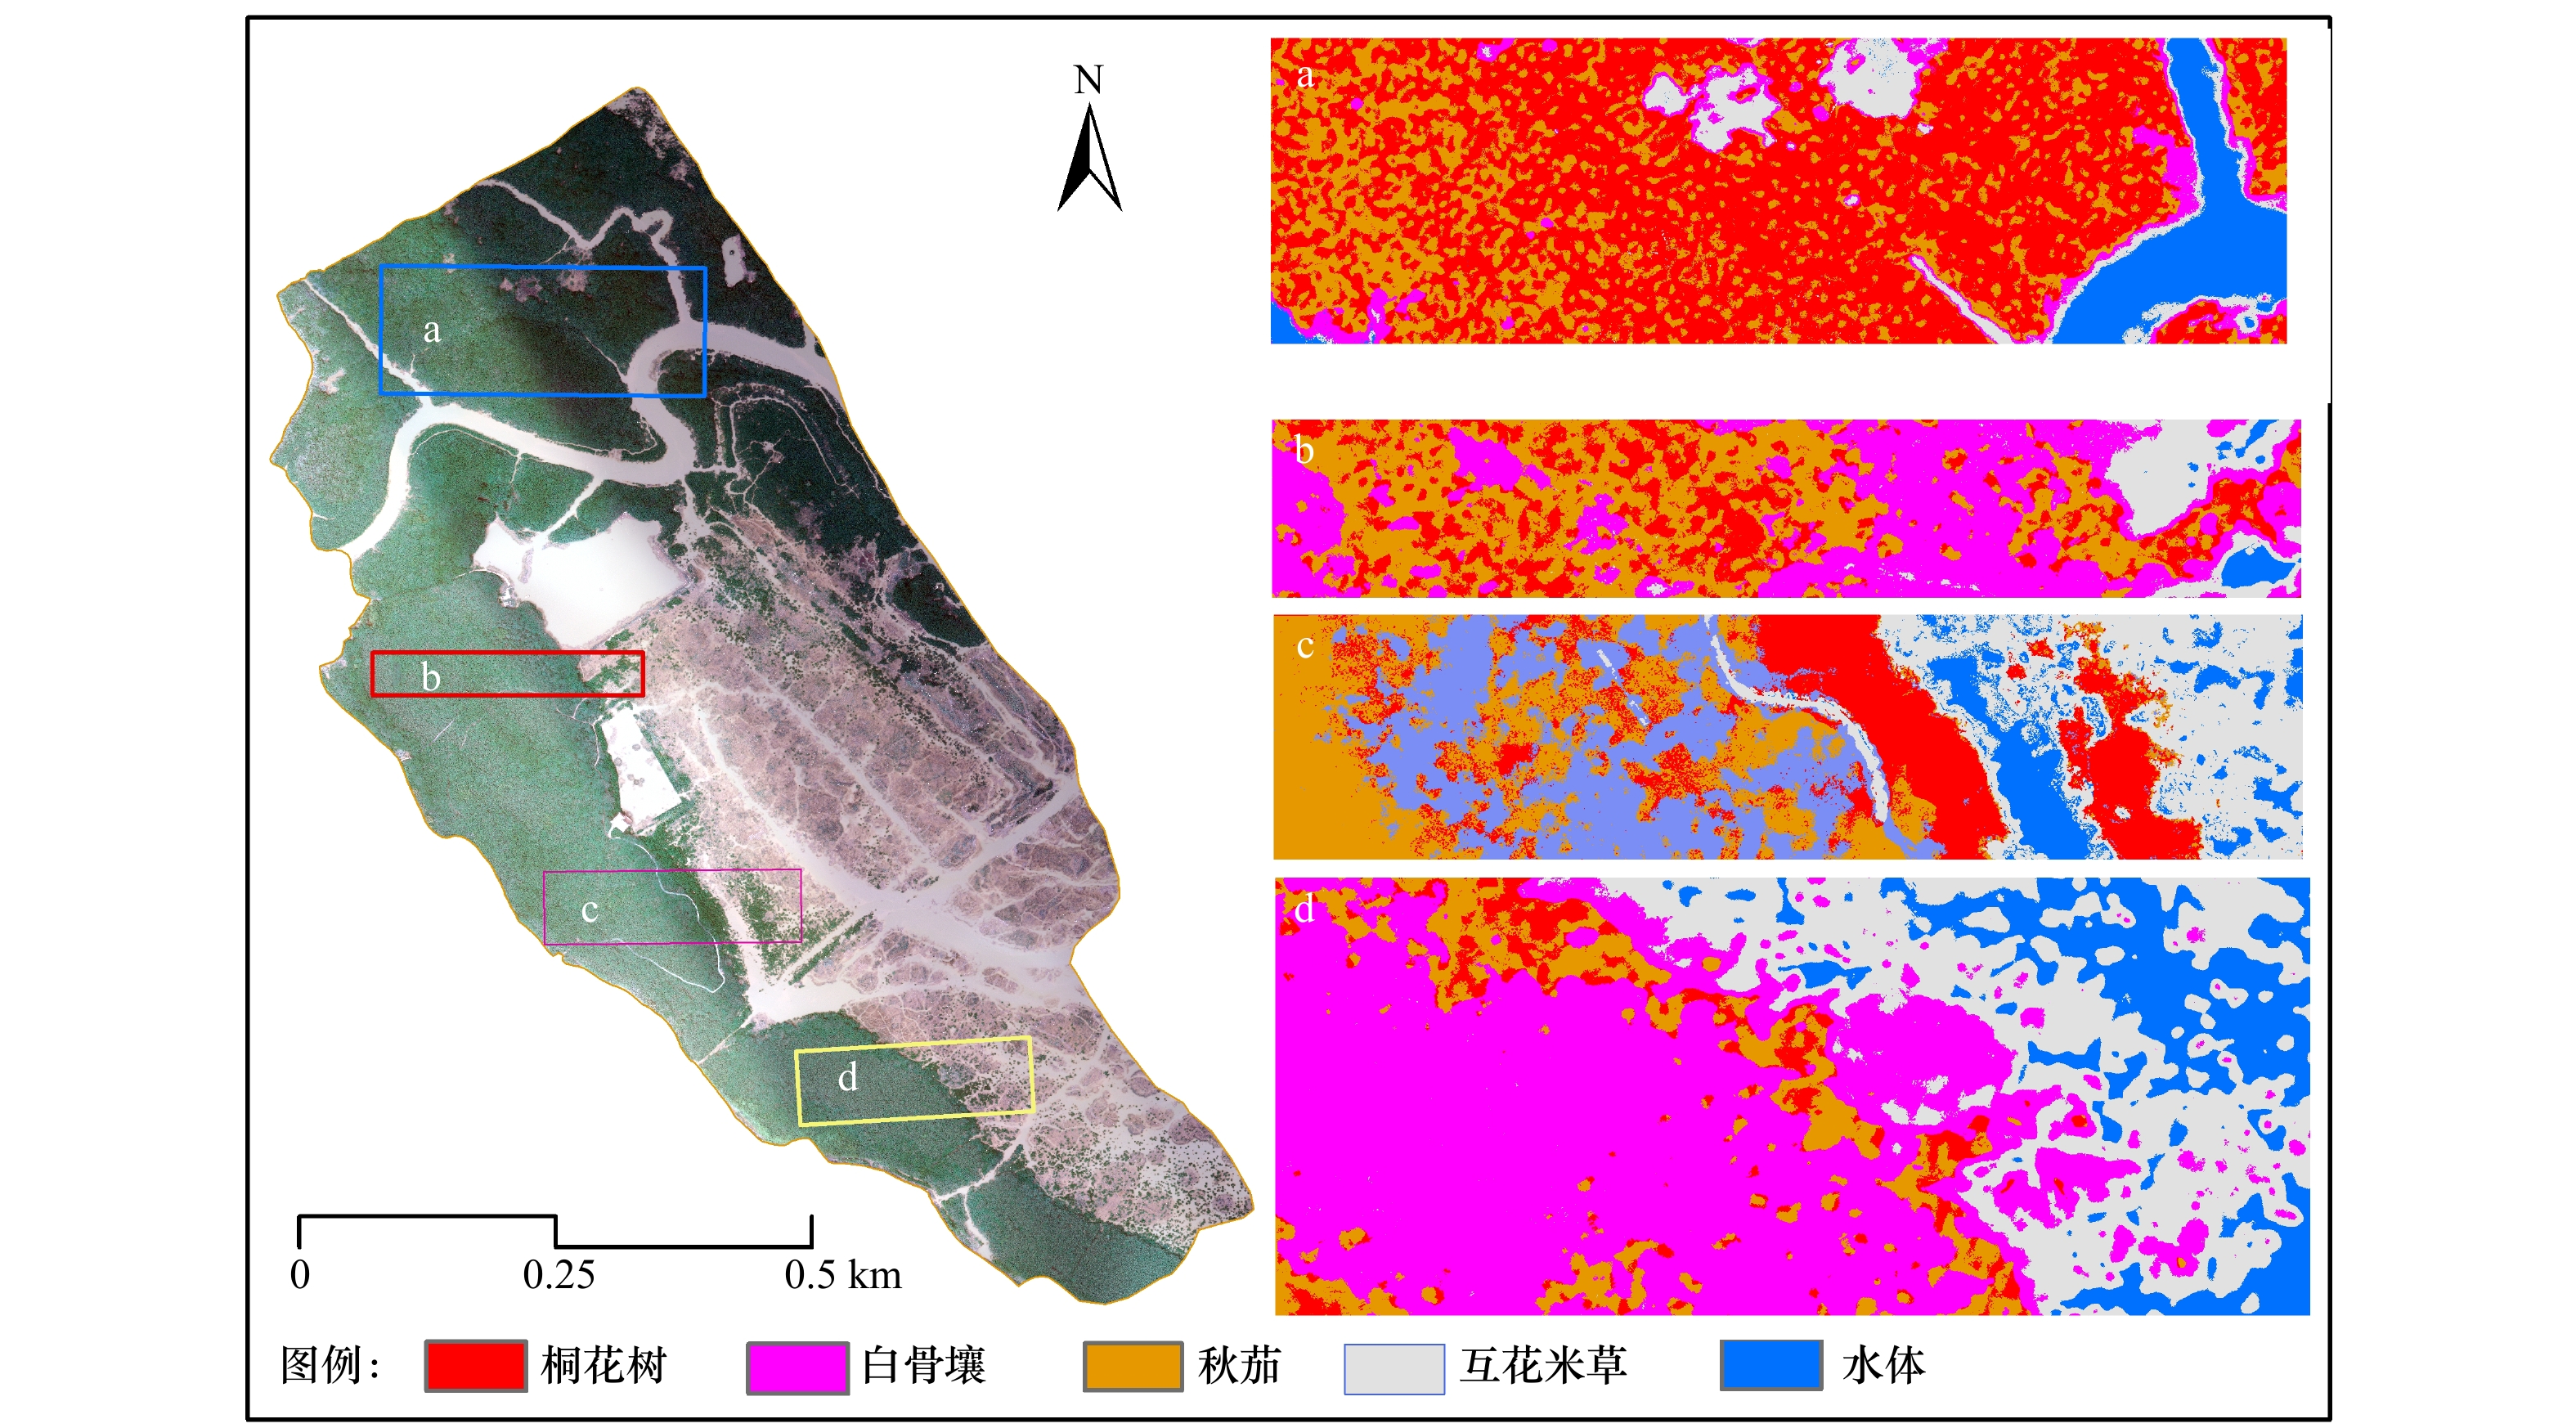
图 7 研究区植被类型分类识别结果
Fig. 7 Identification and classification results of the typical vegetation species in the study area
表 1 研究区典型植被类型样本情况表
Tab. 1 The information sheet of sample of the typical vegetation species in the study area
植被类型 桐花树 白骨壤 秋茄 互花米草 训练样本数 458 188 102 163 验证样本数 121 94 83 95  下载: 导出CSV
表 2 研究区典型植被类型“三边”参数
Tab. 2 Three sides spectral parameters of the typical vegetation species in the study area
植被类型 Db Dy Dr Sb Sy Sr 桐花树 0.002 −0.014 0.726 −0.239 −0.189 8.892 白骨壤 0.006 −0.031 0.791 −0.398 −0.312 10.313 秋茄 0.009 −0.035 0.827 −0.458 −0.307 10.292 互花米草 0.026 −0.001 0.245 −0.076 −0.098 3.047
下载: 导出CSV
表 3 研究区典型植被类型最大峰度统计
Tab. 3 The maximum kurtosis of the typical vegetation species in the study area
植被类型 650~700 nm 700~720 nm 720~750 nm K1 B1 K2 B2 K3 B3 桐花树 0.019 9 690 0.024 8 718 0.031 6 738 白骨壤 0.027 8 690 0.019 4 714 0.029 6 738 秋茄 0.029 1 690 0.023 1 714 0.032 4 730 互花米草 0.009 3 690 0.009 3 718 0.015 4 742 注:K1、K2、K3分别为各波段范围内的最大峰度值;B1、B2、B3分别为各峰度对应的波段值。
下载: 导出CSV
表 4 研究区典型植被类型包络线去除光谱吸收参数
Tab. 4 Spectral absorption parameters after continuum removal of typical species in the study area
植被类型 H1 H2 AL1 AL2 A1 A2 S1 S2 桐花树 0.446 7 0.916 0 15.061 0 86.550 7 24.359 9 127.111 5 0.618 3 0.680 9 白骨壤 0.420 4 0.849 3 13.791 8 76.755 4 24.419 1 112.484 6 0.564 8 0.682 4 秋茄 0.507 4 0.893 8 15.476 2 84.054 6 30.705 8 119.929 1 0.504 0 0.700 9 互花米草 0.114 7 0.479 6 2.587 4 36.971 9 6.328 5 56.787 7 0.408 9 0.651 1 注:H1、AL1、A1、S1为450~550 nm波段范围内的参数值;H2、AL2、A2、S2为550~750 nm波段范围内的参数值。
下载: 导出CSV
表 5 研究区典型植被分类结果混淆矩阵
Tab. 5 Confusion matrix of classification results of the typical vegetation species in the study area
桐花树 白骨壤 秋茄 互花米草 总计 用户精度/% 桐花树 131 3 12 0 146 89.72 白骨壤 3 108 4 6 121 89.25 秋茄 12 4 113 3 132 85.60 互花米草 2 7 4 86 99 86.86 总计 148 122 133 95 498 − 生产精度/% 88.51 88.52 84.96 90.52 − − 注:−代表空值。
下载: 导出CSV
-
[1] 王乐, 时晨, 田金炎, 等. 基于多源遥感的红树林监测[J]. 生物多样性, 2018, 26(8): 838−849. doi: 10.17520/biods.2018067Wang Le, Shi Chen, Tian Jinyan, et al. Researches on mangrove forest monitoring methods based on multi-source remote sensing[J]. Biodiversity Science, 2018, 26(8): 838−849. doi: 10.17520/biods.2018067 [2] 林鹏. 中国红树林湿地与生态工程的几个问题[J]. 中国工程科学, 2003, 5(6): 33−38. doi: 10.3969/j.issn.1009-1742.2003.06.005Lin Peng. The characteristics of mangrove wetlands and some ecological engineering questions in China[J]. Engineering Science, 2003, 5(6): 33−38. doi: 10.3969/j.issn.1009-1742.2003.06.005 [3] Seto K C, Fragkias M. Mangrove conversion and aquaculture development in Vietnam: a remote sensing-based approach for evaluating the Ramsar Convention on Wetlands[J]. Global Environmental Change, 2007, 17(3/4): 486−500. [4] Jia Mingming, Zhang Yuanzhi, Wang Zongming, et al. Mapping the distribution of mangrove species in the Core Zone of Mai Po Marshes Nature Reserve, Hong Kong, using hyperspectral data and high-resolution data[J]. International Journal of Applied Earth Observation and Geoinformation, 2014, 33: 226−231. doi: 10.1016/j.jag.2014.06.006 [5] Jia Mingming, Wang Zongming, Zhang Yuanzhi, et al. Monitoring loss and recovery of mangrove forests during 42 years: the achievements of mangrove conservation in China[J]. International Journal of Applied Earth Observation and Geoinformation, 2018, 73: 535−545. doi: 10.1016/j.jag.2018.07.025 [6] Ciri C, Ochieng E, Tieszen L L, et al. Status and distribution of mangrove forests of the world using earth observation satellite data[J]. Global Ecology and Biogeography, 2011, 20(1): 154−159. doi: 10.1111/j.1466-8238.2010.00584.x [7] Wang Le, Jia Mingming, Yin Dameng, et al. A review of remote sensing for mangrove forests: 1956−2018[J]. Remote Sensing of Environment, 2019, 231: 111223. doi: 10.1016/j.rse.2019.111223 [8] Zhu Yuanhui, Liu Kai, Liu Lin, et al. Retrieval of mangrove aboveground biomass at the individual species level with worldview-2 images[J]. Remote Sensing, 2015, 7(9): 12192−12214. doi: 10.3390/rs70912192 [9] Wang L, Sousa W P, Gong P. Integration of object-based and pixel-based classification for mapping mangroves with IKONOS imagery[J]. International Journal of Remote Sensing, 2004, 25(24): 5655−5668. doi: 10.1080/014311602331291215 [10] Everitt J H, Yang C, Sriharan S, et al. Using high resolution satellite imagery to map black mangrove on the Texas gulf coast[J]. Journal of Coastal Research, 2008, 2008(246): 1582−1586. [11] Hauser L T, Vu G N, Nguyen B A, et al. Uncovering the spatio-temporal dynamics of land cover change and fragmentation of mangroves in the Ca Mau peninsula, Vietnam using multi-temporal SPOT satellite imagery (2004−2013)[J]. Applied Geography, 2017, 86: 197−207. doi: 10.1016/j.apgeog.2017.06.019 [12] Xia Qing, Qin Chengzhi, Li He, et al. Evaluation of submerged mangrove recognition index using multi-tidal remote sensing data[J]. Ecological Indicators, 2020, 113: 106196. doi: 10.1016/j.ecolind.2020.106196 [13] 赵春晖, 王立国, 齐滨. 高光谱遥感图像处理方法及应用[M]. 北京: 电子工业出版社, 2016.Zhao Chunhui, Wang Liguo, Qi Bin. Hyperspectral Remote Sensing Images Processing Methods and Applications[M]. Beijing: Publishing House of Electronics Industry, 2016. [14] Kumar T, Panigrahy S, Kumar P, et al. Classification of floristic composition of mangrove forests using, hyperspectral data: case study of bhitarkanika national park, India[J]. Journal of Coastal Conservation, 2013, 17(1): 121−132. doi: 10.1007/s11852-012-0223-2 [15] Wan Luoma, Lin Yinyi, Zhang Hongsheng, et al. GF-5 hyperspectral data for species mapping of mangrove in Mai Po, Hong Kong[J]. Remote Sensing, 2020, 12(4): 656. doi: 10.3390/rs12040656 [16] Hati J P, Samanta S, Chaube N R, et al. Mangrove classification using airborne hyperspectral AVIRIS-NG and comparing with other spaceborne hyperspectral and multispectral data[J]. The Egyptian Journal of Remote Sensing and Space Science, 2021, 24(2): 273−281. doi: 10.1016/j.ejrs.2020.10.002 [17] 刘凯, 龚辉, 曹晶晶, 等. 基于多类型无人机数据的红树林遥感分类对比[J]. 热带地理, 2019, 39(4): 492−501.Liu Kai, Gong Hui, Cao Jingjing, et al. Comparison of mangrove remote sensing classification based on multi-type UAV data[J]. Tropical Geography, 2019, 39(4): 492−501. [18] Cao Jingjing, Leng Wanchun, Liu Kai, et al. Object-based mangrove species classification using unmanned aerial vehicle hyperspectral images and digital surface models[J]. Remote Sensing, 2018, 10(1): 89. doi: 10.3390/rs10010089 [19] 周振超, 李贺, 黄翀, 等. 红树林遥感动态监测研究进展[J]. 地球信息科学学报, 2018, 20(11): 1631−1643. doi: 10.12082/dqxxkx.2018.180247Zhou Zhenchao, Li He, Huang Chong, et al. Review on dynamic monitoring of mangrove forestry using remote sensing[J]. Journal of Geo-information Science, 2018, 20(11): 1631−1643. doi: 10.12082/dqxxkx.2018.180247 [20] Yang Shanshan, Wang Le, Shi Chen, et al. Evaluating the relationship between the photochemical reflectance index and light use efficiency in a mangrove forest with Spartina alterniflora invasion[J]. International Journal of Applied Earth Observation and Geoinformation, 2018, 73: 778−785. doi: 10.1016/j.jag.2018.08.014 [21] 黄冠闽. 漳江口红树林区互花米草的生长特性及其与秋茄的相对竞争力[D]. 厦门: 厦门大学, 2009.Huang Guanmin. The growth characteristics of Spartina alterniflora and relative competitive ability with Kandelia obovata in mangrove areas of Zhangjiang Estuary[D]. Xiamen: Xiamen University, 2009. [22] 王美玲, 焦琳琳, 王晓红, 等. 曹妃甸湿地典型植被光谱特征差异性分析[J]. 浙江农业学报, 2019, 31(6): 963−969. doi: 10.3969/j.issn.1004-1524.2019.06.14Wang Meiling, Jiao Linlin, Wang Xiaohong, et al. Differences in spectral characteristics of typical vegetation in Caofeidian wetland[J]. Acta Agriculturae Zhejiangensis, 2019, 31(6): 963−969. doi: 10.3969/j.issn.1004-1524.2019.06.14 [23] 赵英时. 遥感应用分析原理与方法[M]. 2版. 北京: 科学出版社, 2013.Zhao Yingshi. Principles and Methods of Remote Sensing Application Analysis[M]. 2nd ed. Beijing: Science Press, 2013. [24] 岁秀珍, 陈浩. 基于高光谱的湿地植被分类研究[J]. 测绘与空间地理信息, 2019, 42(5): 137−140, 144. doi: 10.3969/j.issn.1672-5867.2019.05.042Sui Xiuzhen, Chen Hao. Classification of wetland vegetation based on hyperspectral[J]. Geomatics & Spatial Information Technology, 2019, 42(5): 137−140, 144. doi: 10.3969/j.issn.1672-5867.2019.05.042 [25] 罗宁, 阮仁宗, 王俊海. 基于机器学习的高光谱湿地植被分类研究[J]. 林业调查规划, 2019, 44(3): 1−7. doi: 10.3969/j.issn.1671-3168.2019.03.001Luo Ning, Ruan Renzong, Wang Junhai. Classification of hyperspectral wetland vegetation based on machine learning[J]. Forest Inventory and Planning, 2019, 44(3): 1−7. doi: 10.3969/j.issn.1671-3168.2019.03.001 [26] 史冰全, 张晓丽, 白雪琪, 等. 基于“三边”参数的油松林叶绿素估算模型[J]. 东北林业大学学报, 2015, 43(5): 80−83. doi: 10.3969/j.issn.1000-5382.2015.05.016Shi Bingquan, Zhang Xiaoli, Bai Xueqi, et al. Chlorophyll estimation model of Pinus tabulaeformis based on “Sanbian” parameters[J]. Journal of Northeast Forestry University, 2015, 43(5): 80−83. doi: 10.3969/j.issn.1000-5382.2015.05.016 [27] 曾帅, 况润元, 肖阳, 等. 鄱阳湖湿地植物实测高光谱数据分类[J]. 遥感信息, 2017, 32(5): 75−81. doi: 10.3969/j.issn.1000-3177.2017.05.012Zeng Shuai, Kuang Runyuan, Xiao Yang, et al. Measured hyperspectral data classification of Poyang Lake wetland vegetation[J]. Remote Sensing Information, 2017, 32(5): 75−81. doi: 10.3969/j.issn.1000-3177.2017.05.012 [28] 庞毓雯, 黄雨馨, 问静怡, 等. 泥炭藓群落的光谱特征及遥感识别研究[J]. 植物科学学报, 2019, 37(2): 125−135. doi: 10.11913/PSJ.2095-0837.2019.20125Pang Yuwen, Huang Yuxin, Wen Jingyi, et al. Study on the spectral characteristics and remote sensing recognition of the Sphagnum community[J]. Plant Science Journal, 2019, 37(2): 125−135. doi: 10.11913/PSJ.2095-0837.2019.20125 [29] 王怀警, 谭炳香, 房秀凤, 等. C5.0决策树Hyperion影像森林类型精细分类方法[J]. 浙江农林大学学报, 2018, 35(4): 724−734. doi: 10.11833/j.issn.2095-0756.2018.04.018Wang Huaijing, Tan Bingxiang, Fang Xiufeng, et al. Precise classification of forest types use Hyperion image based on the C5.0 decision tree algorithm[J]. Journal of Zhejiang A&F University, 2018, 35(4): 724−734. doi: 10.11833/j.issn.2095-0756.2018.04.018 -

计量
- 文章访问数: 634
- HTML全文浏览量: 247
- PDF下载量: 66
- 被引次数: 0
