

Influence of atmospheric momentum input on Beaufort Gyre long term changes under the Arctic sea ice retreat
-
摘要: 随着北冰洋海冰快速减退,气–冰–海系统发生显著变化,波弗特流涡也发生显著变化。本文使用实测资料和海洋大气再分析数据,探讨北冰洋波弗特流涡的长期变化和大气动量输入对波弗特流涡变化的影响。波弗特流涡的长期变化可以分为3个典型时期(1980–1995年,1996–2007年,2008–2018年)。最近时期(2008–2018年),波弗特流涡平均流涡强度达到4.39×10⁻⁷,相较于第1个时期(1980–1995年),流涡强度增加近2倍,达到稳定的状态。波弗特流涡范围扩大,主体向西北移动;上层海洋斜压性增强。与此同时,上层海洋环流主模态已发生显著转变:1980–1995年,环流主模态为影响整个加拿大海盆的加拿大海盆模态;2008–2018年的主模态则转变为影响整个研究海域的太平洋扇区模态。最近时期,表征气–海之间动量输入的气–海应力显著增加,尤其是夏末秋初的8–10月,与冰–海应力几乎相当。增加的大气动量输入带来平均动能增加,埃克曼泵压效应增强,下盐跃层深度加深,增加的大气动量输入进而导致近年来波弗特流涡的显著增强。加拿大海盆南部是大气动量输入的关键区。Abstract: Beaufort Gyre (BG) had presented the significant changes associated with the complicated interactions between the Arctic air-ice-ocean system. In this paper, the observed McLane Moored Profiler data combined with the oceanic and atmospheric reanalysis datasets are used to discuss the influence of atmospheric momentum input on the BG long term changes. The BG exhibited the three different stages from 1980 to 2018 (1980−1995, 1996−2007, 2008−2018). The BG kept a stable state during the recent period (2008−2018). Compared with the first period (1980−1995), the BG strength reached up to 4.39×10⁻⁷, and increased nearly twice during the recent period. Meanwhile, the upper ocean processes showed the measurable discrepancies, such as the BG area expanded, gyre moved northwestward, and upper baroclinicity enhanced. Accordingly, the leading upper circulation mode had undergone a significant shift during these two periods. During the recent period, that is the leading Pacific sector mode played the main role in the upper circulation, while the basin mode receded the domination. Since the air-ocean stress represents the atmospheric momentum input process, our study indicated the summer air-ocean stress (August−October) increased remarkably and was even equivalent to the contribution of sea ice. The increased atmospheric momentum input may benefit to the mean kinetic energy increasing, together with the Ekman pumping enhancing and cold halocline deepening. Thus, the mentioned processes resulted in the BG obvious enhancement during the recent period. The southern Canada basin was the key area for the atmospheric momentum input.
-
Key words:
- Beaufort Gyre /
- leading circulation mode /
- atmospheric momentum input /
- key area /
- long term changes
-
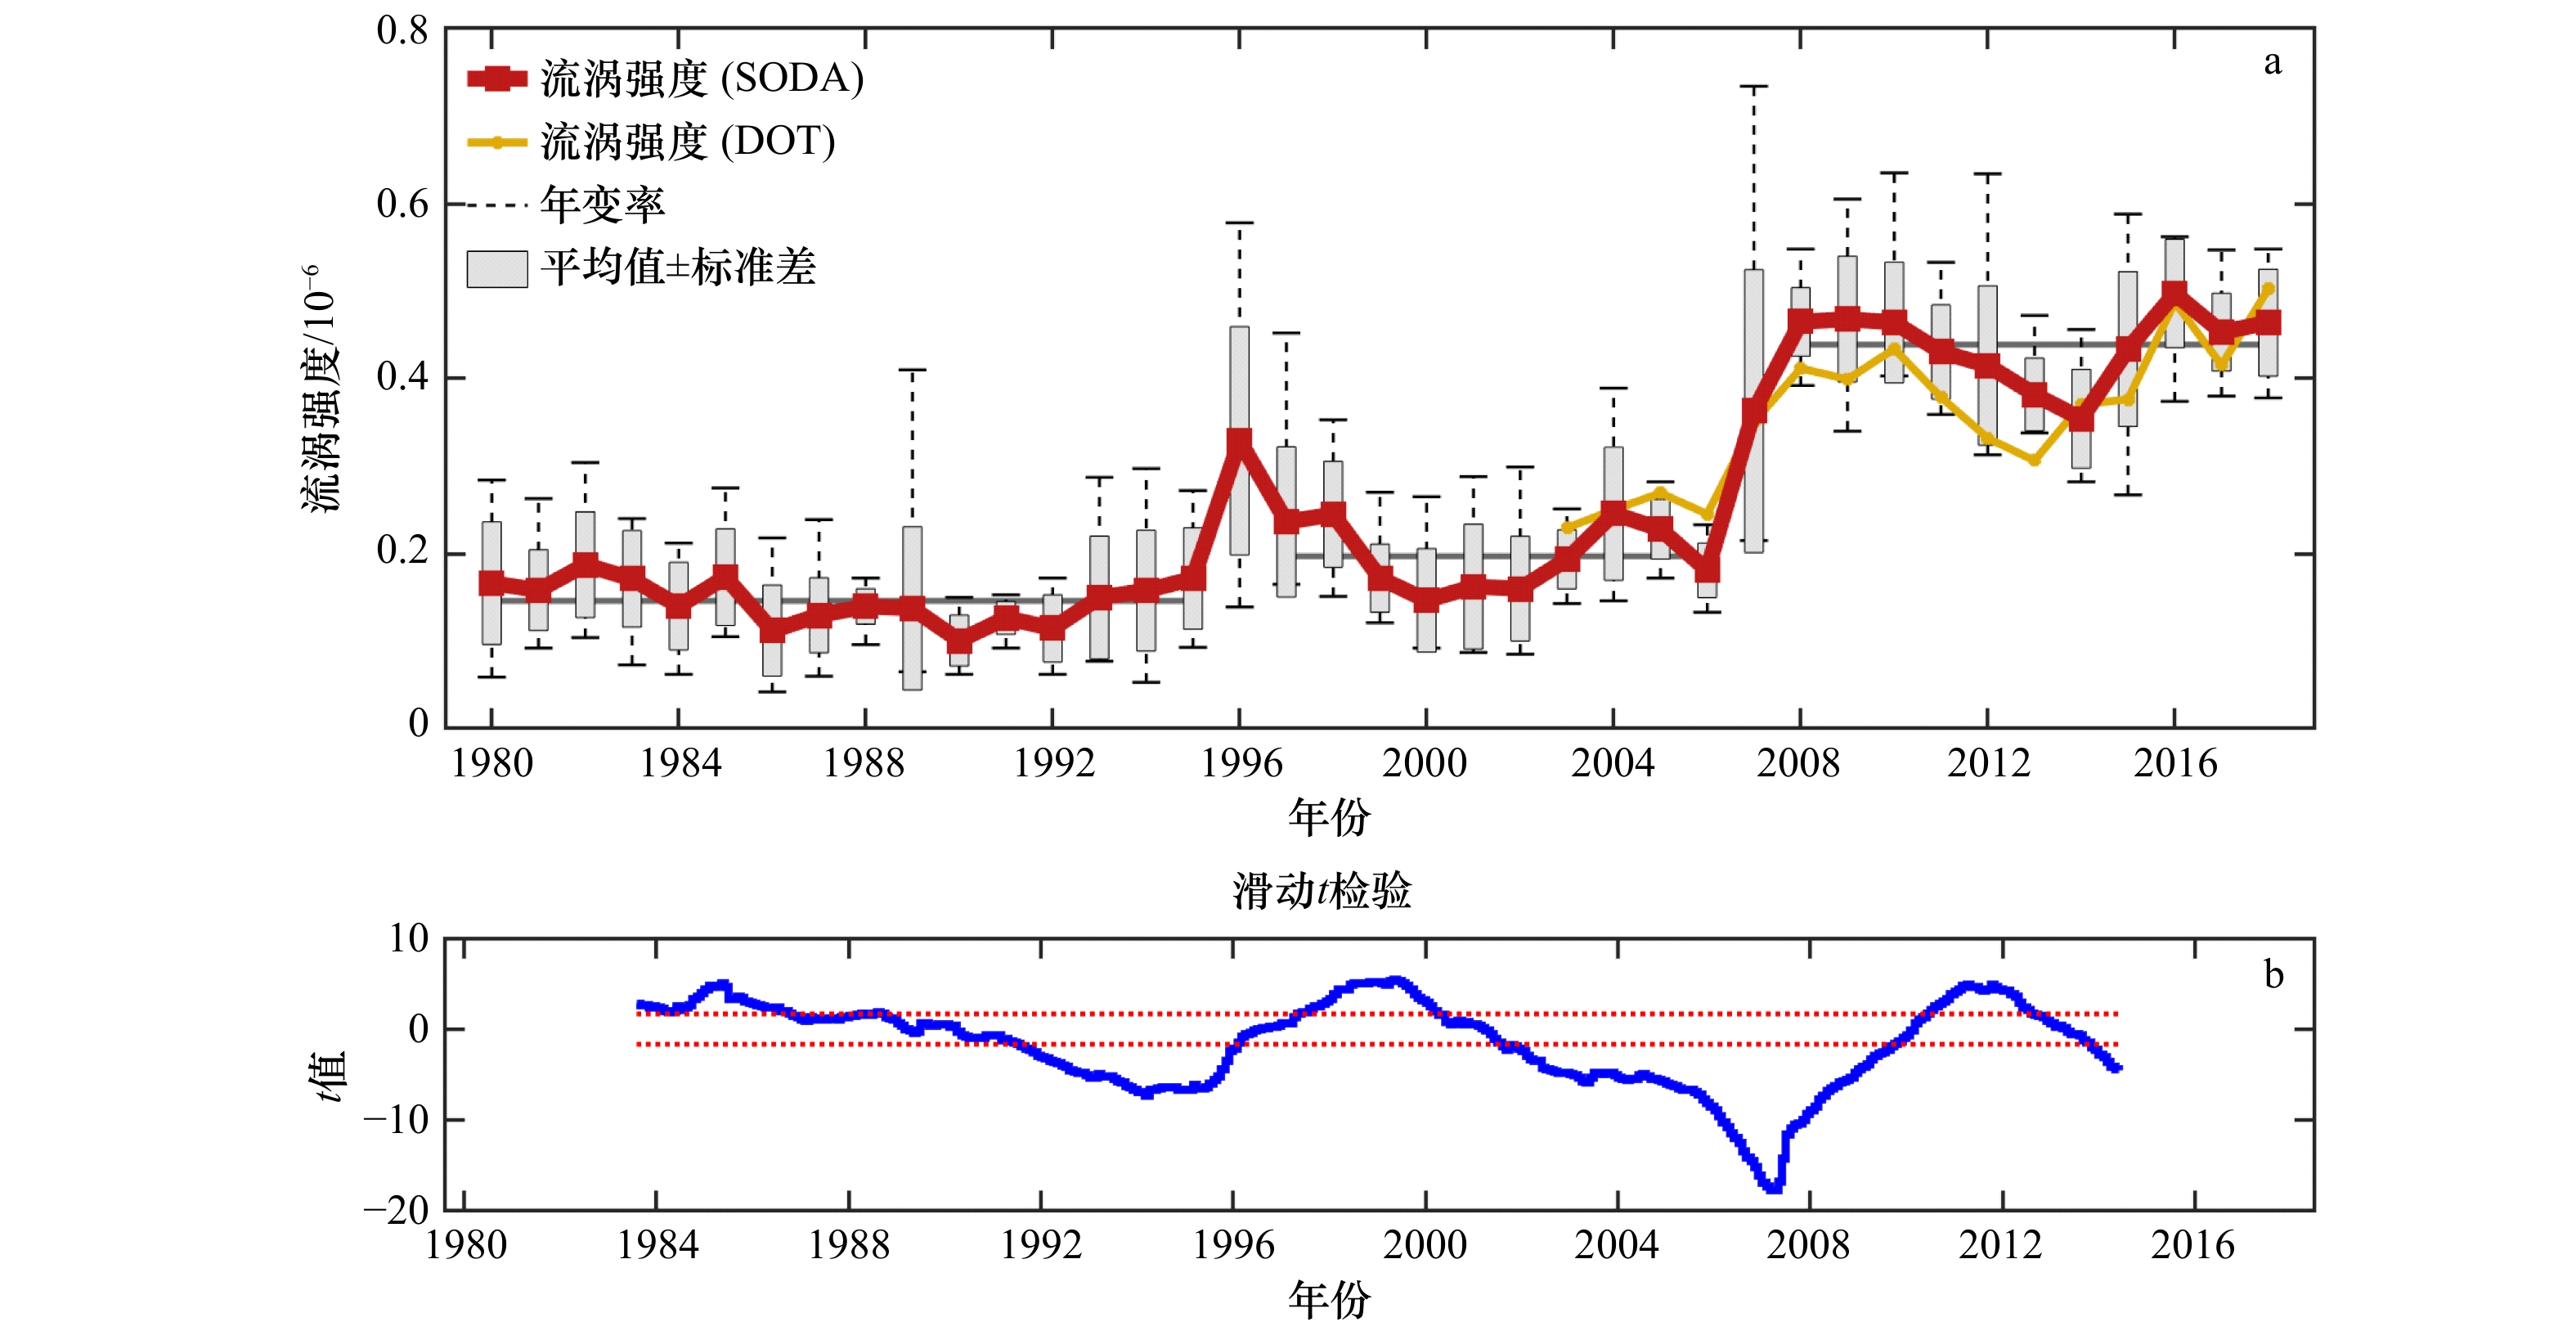
图 1 波弗特流涡强度的长期变化(a)及其滑动t检验(b,滑动窗口长度5年)
Fig. 1 Long term changes (a) and the moving 5-a t-test (b) of Beaufort Gyre strength
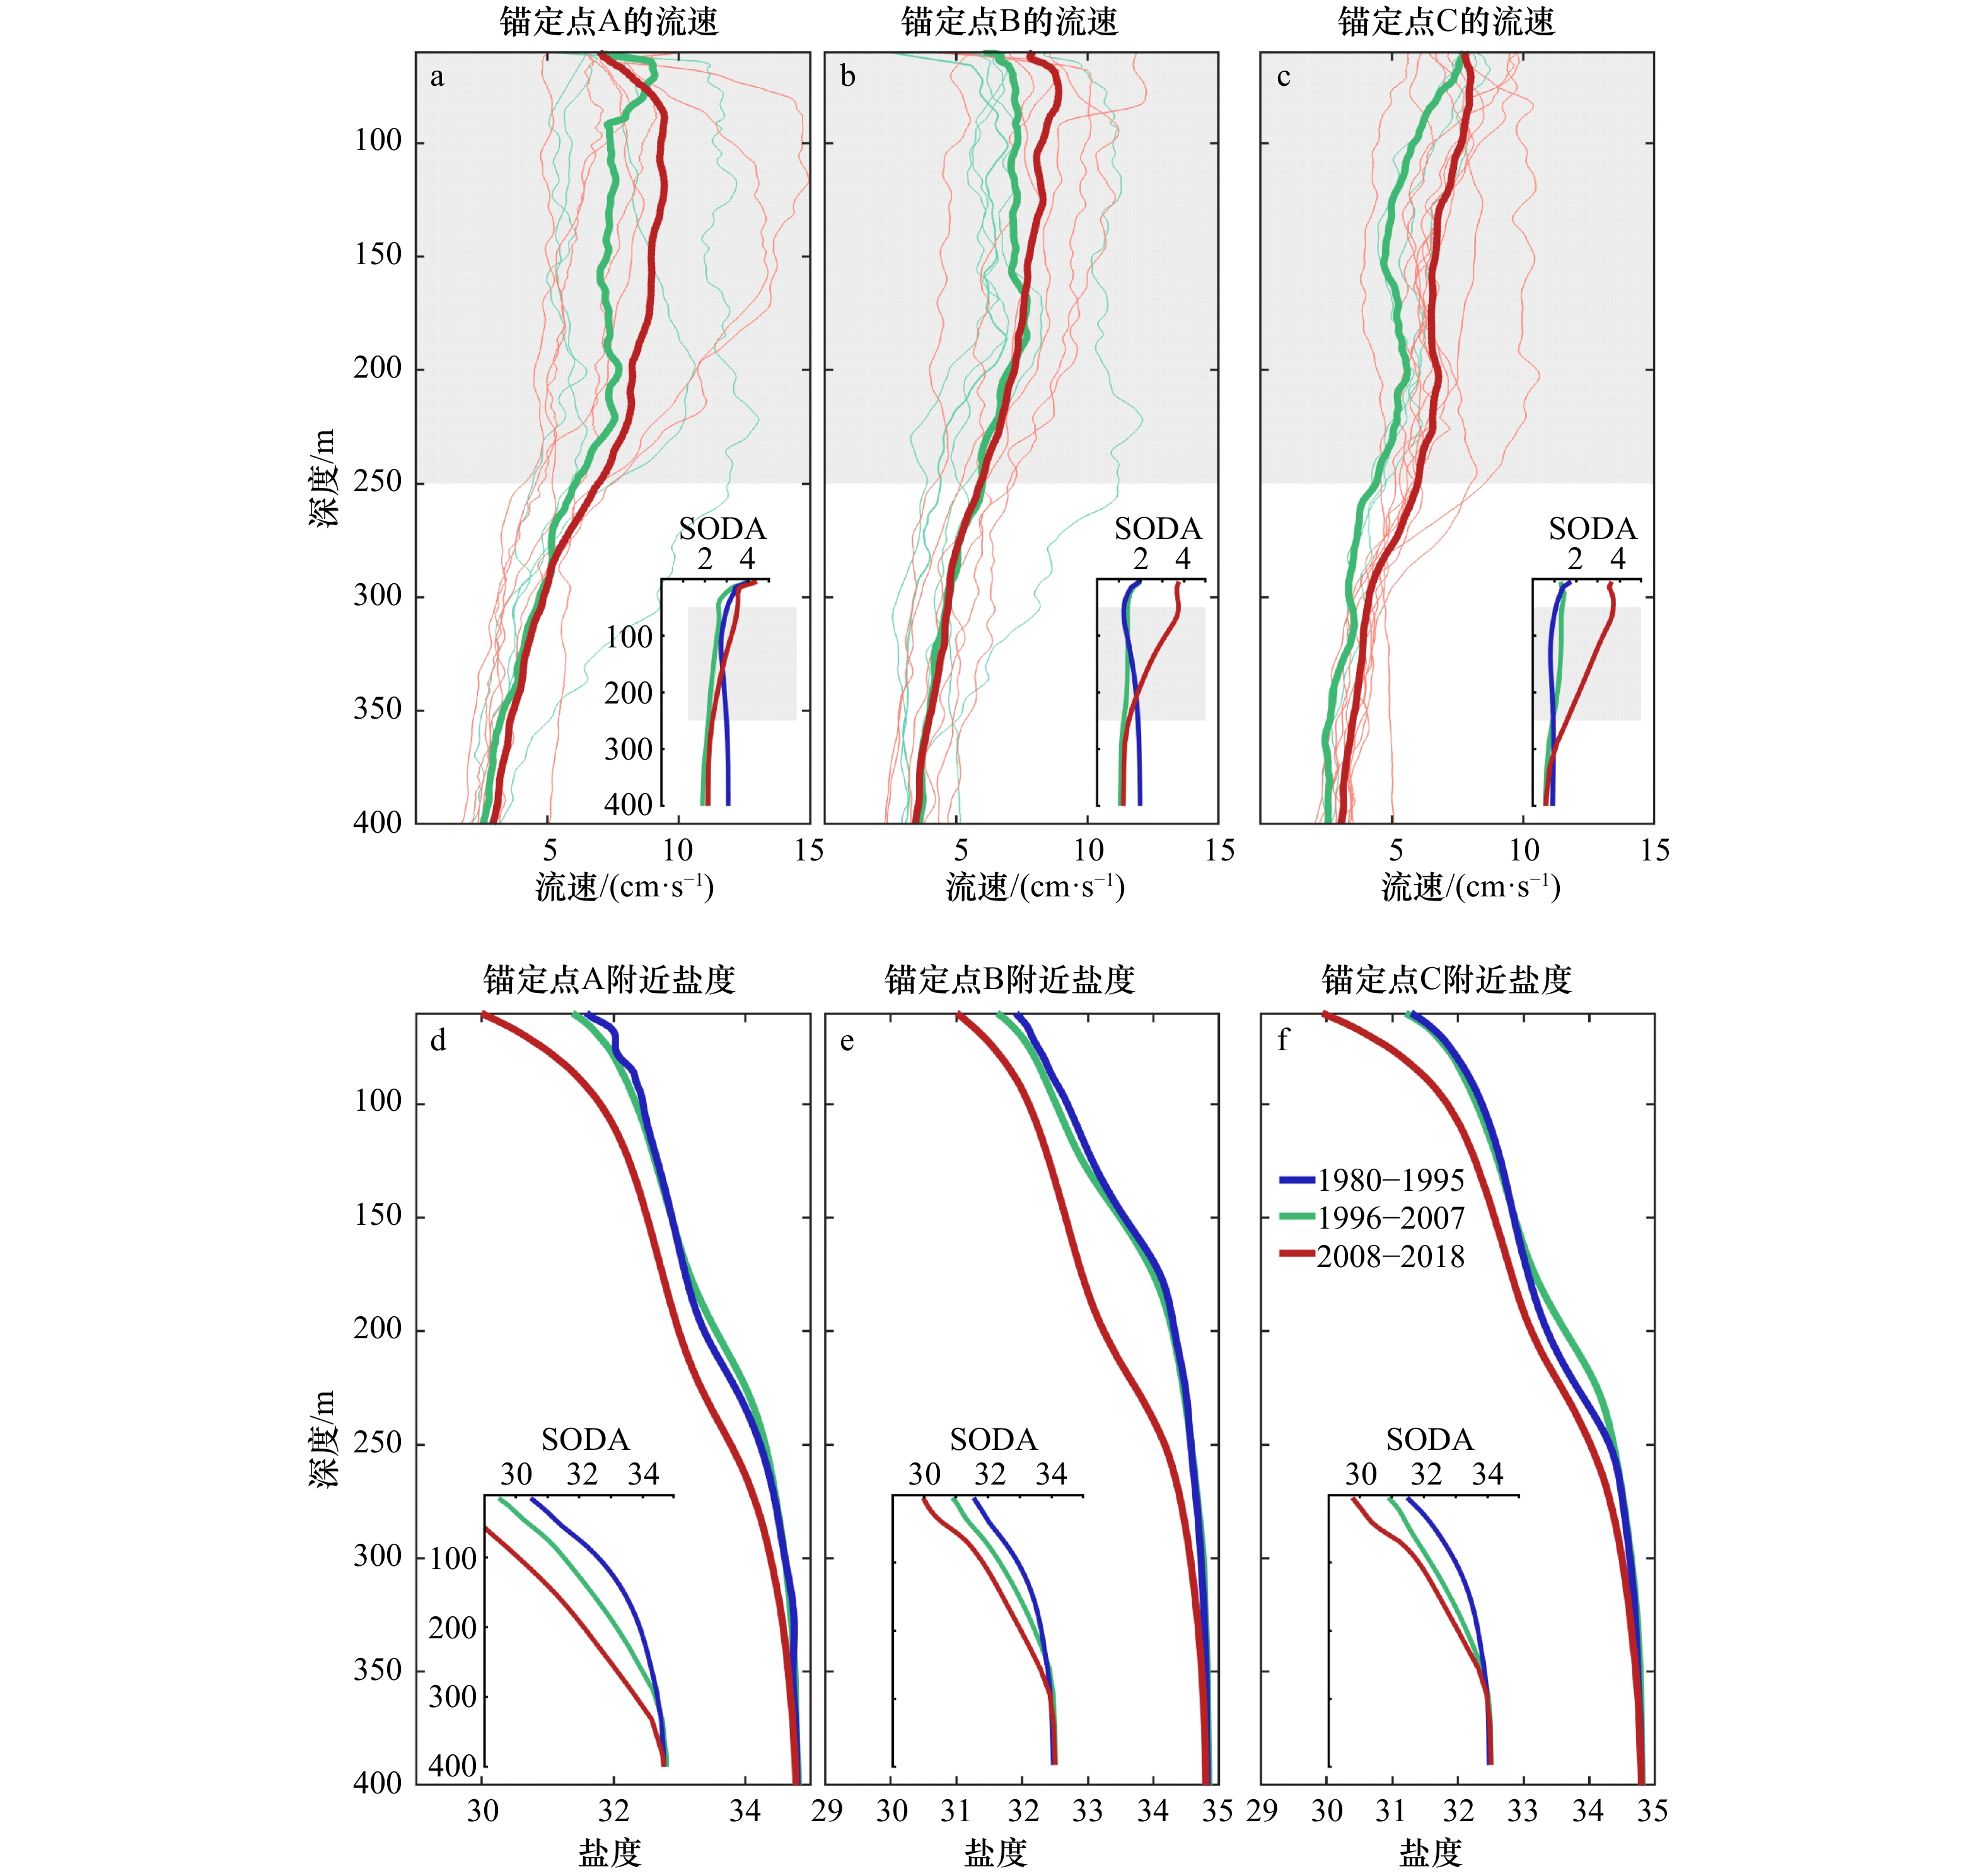
图 2 波弗特流涡内BGEP锚定点流速、WOD盐度和SODA再分析数据的垂直结构
a−c 中细绿(红)线表示锚定点 1996−2007年(2008−2018 年)的年平均流速。a−c(d−f )中粗蓝、绿和红线表示 1980−1995 年、1996−2007年和2008−2018 年的平均流速(盐度)
Fig. 2 The velocity vertical structure of BGEP moorings data and SODA reanalysis datasets as well as the salinity vertical structure of WOD data and SODA reanalysis datasets in the Beaufort Gyre
a−c indicate the annual mean current velocity of three moorings during 1996−2007 (2008−2018) by the thin green (red) lines. a−c (d−f) indicate the mean velocity (salinity) during 1980−1995, 1996−2007 and 2008−2018 by the thick blue, green and red lines
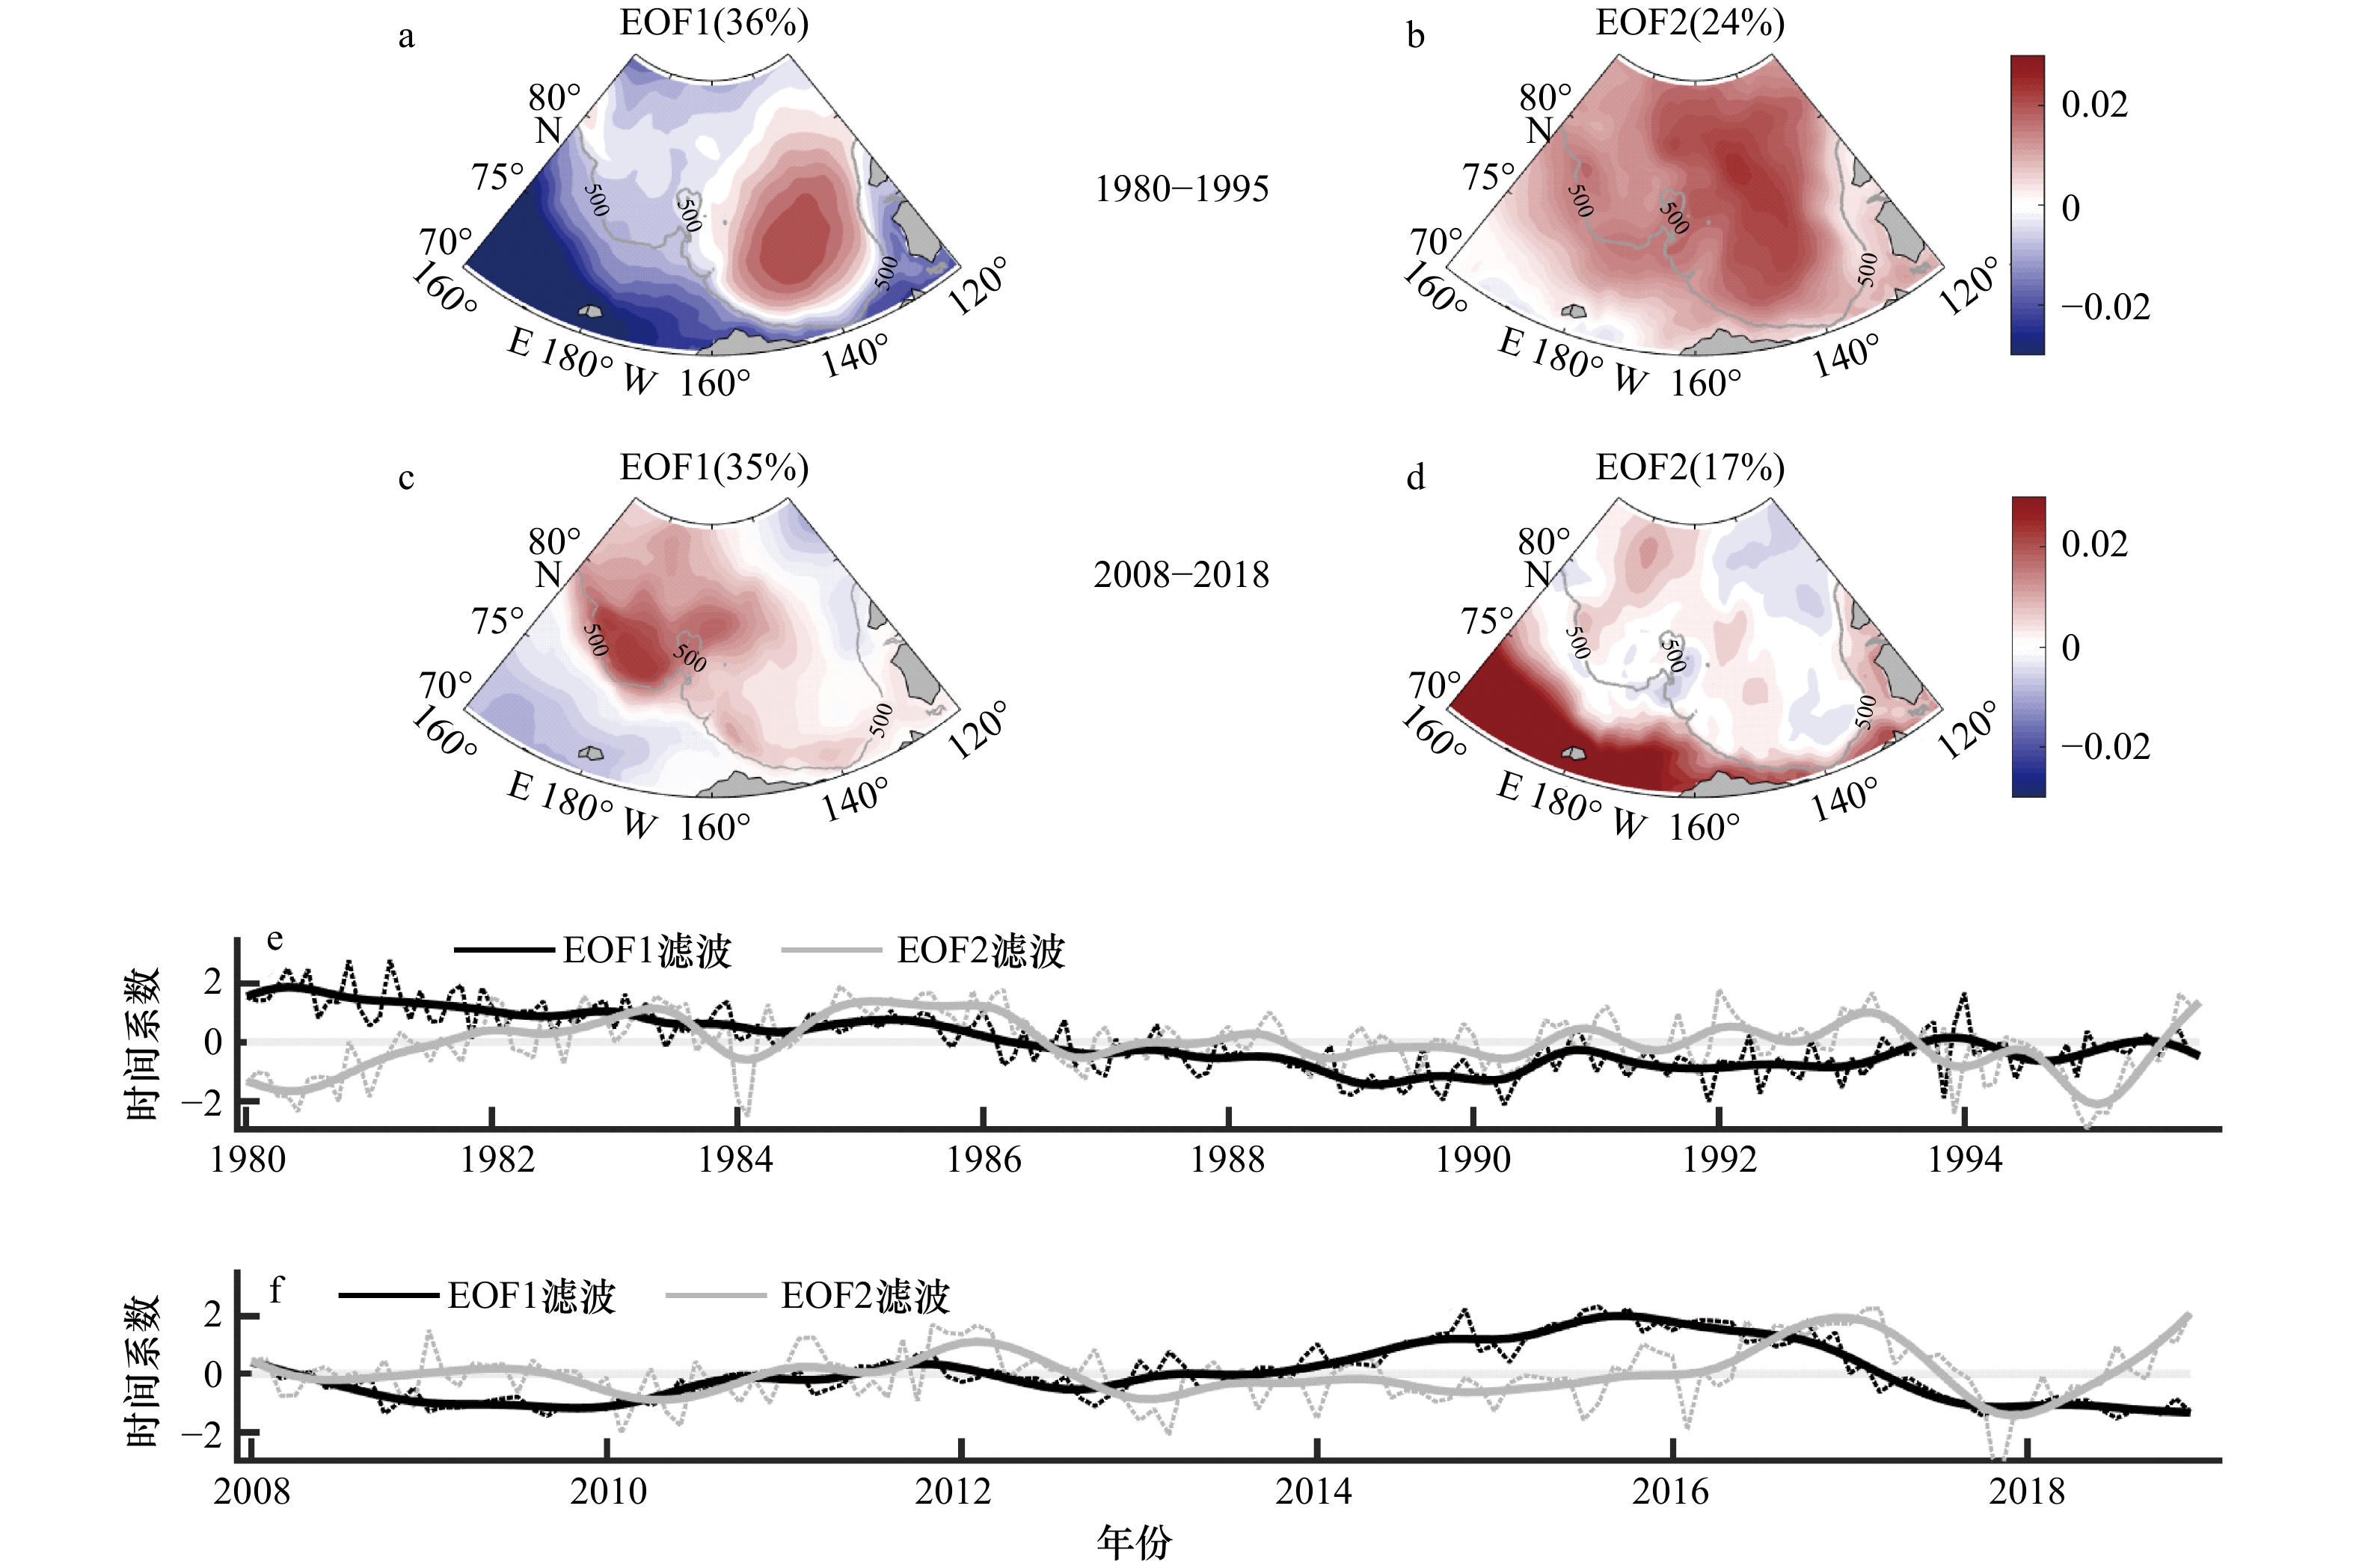
图 3 1980−1995 年、2008−2018 年 SODA 海面高度异常EOF 分析的前两个空间模态及其对应的时间系数
a, b(c, d)为1980−1995年(2008−2018年)海面高度异常EOF分解的前两个空间模态,灰色实线为500 m等深线。e,f图是空间模态对应的时间系数,其中粗实线为经过12个月低通滤波的时间系数
Fig. 3 First two spatial patterns and the corresponding time series of EOF analysis of SODA sea surface height anomalies during 1980−1995 and 2008−2018
a, b (c, d) show the spatial patterns of EOF of the first two sea level height anomalies during 1980−1995 (2008−2018), and the gray solid line indicates the 500 m isobath. e,f show the time series corresponding to the spatial patterns, and the thick solid line indicate the 12 months low-pass filtering results of the first two modes

图 4 波弗特流涡范围(a)、断面流速垂直结构(b, c)和断面流量(d)的长期变化
a中阴影代表2003−2014年的平均海洋动力地形,粗实线分别为1984年、1997年和2012年SODA数据刻画的年平均波弗特流涡范围,灰色实线为选取断面。b, c为1980−1995年和2008−2018年断面流速,负值表示海流向南
Fig. 4 Beaufort Gyre area (a) as well as the velocity vertical structure (b, c) and the volume transport long term changes (d) of the selected section
a shows the mean ocean dynamic topography during 2003−2014, by the thick blue, green and red lines indicate annual mean Beaufort gyre area in 1984, 1997 and 2012 derived by SODA datasets, respectively, the gray solid line indicates the selected section. b and c show the section velocity during 1980−1995 and 2008−2018, negative values indicate southward current vector
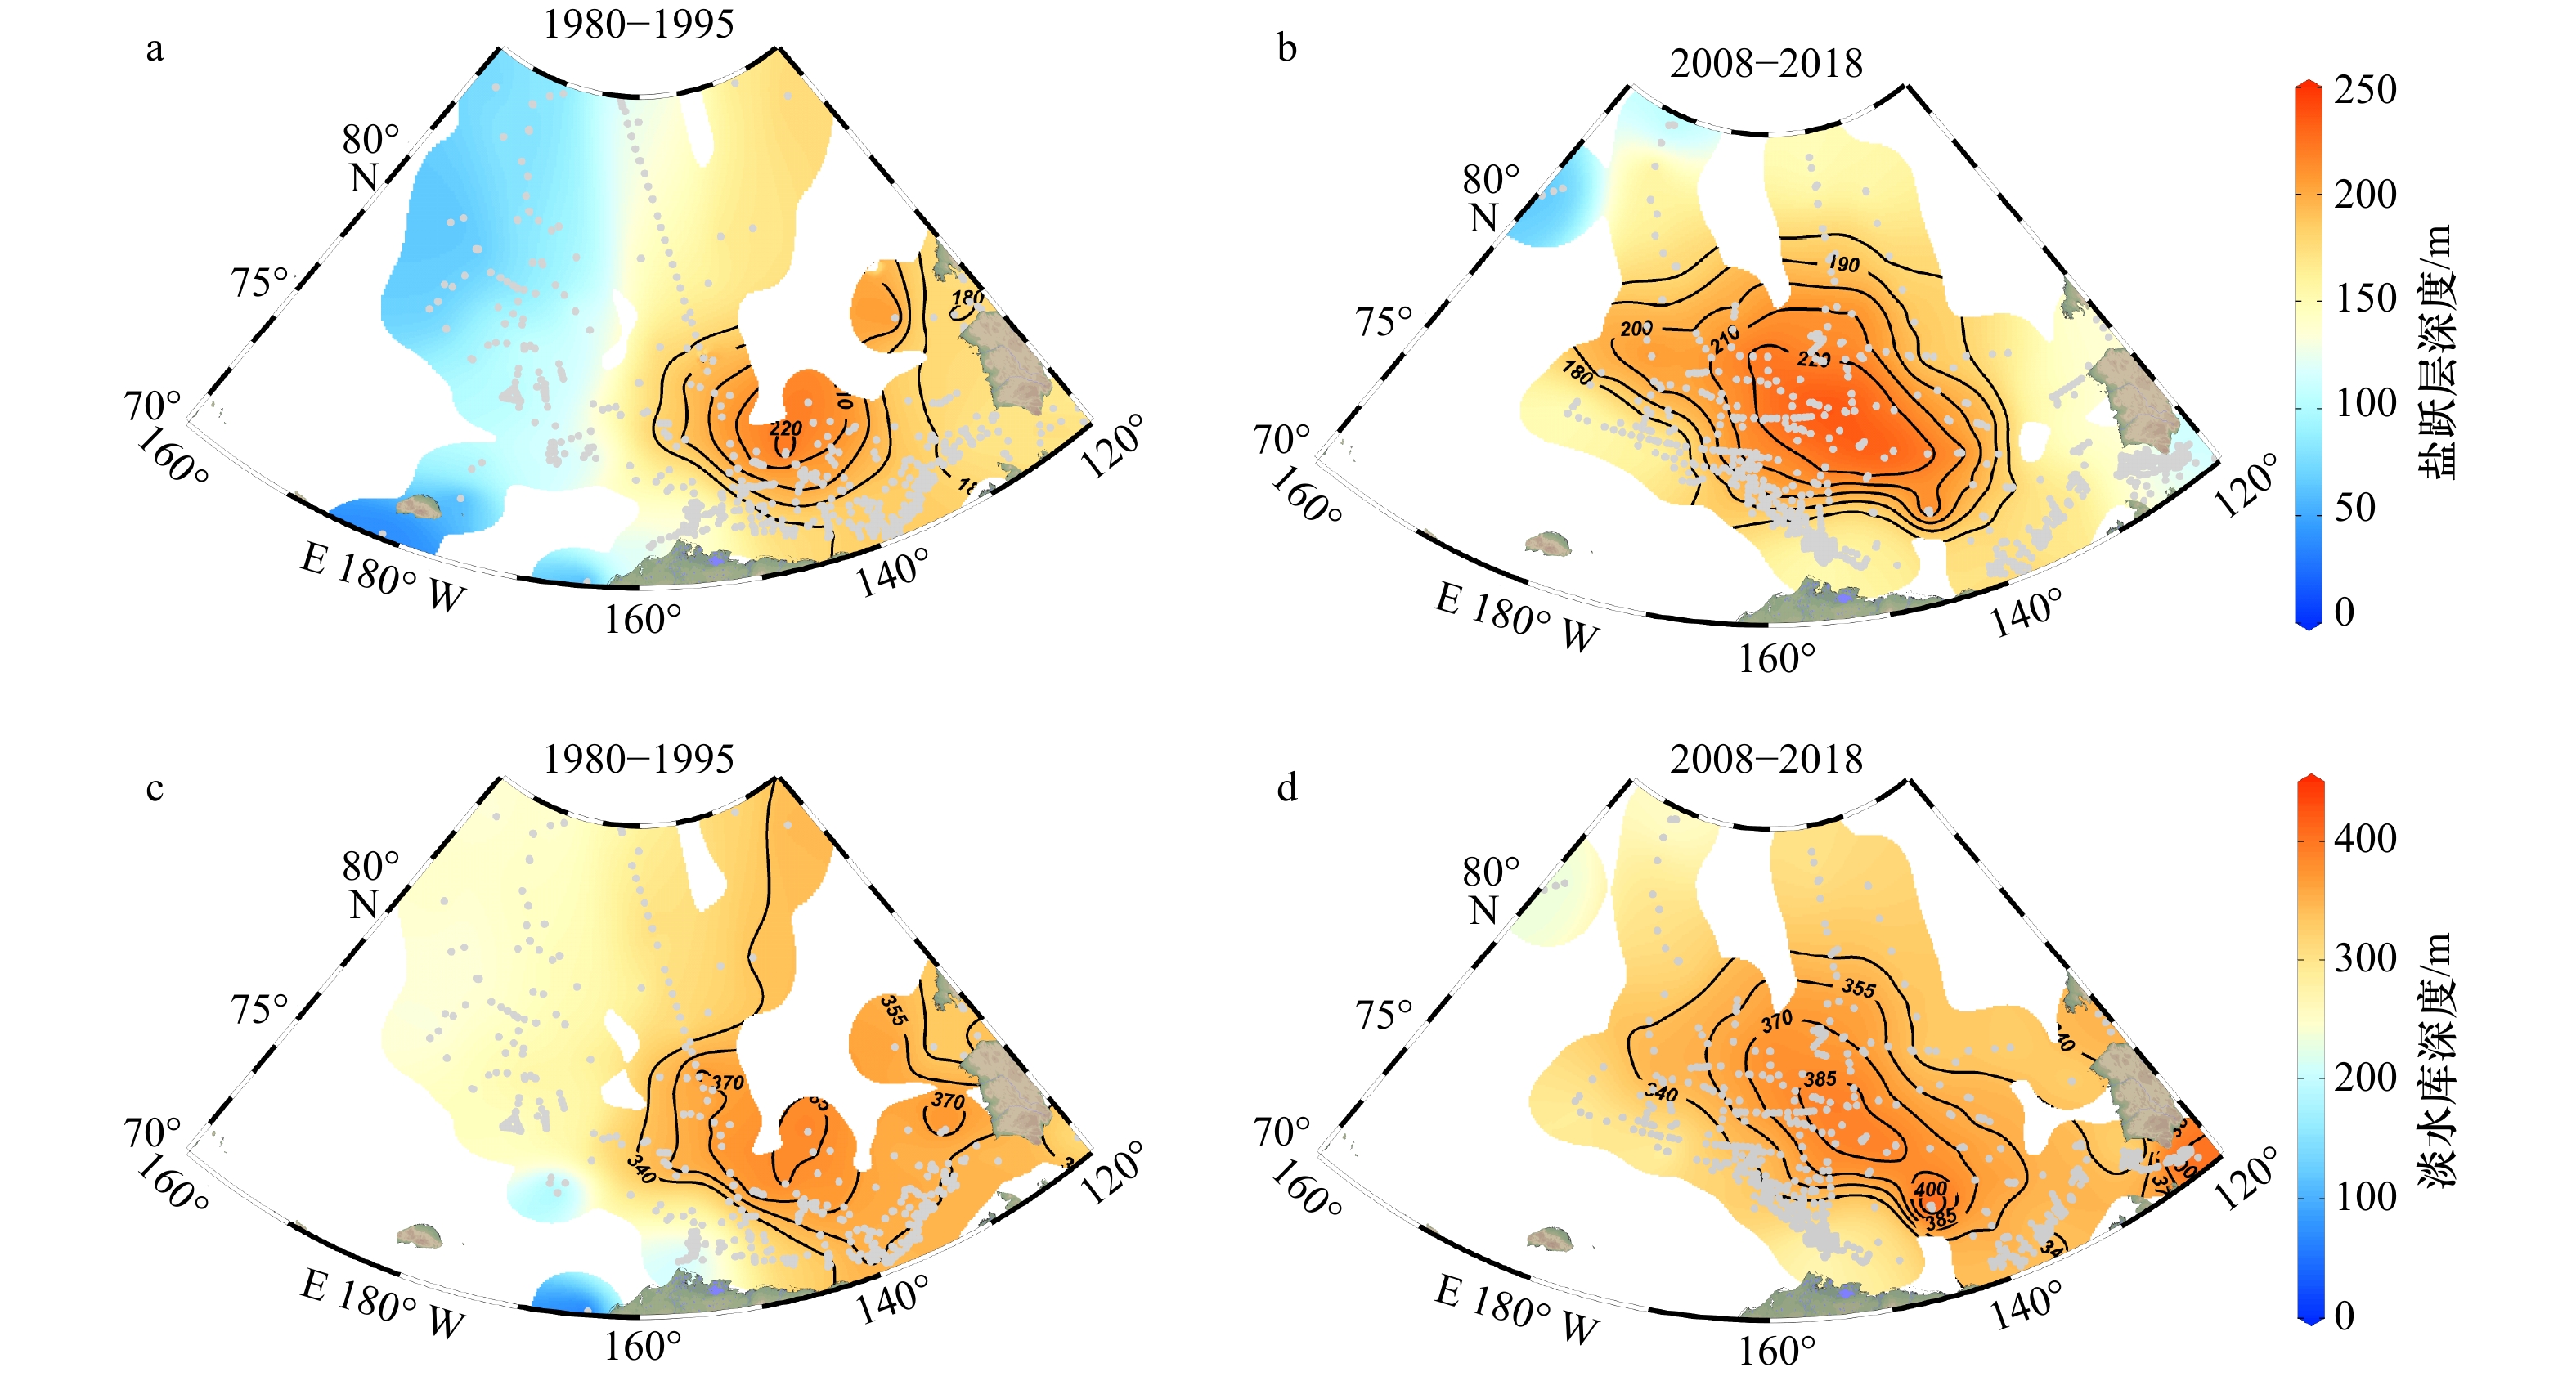
图 5 1980−1995年、2008−2018年的盐跃层深度和淡水库深度的空间分布
Fig. 5 Spatial characteristics of halocline depth and freshwater reservoir depth during 1980−1995 and 2008−2018
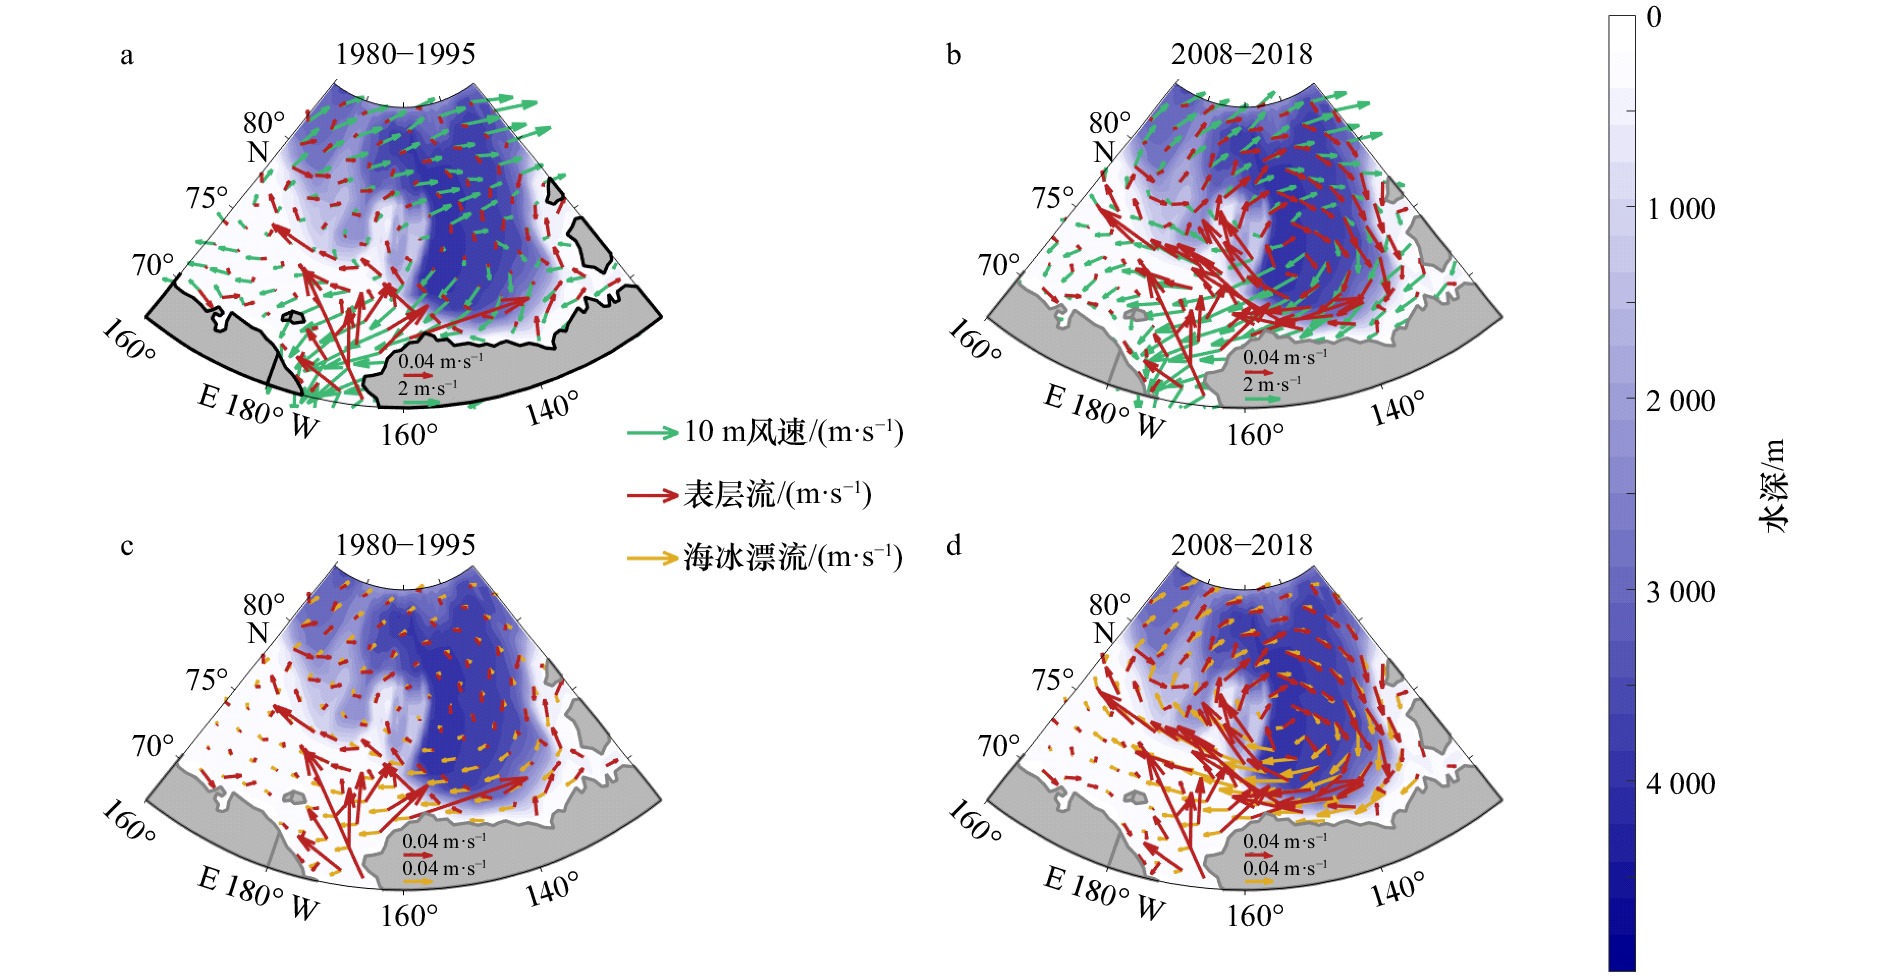
图 6 1980−1995年、2008−2018年的10 m风场、表层流场和海冰漂流场
Fig. 6 Wind speed at 10 m, sea surface current and sea ice motion during 1980−1995 and 2008−2018
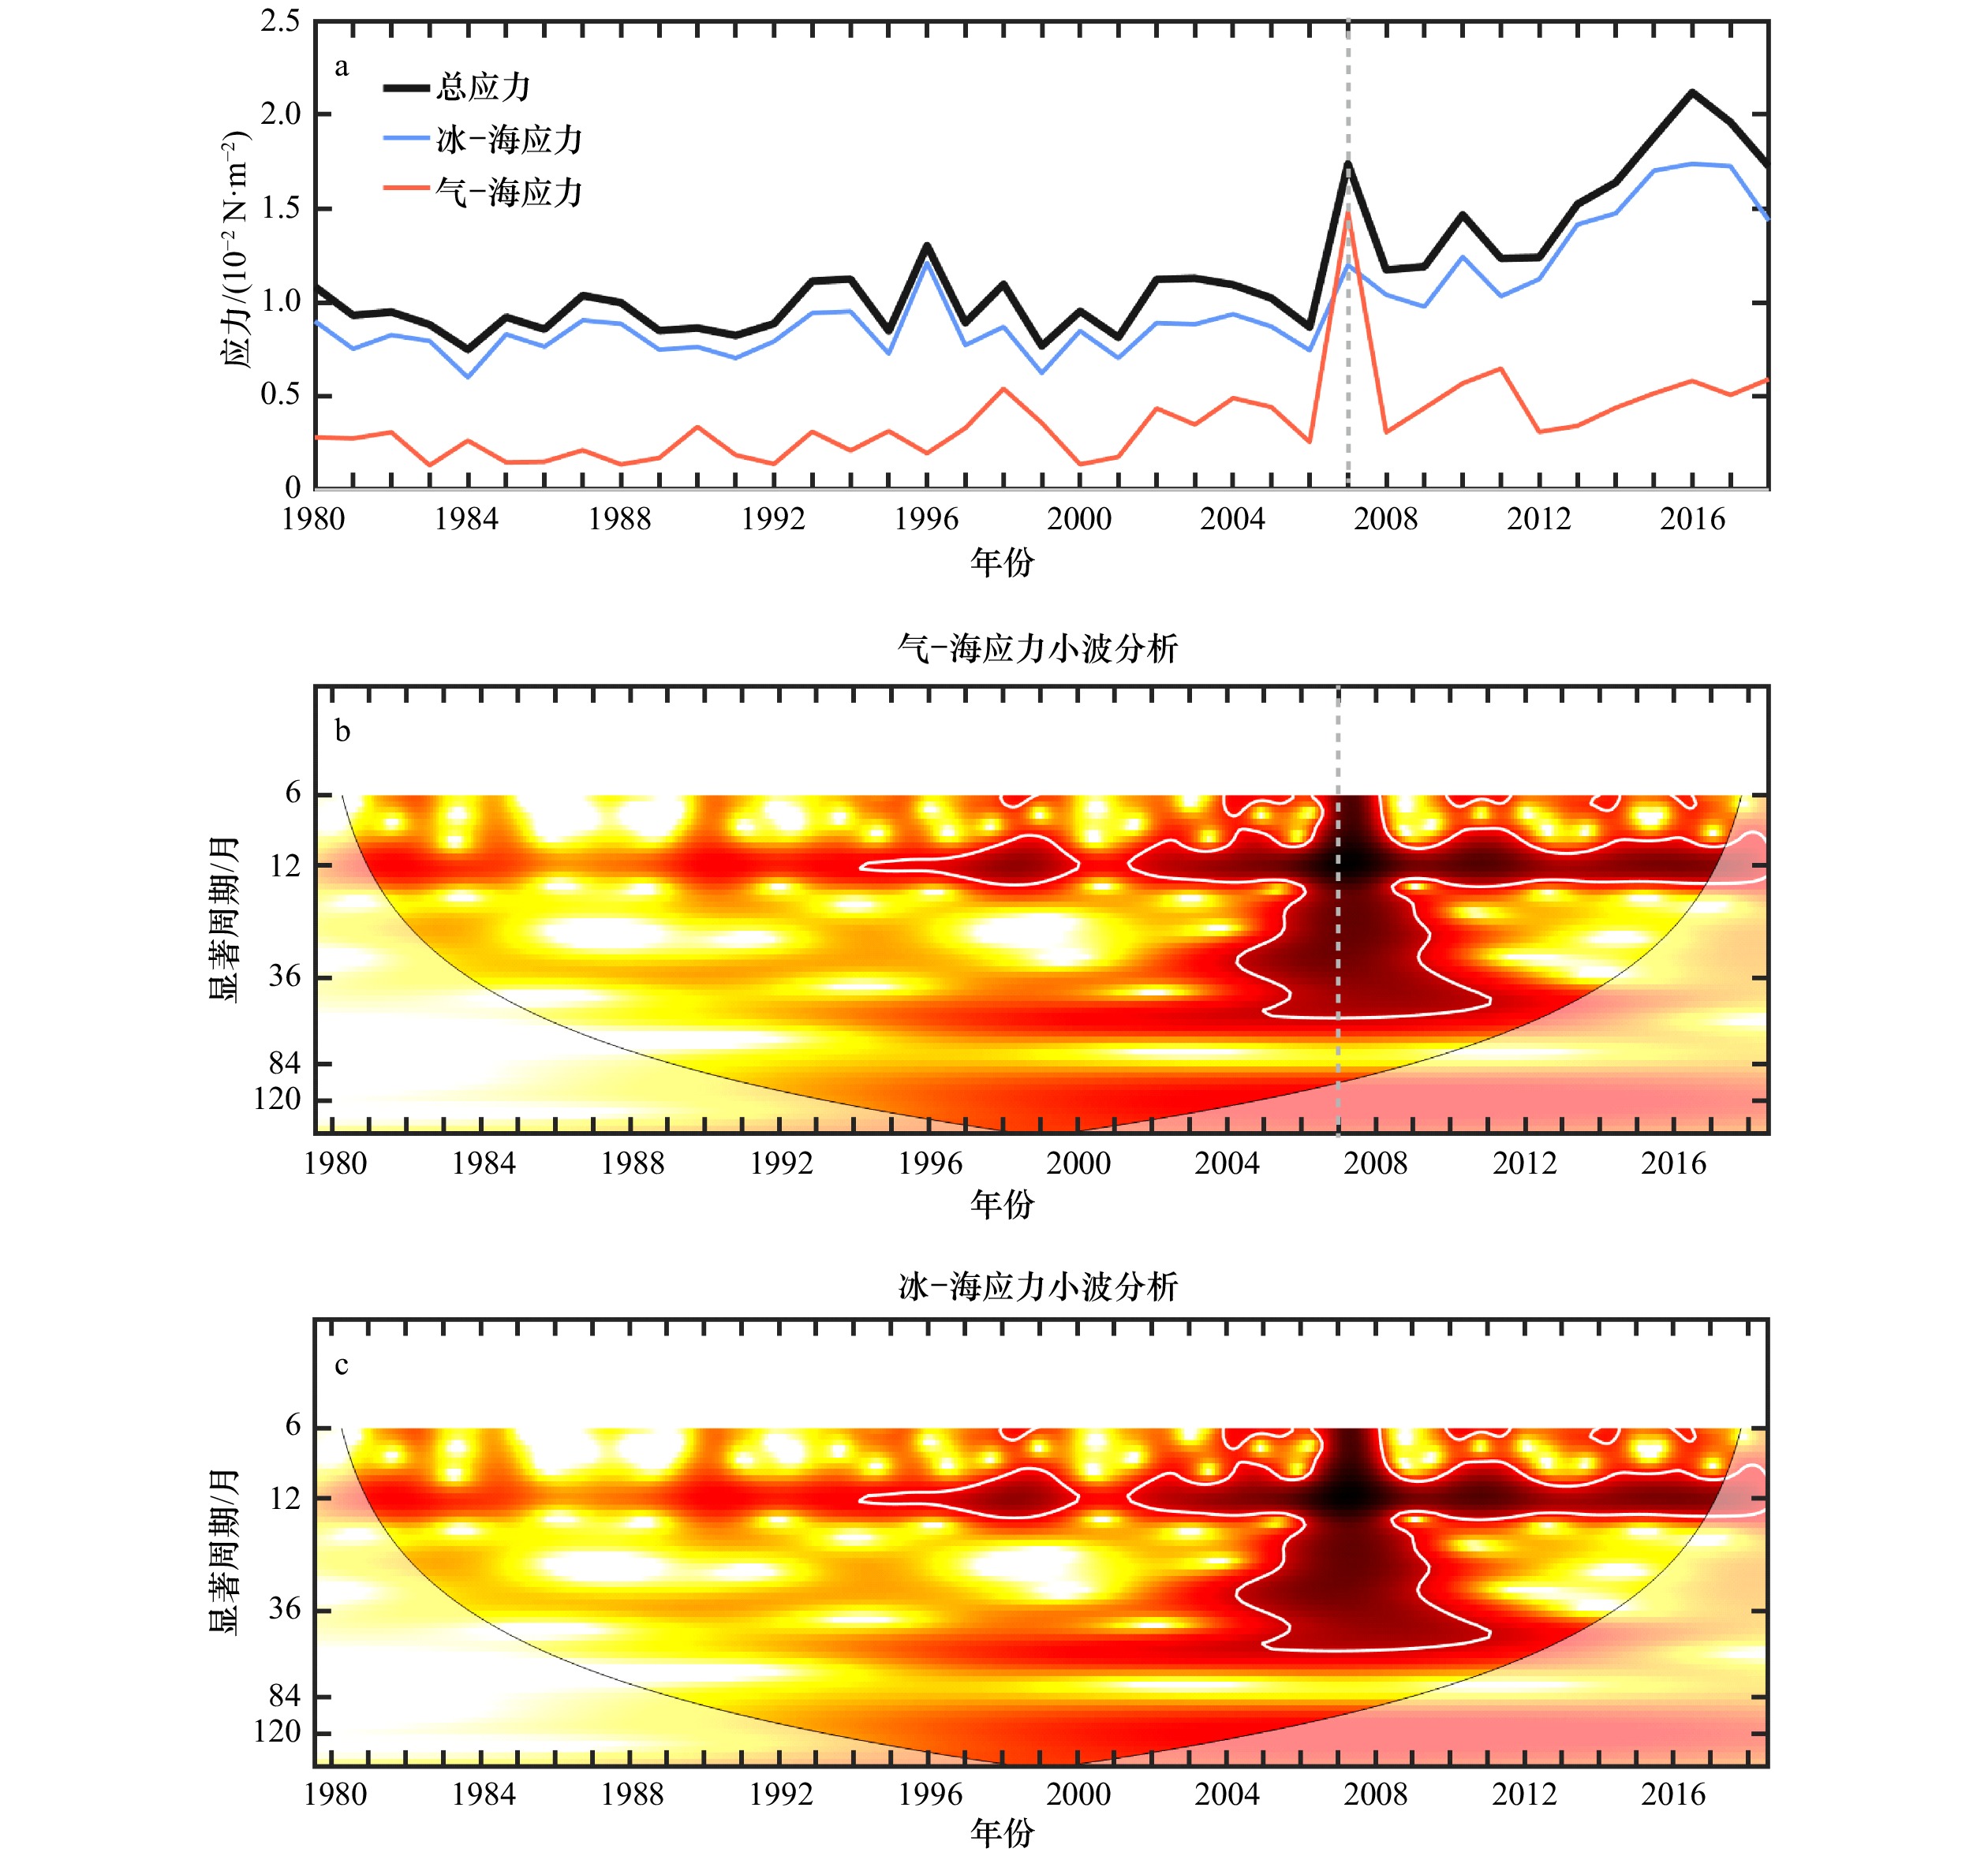
图 7 上层海洋应力的长期变化、气−海应力和冰−海应力的小波分析
Fig. 7 Long term changes of upper ocean stress as well as air-ocean stress and ice-ocean stress wavelet analysis

图 8 气−海应力、冰−海应力的季节变化和夏末秋初(8−10月)上层海洋应力的长期变化
Fig. 8 Seasonal variations of air-ocean stress and ice-ocean stress as well as long term changes of upper ocean stress in late summer and early autumn (August, September, October)
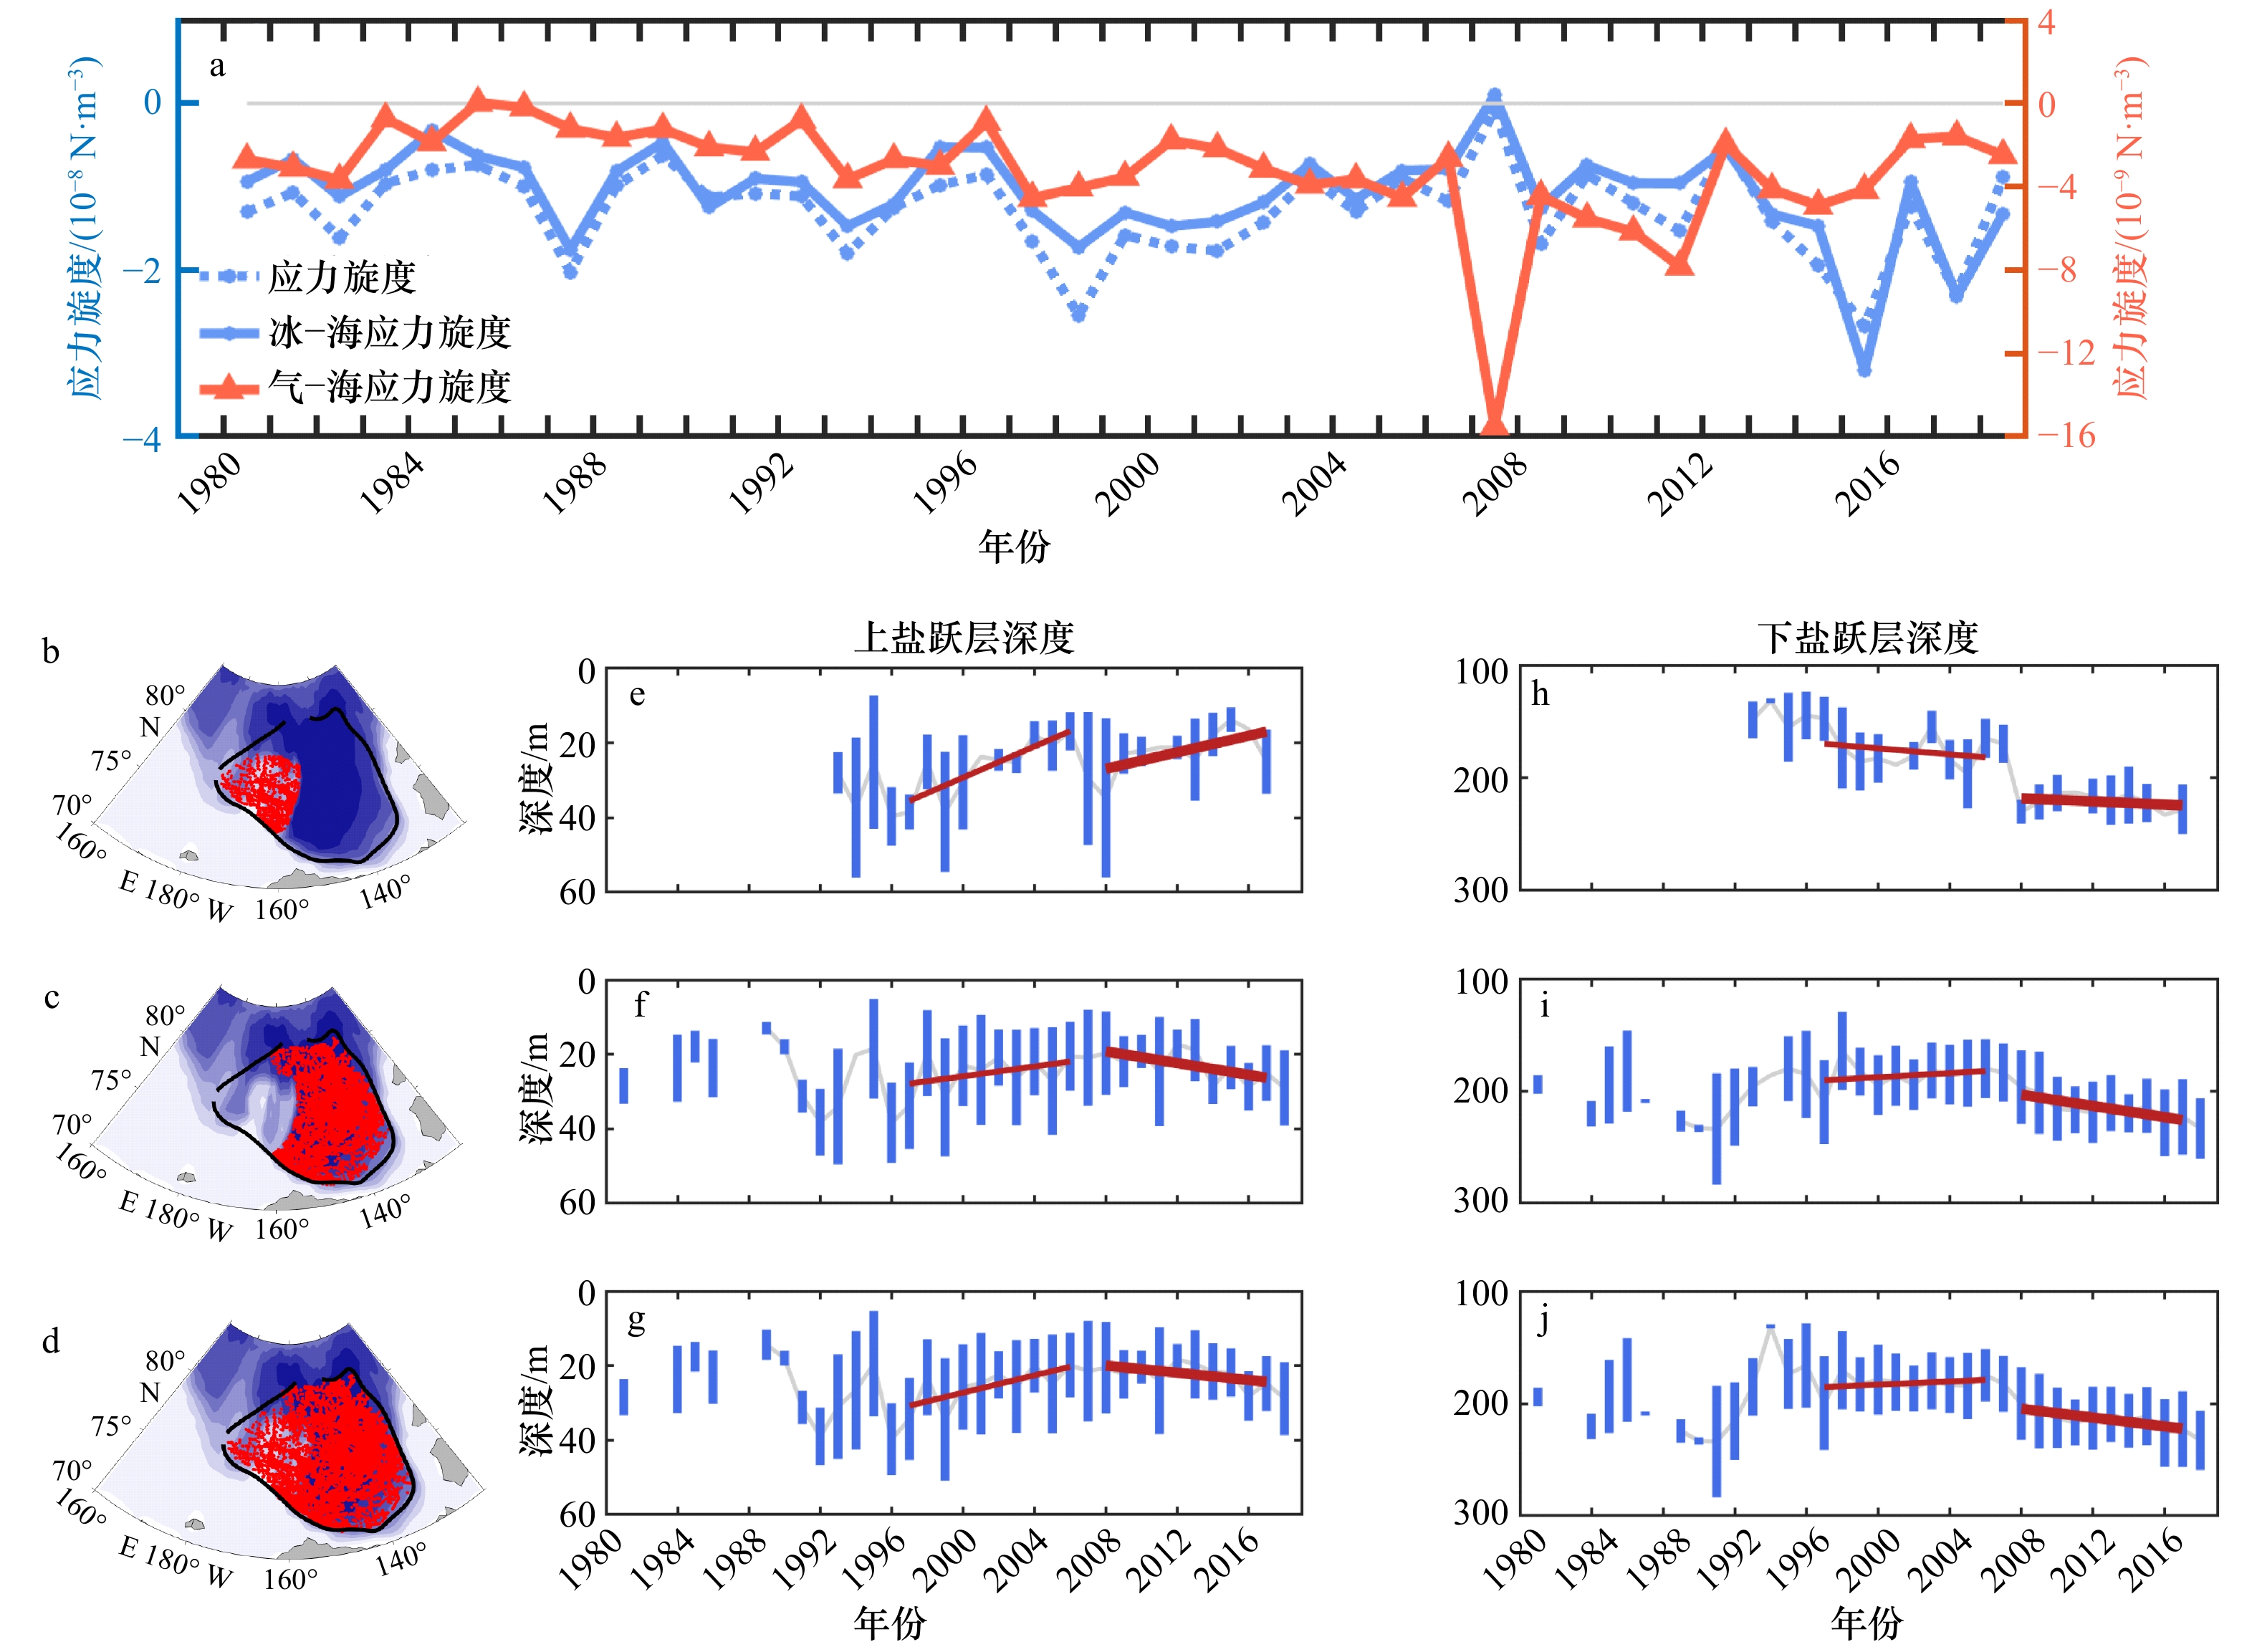
图 9 应力旋度和由实测数据计算得到盐跃层深度的长期变化
b−d给出了实测 CTD 站点的位置(红色点)和波弗特流涡平均范围(黑色实线)。 e−j 中蓝色误差棒为年平均值加减1倍标准差,红色实线为不同时期的变化趋势(第1个时期由于数据样本个数少,未求其趋势)
Fig. 9 Long term changes of stress curl and halocline depth derived from observed data
b−d indicate the locations of CTD stations by red dots and the mean Beaufort Gyre area by black solid line. e−j indicate annual mean plus or minus one standard deviation by the blue bar and the trend of different periods by the red solid line (the trend of the first period was not calculated due to lacked of data samples)
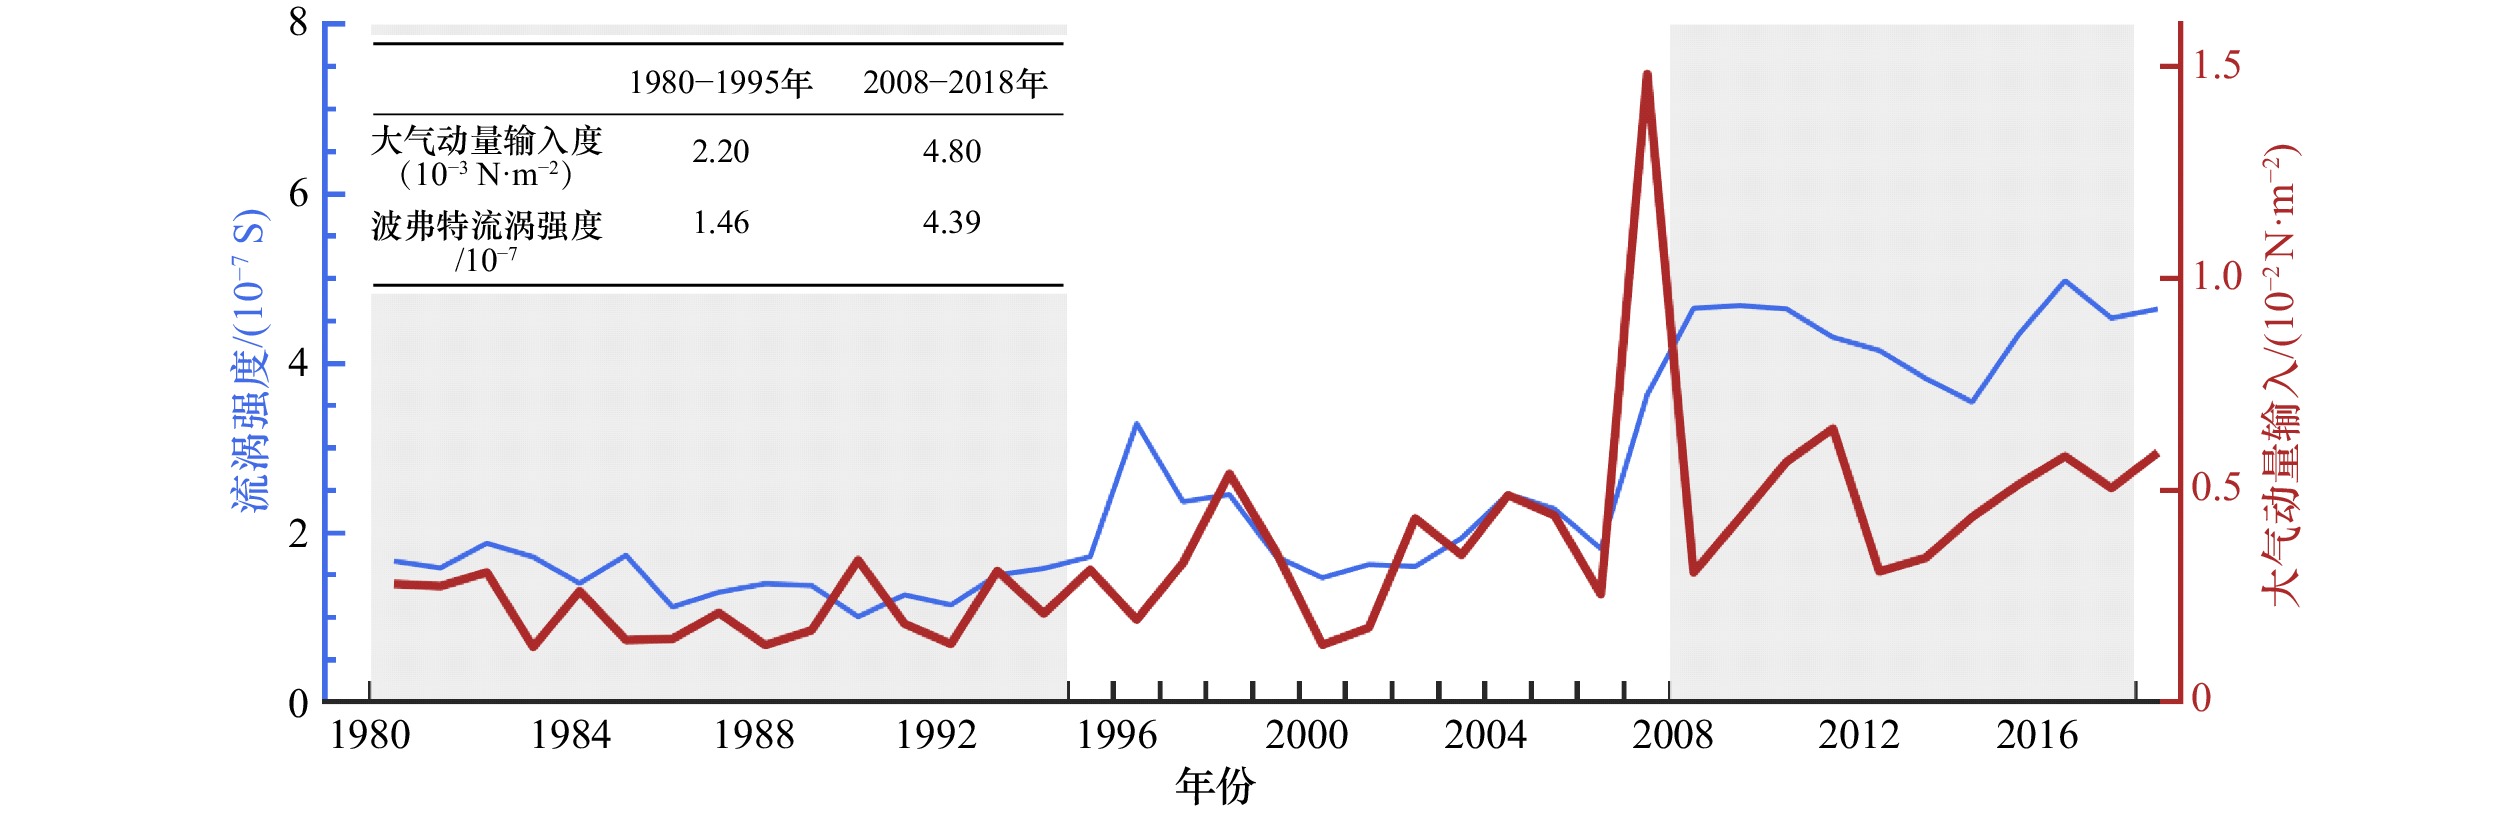
图 10 上层海洋的大气动量输入和流涡强度长期变化
Fig. 10 Long term changes of Beaufort Gyre strength and upper ocean atmospheric momentum input
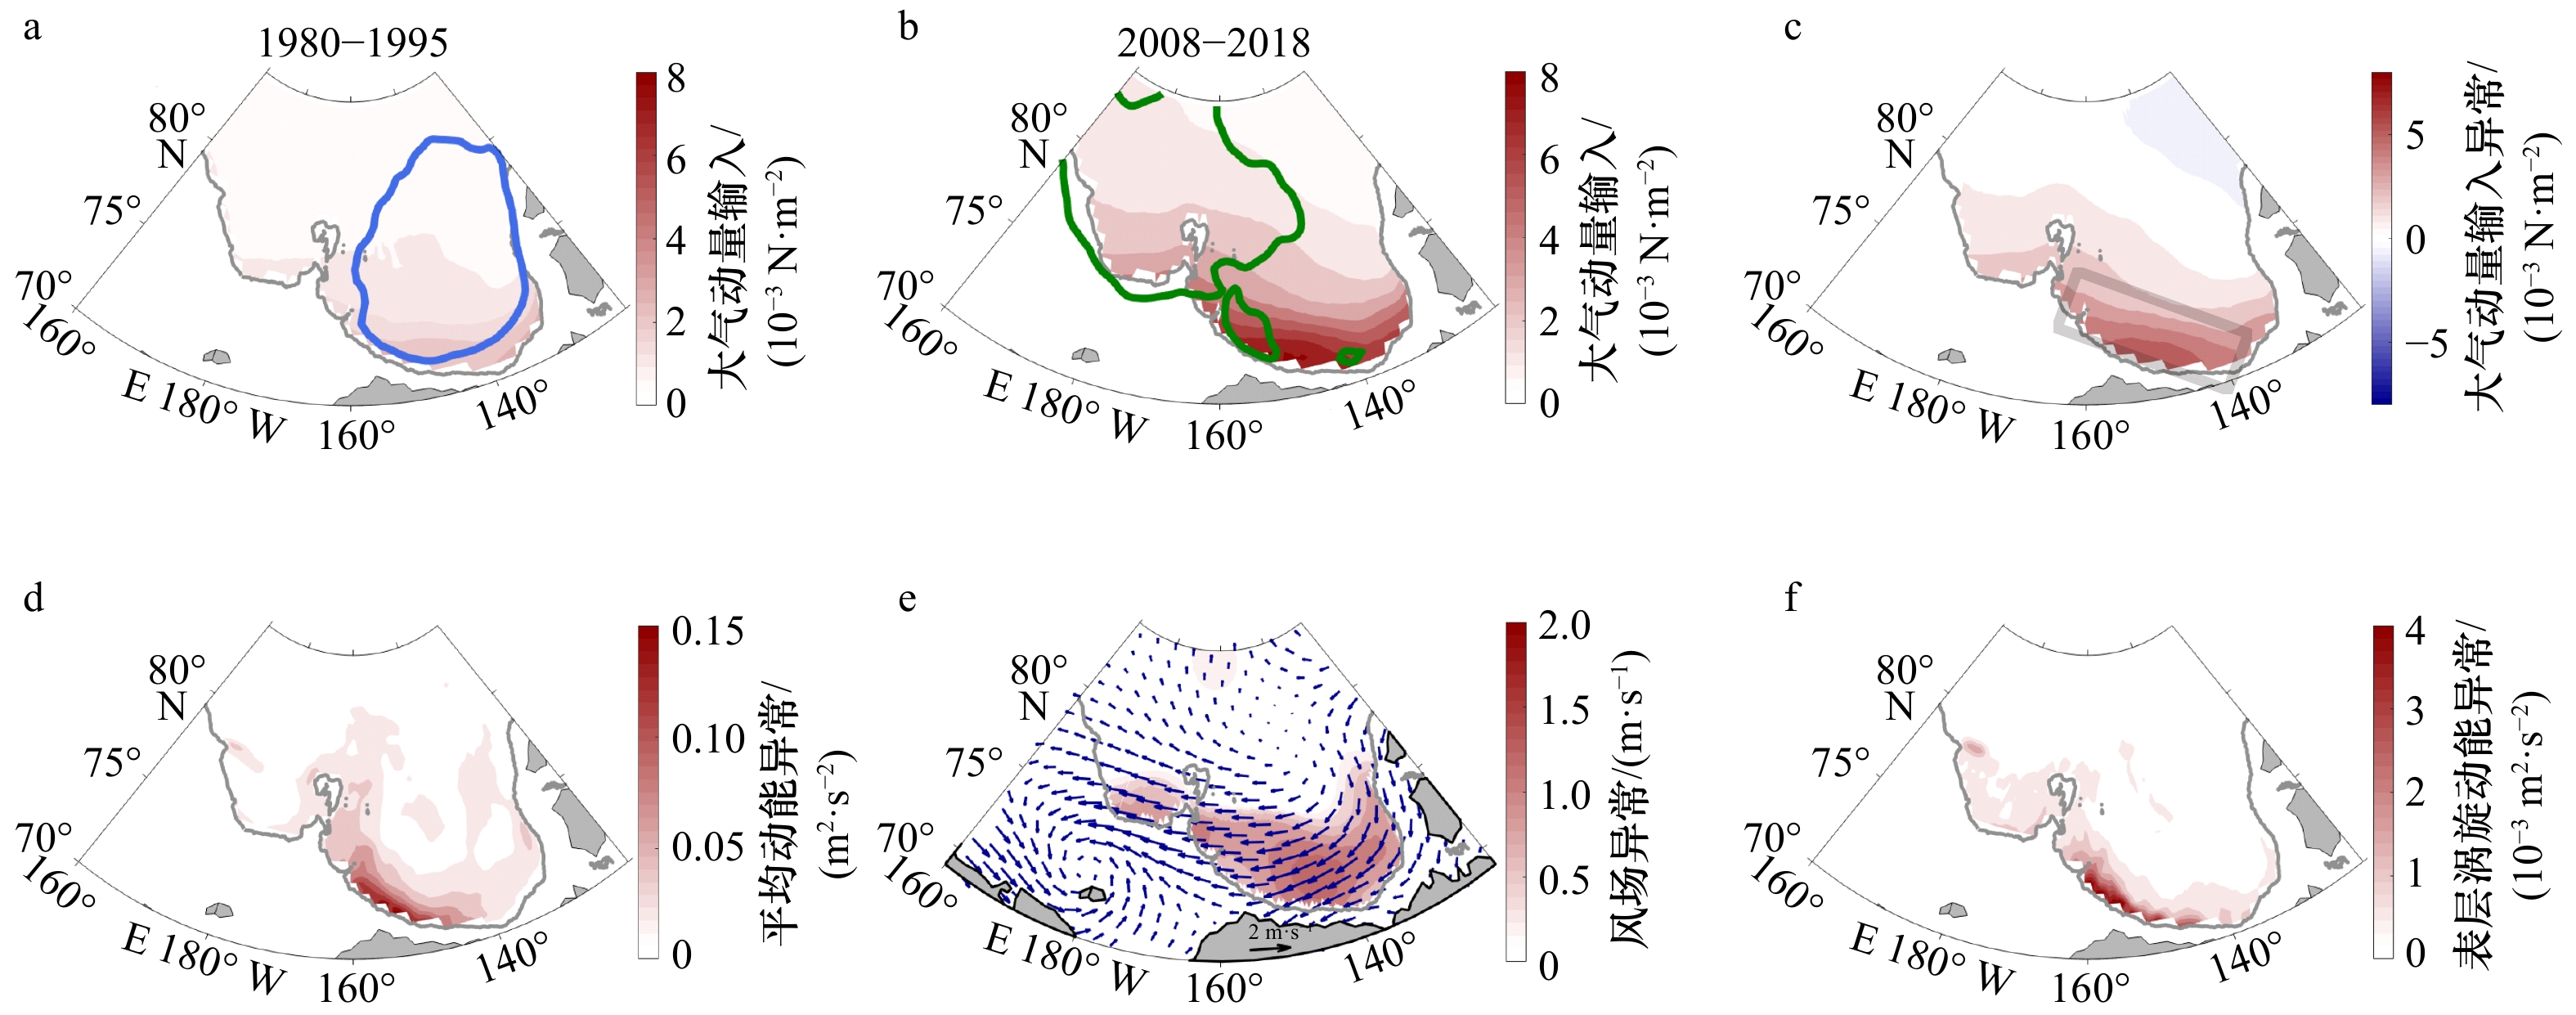
图 11 1980−1995年、2008−2018年的气象要素和上层海洋动能的空间分布和差异
图中异常指的是各物理量2008−2018年和1980−1995年气候态平均的差异。a中蓝线为加拿大海盆模态,b中绿线为太平洋扇区模态,c中灰色方框为关键区位置
Fig. 11 Spatial characteristics and difference of meteorological factors as well as upper ocean kinetic energy during 1980−1995 and 2008−2018
The discrepancy in the figures refers to the physical characteristics difference between the mean state during 2008−2018 and 1980−1995. a. Blue line is the Canada basin mode, b. green line is Pacific sector mode, c. gray box is on behalf of the location of the key area
-
[1] Screen J A, Simmonds I. The central role of diminishing sea ice in recent Arctic temperature amplification[J]. Nature, 2010, 464(7293): 1334−1337. doi: 10.1038/nature09051 [2] Previdi M, Janoski T P, Chiodo G, et al. Arctic amplification: A rapid response to radiative forcing[J]. Geophysical Research Letters, 2020, 47(17): e2020GL089933. [3] Meier W N, Stroeve J, Barrett A, et al. A simple approach to providing a more consistent Arctic sea ice extent time series from the 1950s to present[J]. The Cryosphere, 2012, 6(6): 1359−1368. doi: 10.5194/tc-6-1359-2012 [4] Perovich D, Meier W, Tschudi M, et al. [The Arctic] sea ice cover [in “State of the Climate in 2018”][J]. Bulletin of the American Meteorological Society, 2019, 100(9): S146−S150. [5] Davis P E D, Lique C, Johnson H L, et al. Competing effects of elevated vertical mixing and increased freshwater input on the stratification and sea ice cover in a changing Arctic Ocean[J]. Journal of Physical Oceanography, 2016, 46(5): 1531−1553. doi: 10.1175/JPO-D-15-0174.1 [6] Aagaard K, Swift J H, Carmack E C. Thermohaline circulation in the Arctic mediterranean seas[J]. Journal of Geophysical Research: Oceans, 1985, 90(C3): 4833−4846. doi: 10.1029/JC090iC03p04833 [7] Curry R, Mauritzen C. Dilution of the northern North Atlantic Ocean in recent decades[J]. Science, 2005, 308(5729): 1772−1774. doi: 10.1126/science.1109477 [8] Proshutinsky A, Krishfield R, Toole J M, et al. Analysis of the Beaufort Gyre freshwater content in 2003–2018[J]. Journal of Geophysical Research: Oceans, 2019, 124(12): 9658−9689. doi: 10.1029/2019JC015281 [9] Proshutinsky A, Krishfield R, Timmermans M L, et al. Beaufort Gyre freshwater reservoir: State and variability from observations[J]. Journal of Geophysical Research: Oceans, 2009, 114(C1): C00A10. [10] Zhao Mengnan, Timmermans M L, Cole S, et al. Evolution of the eddy field in the Arctic Ocean's Canada Basin, 2005–2015[J]. Geophysical Research Letters, 2016, 43(15): 8106−8114. doi: 10.1002/2016GL069671 [11] Armitage T W K, Manucharyan G E, Petty A A, et al. Enhanced eddy activity in the Beaufort Gyre in response to sea ice loss[J]. Nature Communications, 2020, 11(1): 1−8. doi: 10.1038/s41467-020-14449-z [12] Zhang Jinlun, Steele M, Runciman K, et al. The Beaufort Gyre intensification and stabilization: A model-observation synthesis[J]. Journal of Geophysical Research: Oceans, 2016, 121(11): 7933−7952. doi: 10.1002/2016JC012196 [13] Giles K A, Laxon S W, Ridout A L, et al. Western Arctic Ocean freshwater storage increased by wind-driven spin-up of the Beaufort Gyre[J]. Nature Geoscience, 2012, 5(3): 194−197. doi: 10.1038/ngeo1379 [14] Armitage T W K, Bacon S, Ridout A L, et al. Arctic Ocean surface geostrophic circulation 2003−2014[J]. The Cryosphere, 2017, 11(4): 1767−1780. doi: 10.5194/tc-11-1767-2017 [15] Zhong Wenli, Steele M, Zhang Jinlun, et al. Greater role of geostrophic currents in Ekman dynamics in the western Arctic Ocean as a mechanism for Beaufort Gyre stabilization[J]. Journal of Geophysical Research: Oceans, 2018, 123(1): 149−165. doi: 10.1002/2017JC013282 [16] Xie Jiping, Bertino L, Counillon F, et al. Quality assessment of the TOPAZ4 reanalysis in the Arctic over the period 1991−2013[J]. Ocean Science, 2017, 13(1): 123−144. doi: 10.5194/os-13-123-2017 [17] Kelly S J, Proshutinsky A, Popova E K, et al. On the origin of water masses in the Beaufort Gyre[J]. Journal of Geophysical Research: Oceans, 2019, 124(7): 4696−4709. doi: 10.1029/2019JC015022 [18] Regan H C, Lique C, Armitage T W K. The Beaufort Gyre extent, shape, and location between 2003 and 2014 from satellite observations[J]. Journal of Geophysical Research: Oceans, 2019, 124(2): 844−862. doi: 10.1029/2018JC014379 [19] Yang Jiayan. Seasonal and interannual variability of downwelling in the Beaufort Sea[J]. Journal of Geophysical Research: Oceans, 2009, 114(C1): C00A14. [20] Hakkinen S, Proshutinsky A, Ashik I. Sea ice drift in the Arctic since the 1950s[J]. Geophysical Research Letters, 2008, 35(19): L19704. doi: 10.1029/2008GL034791 [21] Spreen G, Kwok R, Menemenlis D. Trends in Arctic sea ice drift and role of wind forcing: 1992–2009[J]. Geophysical Research Letters, 2011, 38(19): L19501. [22] Martin T, Steele M, Zhang Jinlun. Seasonality and long-term trend of Arctic Ocean surface stress in a model[J]. Journal of Geophysical Research: Oceans, 2014, 119(3): 1723−1738. doi: 10.1002/2013JC009425 [23] Serreze M C, Barrett A P. Characteristics of the Beaufort Sea high[J]. Journal of Climate, 2011, 24(1): 159−182. doi: 10.1175/2010JCLI3636.1 [24] Moore G W K. Decadal variability and a recent amplification of the summer Beaufort Sea High[J]. Geophysical Research Letters, 2012, 39(10): L10807. [25] Proshutinsky A, Bourke R H, McLaughlin F A. The role of the Beaufort Gyre in Arctic climate variability: Seasonal to decadal climate scales[J]. Geophysical Research Letters, 2002, 29(23): 15-1−15-4. doi: 10.1029/2002GL015847 [26] Proshutinsky A, Dukhovskoy D, Timmermans M L, et al. Arctic circulation regimes[J]. Philosophical Transactions of the Royal Society A: Mathematical, Physical and Engineering Sciences, 2015, 373(2052): 20140160. doi: 10.1098/rsta.2014.0160 [27] Wu Bingyi, Johnson M A. A seesaw structure in SLP anomalies between the Beaufort Sea and the Barents Sea[J]. Geophysical Research Letters, 2007, 34(5): L05811. [28] Doddridge E W, Meneghello G, Marshall J, et al. A three-way balance in the Beaufort Gyre: The Ice-Ocean Governor, wind stress, and eddy diffusivity[J]. Journal of Geophysical Research: Oceans, 2019, 124(5): 3107−3124. doi: 10.1029/2018JC014897 [29] Karcher M, Smith J N, Kauker F, et al. Recent changes in Arctic Ocean circulation revealed by iodine-129 observations and modeling[J]. Journal of Geophysical Research: Oceans, 2012, 117(C8): C08007. [30] Davis P E D, Lique C, Johnson H L. On the link between Arctic sea ice decline and the freshwater content of the Beaufort Gyre: Insights from a simple process model[J]. Journal of Climate, 2014, 27(21): 8170−8184. doi: 10.1175/JCLI-D-14-00090.1 [31] Meneghello G, Marshall J, Campin J M, et al. The ice-ocean governor: Ice-ocean stress feedback limits Beaufort Gyre spin-up[J]. Geophysical Research Letters, 2018, 45(20): 11293−11299. [32] Timmermans M L, Marshall J. Understanding Arctic Ocean circulation: A review of ocean dynamics in a changing climate[J]. Journal of Geophysical Research: Oceans, 2020, 125(4): e2018JC014378. [33] Meier W N, Fetterer F, Savoie S, et al. NOAA/NSIDC climate data record of passive microwave sea ice concentration, Version 3[R]. Boulder, Colorado USA: National Snow and Ice Data Center, 2017. [34] Carton J A, Chepurin G A, Chen Ligang. SODA3: A new ocean climate reanalysis[J]. Journal of Climate, 2018, 31(17): 6967−6983. doi: 10.1175/JCLI-D-18-0149.1 [35] Kalnay E, Kanamitsu M, Kistler R, et al. The NCEP/NCAR 40-year reanalysis project[J]. Bulletin of the American Meteorological Society, 1996, 77(3): 437−472. doi: 10.1175/1520-0477(1996)077<0437:TNYRP>2.0.CO;2 [36] Armitage T W K, Bacon S, Ridout A L, et al. Arctic sea surface height variability and change from satellite radar altimetry and GRACE, 2003–2014[J]. Journal of Geophysical Research: Oceans, 2016, 121(6): 4303−4322. doi: 10.1002/2015JC011579 [37] Proshutinsky A Y, Johnson M A. Two circulation regimes of the wind-driven Arctic Ocean[J]. Journal of Geophysical Research: Oceans, 1997, 102(C6): 12493−12514. doi: 10.1029/97JC00738 [38] Manucharyan G E, Isachsen P E. Critical role of continental slopes in halocline and eddy dynamics of the Ekman-driven Beaufort Gyre[J]. Journal of Geophysical Research: Oceans, 2019, 124(4): 2679−2696. doi: 10.1029/2018JC014624 [39] Manucharyan G E, Spall M A. Wind-driven freshwater buildup and release in the Beaufort Gyre constrained by mesoscale eddies[J]. Geophysical Research Letters, 2016, 43(1): 273−282. doi: 10.1002/2015GL065957 [40] Dewey S R, Morison J H, Zhang Jinlun. An edge-referenced surface fresh layer in the Beaufort Sea seasonal ice zone[J]. Journal of Physical Oceanography, 2017, 47(5): 1125−1144. doi: 10.1175/JPO-D-16-0158.1 -

 下载:
下载:
计量
- 文章访问数: 219
- HTML全文浏览量: 346
- PDF下载量: 45
- 被引次数: 0
