The characteristics of sea ice and atmospheric factors over the high latitude Arctic region
-
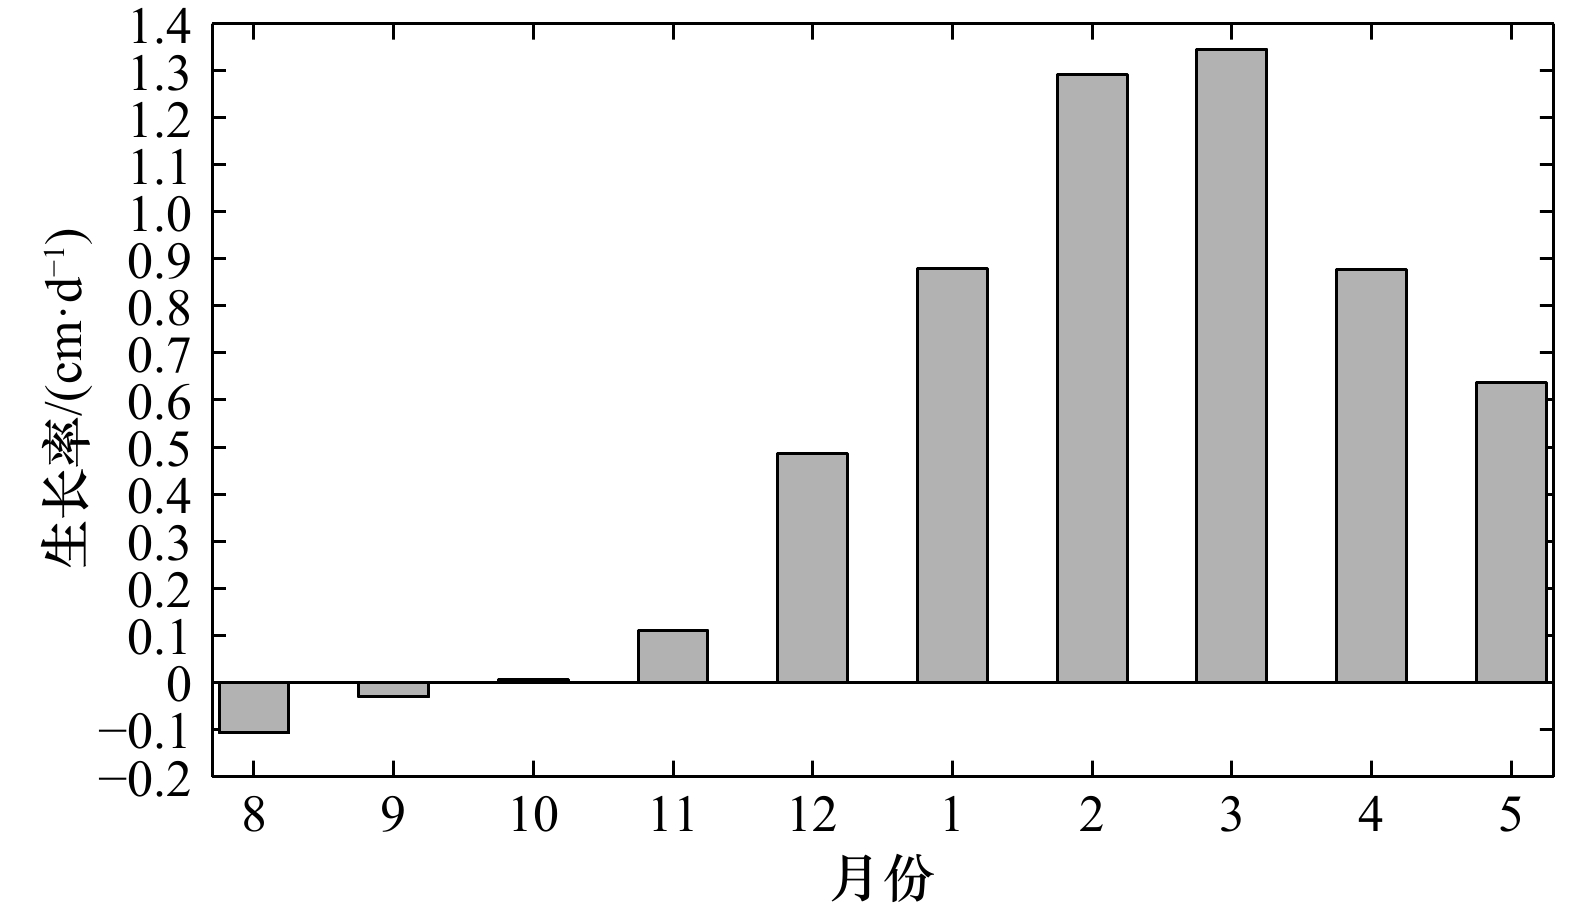
摘要: 基于2018年8月至2019年5月布放在北极随海冰漂流的自动气象站和温度链浮标获取的观测数据,分析了北极高纬度区域的大气特征和海冰生消过程。根据海冰的漂移轨迹分为两个阶段分析,第1阶段,海冰主要向东南漂移;第2阶段,海冰主要向东北漂移。第1阶段观测的平均气温和平均相对湿度分别为–6.6℃和93%,第2阶段观测的平均气温和平均相对湿度分别为–29.3℃和76%,第2阶段平均气压高于第1阶段。海冰的漂移轨迹主要受到波弗特高压外围气流的影响。利用自动气象站漂移轨迹计算得到海冰漂移速度,与美国国家冰雪数据中心海冰漂移速度比较显示,两者纬向速度更为接近。海冰在第1阶段以融化为主,海冰厚度略有减小,8月份海冰生长率为–0.11 cm/d;海冰的生长过程主要发生在第2阶段,1–3月生长率均超过0.9 cm/d,2019年3月海冰生长最快,平均生长率为1.3 cm/d,海冰的增长一直持续至观测结束。Abstract: The evolution of atmospheric factors and sea ice growth of the Arctic high latitude region process are analyzed based on the data observed by the drifting automatic weather station over the period from August 2018 to May 2019. The evolution shows two different phases according to the sea ice drifting trajectory. The sea ice mainly drifted to the southeast in the first phase and drifted to the northeast in the second phase. The averaged air temperature and averaged relative humidity are −6.6℃ and 93% for the first phase and those are −29.3℃ and 76% for the second phase. The averaged pressure is higher in the second than that in the first phase. The sea ice drifting trajectory are mainly affected by the Beaufort High. The sea ice velocity from automatic weather station derived and NSIDC (National Snow and Ice Data Center) are compared and the result show that the zonal velocity is unanimous. The sea ice is mainly melting in the first and sea ice thickness show decrease in the first phase. The sea ice growth rate is −0.11 cm/d in August. The sea ice growth mainly occurs in the second phase. The sea ice growth rate is larger than 0.9 cm/d from January to March 2019. The largest monthly averaged sea ice growth rate is in March with the value of 1.1 cm/d and the sea ice keep growth until the end of the observation period.
-
Key words:
- sea ice growth /
- sea ice velocity /
- Beaufort High /
- drifting automatic weather station
-
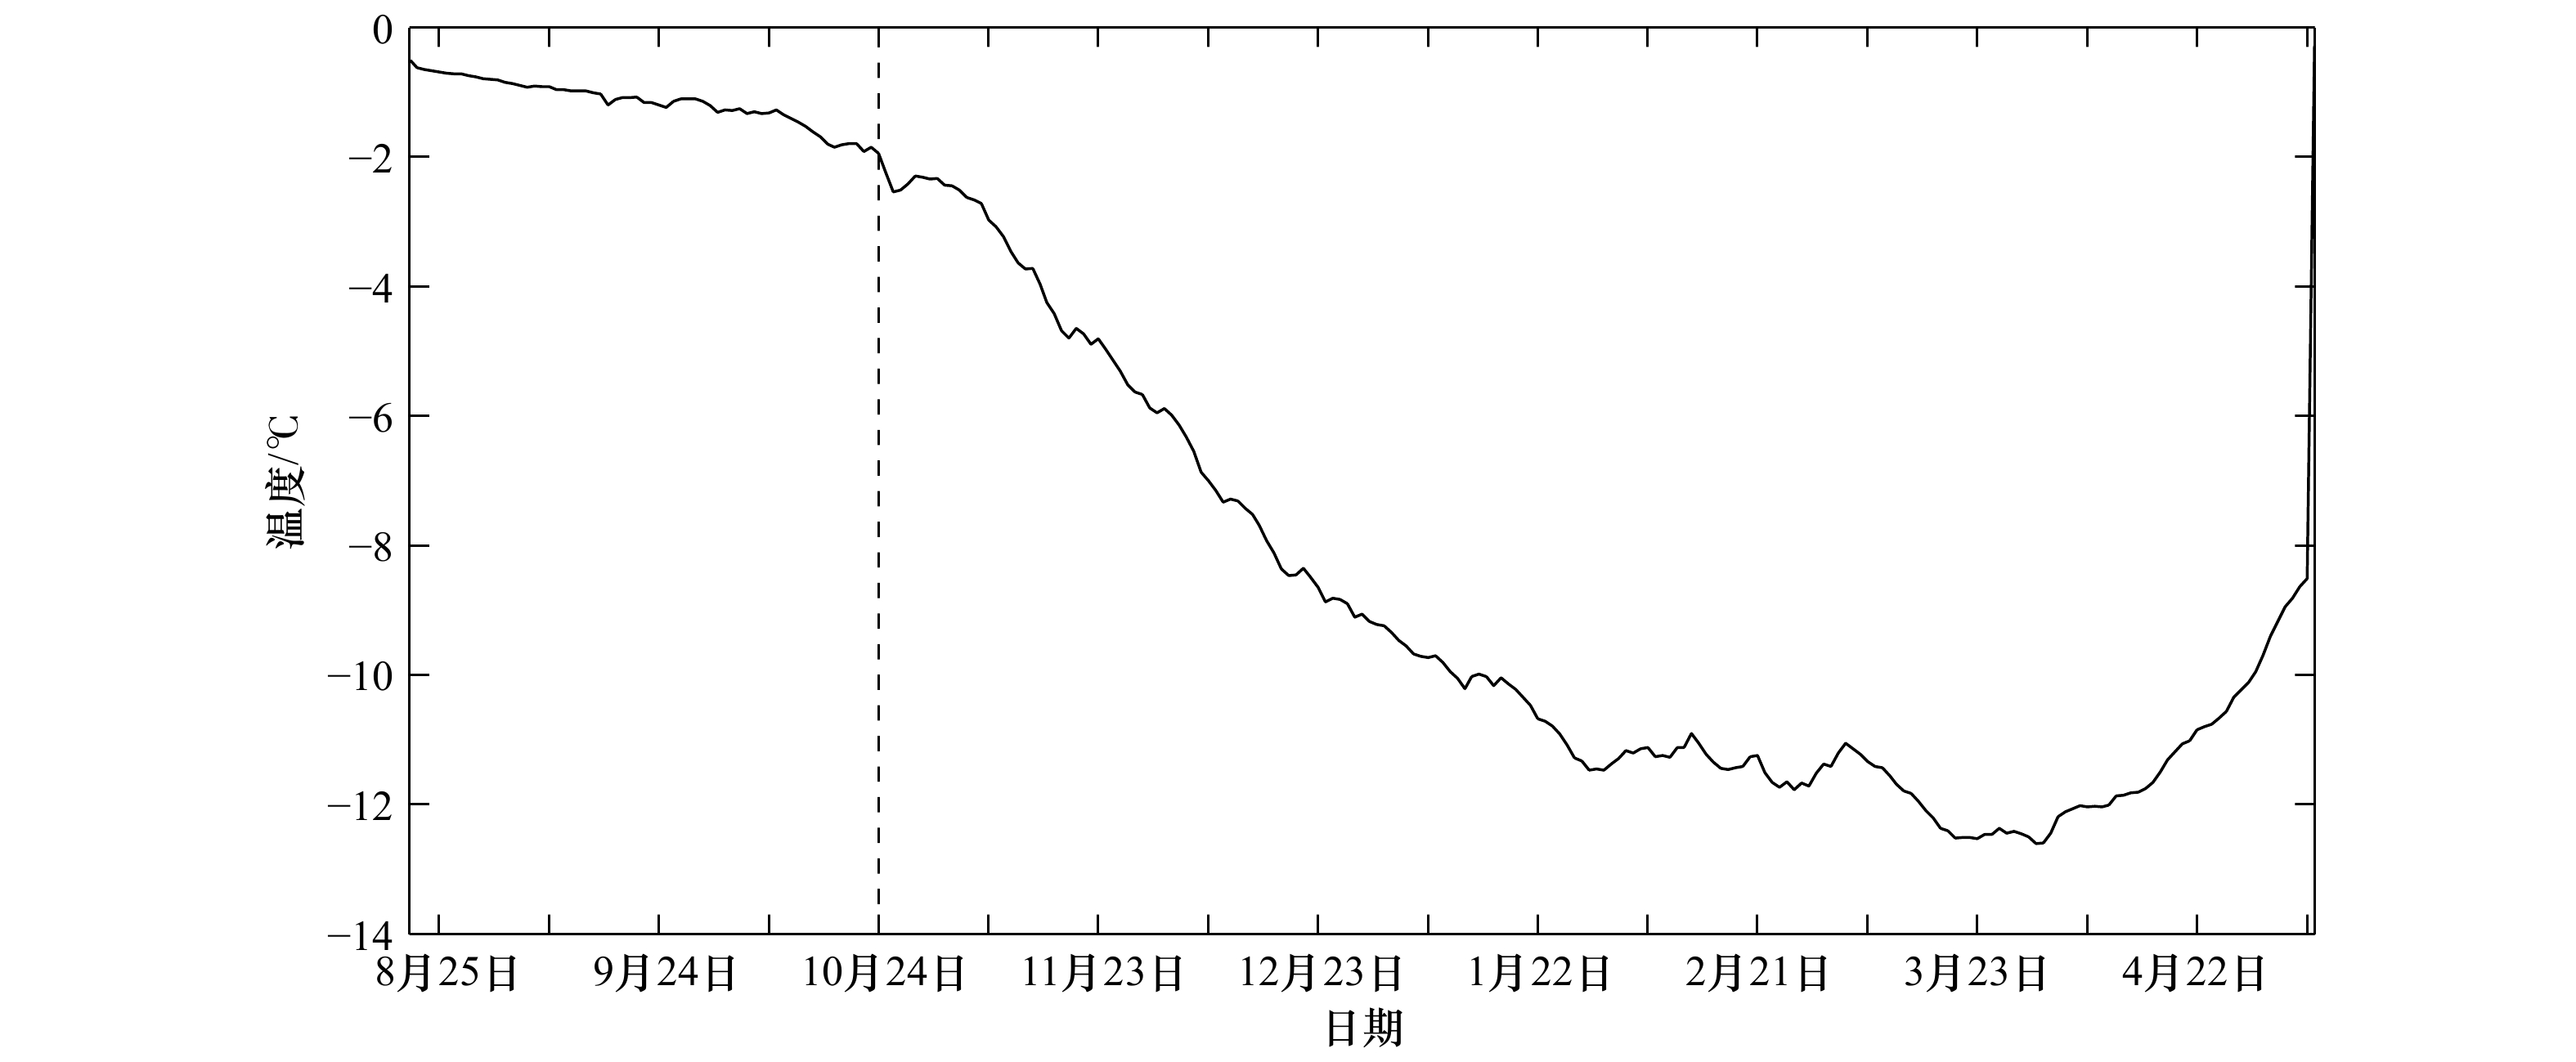
图 2 2018 年8 月21 日至2019 年5 月8 日日平均的气压(a),风速(b),相对湿度(c)和气温(d) 时间序列
垂直黑虚线为10 月24 日,a中AWS表示自动气象站观测的气压,b−d中AWS 2 m和AWS 4 m分别表示自动气象站在2 m和4 m高度观测的量,ERA-I表示来自ERA-Interim
Fig. 2 Time series of daily averaged pressure (a), wind speed (b), relative humidity (c) and air temperature (d) over the period from August 21, 2018 to May 8, 2019
The vertical dotted line indicats the October 24 for the different phase. AWS indicates the AWS observed pressure in a. AWS 2 m and AWS 4 m in b−d indicate the observation at height of 2 m and 4 m. ERA-I indicates the data from ERA-Interim
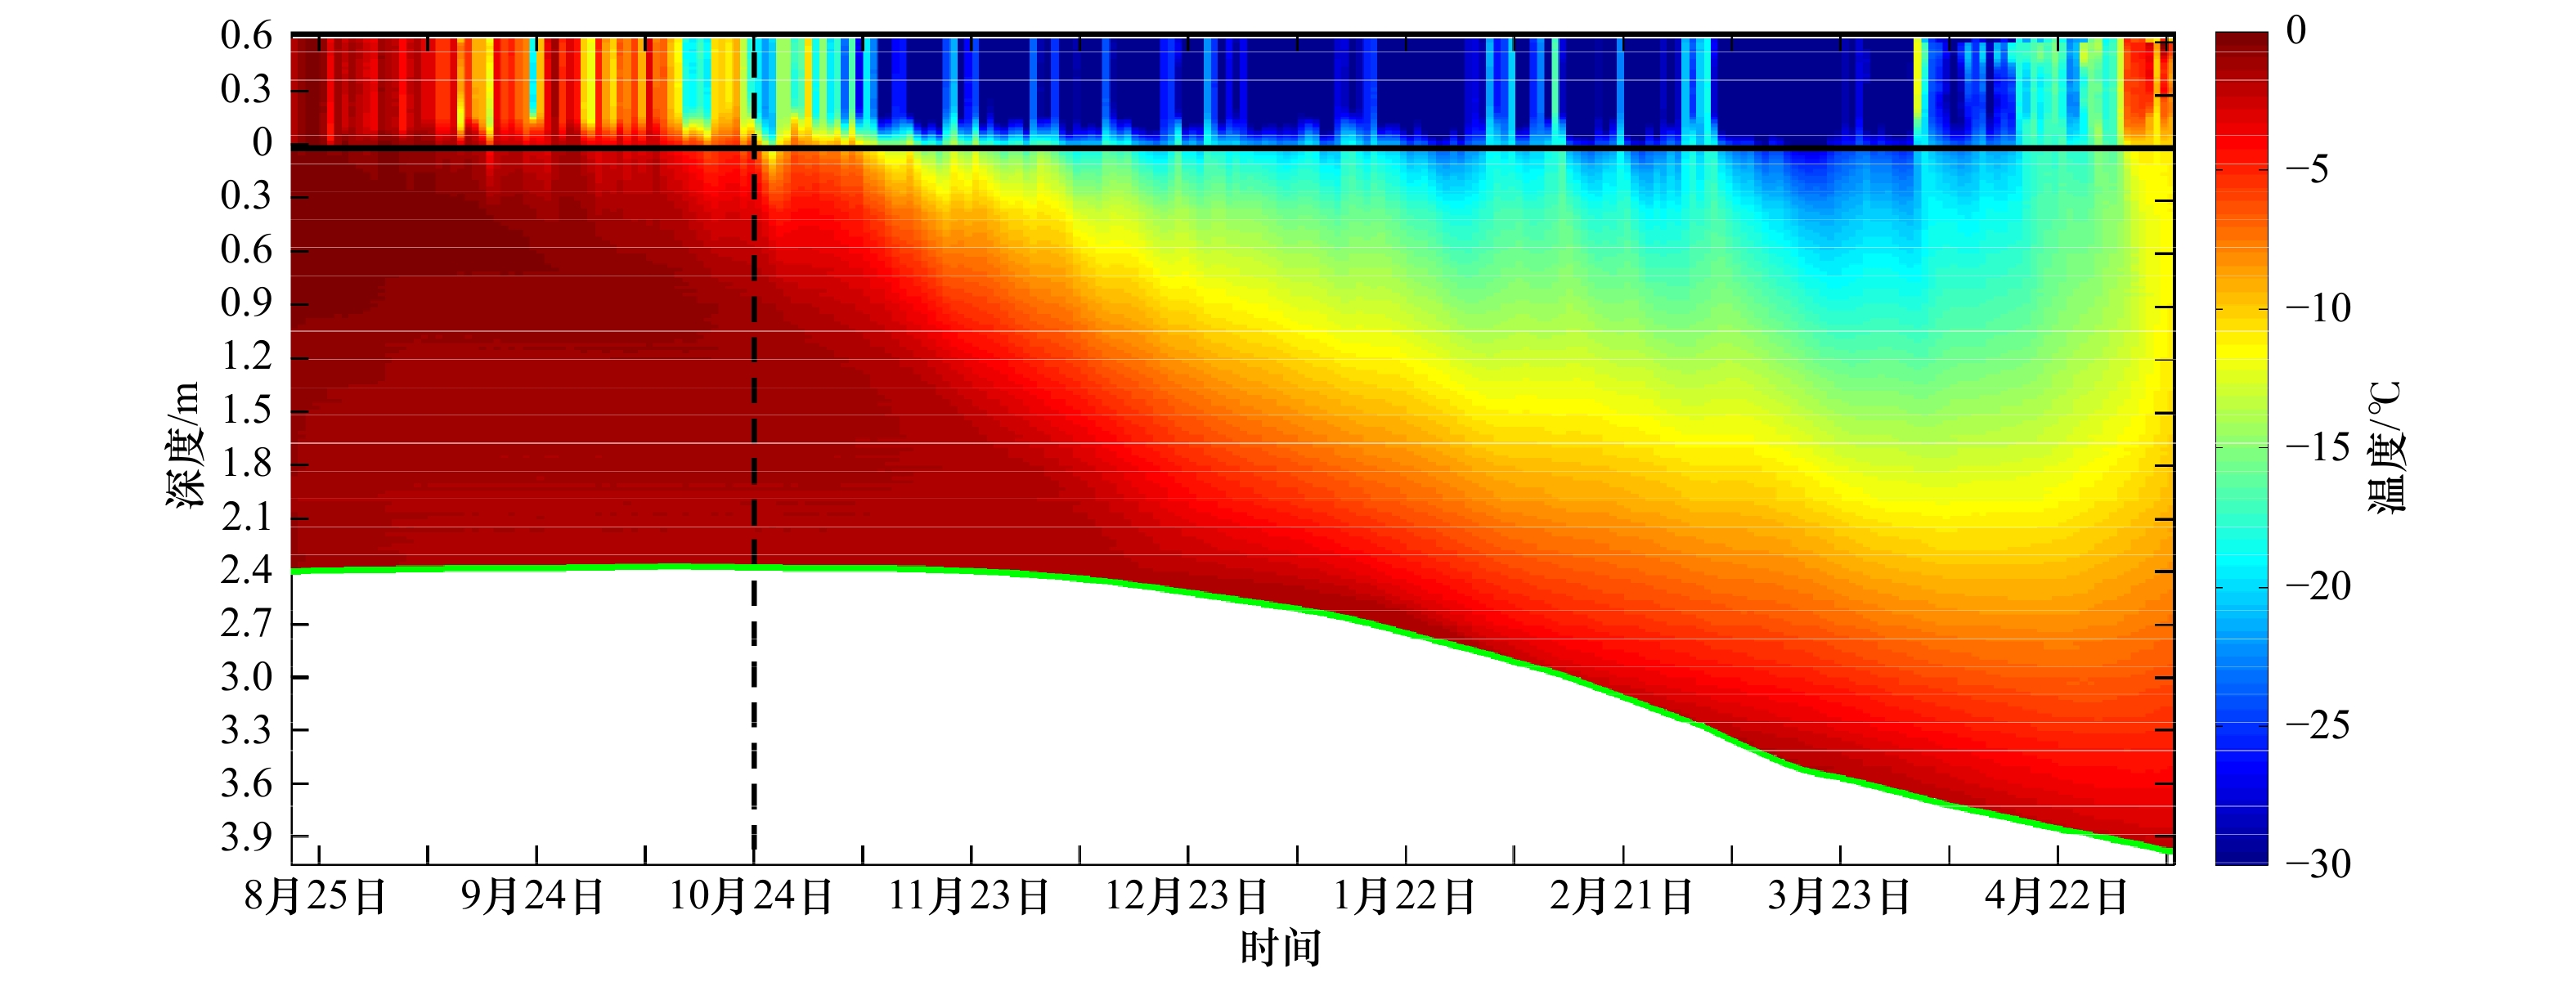
图 6 2018年8月21日至2019年5月8日SIMBA温度链浮标观测的自上而下大气–海冰温度剖面随时间的变化
黑线为海冰上界面,绿线为冰水界面,垂直黑虚线为10月24日
Fig. 6 Temperature evolution for the surface air-ice system from the SIMBA buoy observations over the period from August 21, 2018 to May 8, 2019
The black and green lines represent the initial sea ice upper surface and the ice-sea interface, respectively. The vertical dotted line indicats the October 24 for the different phase
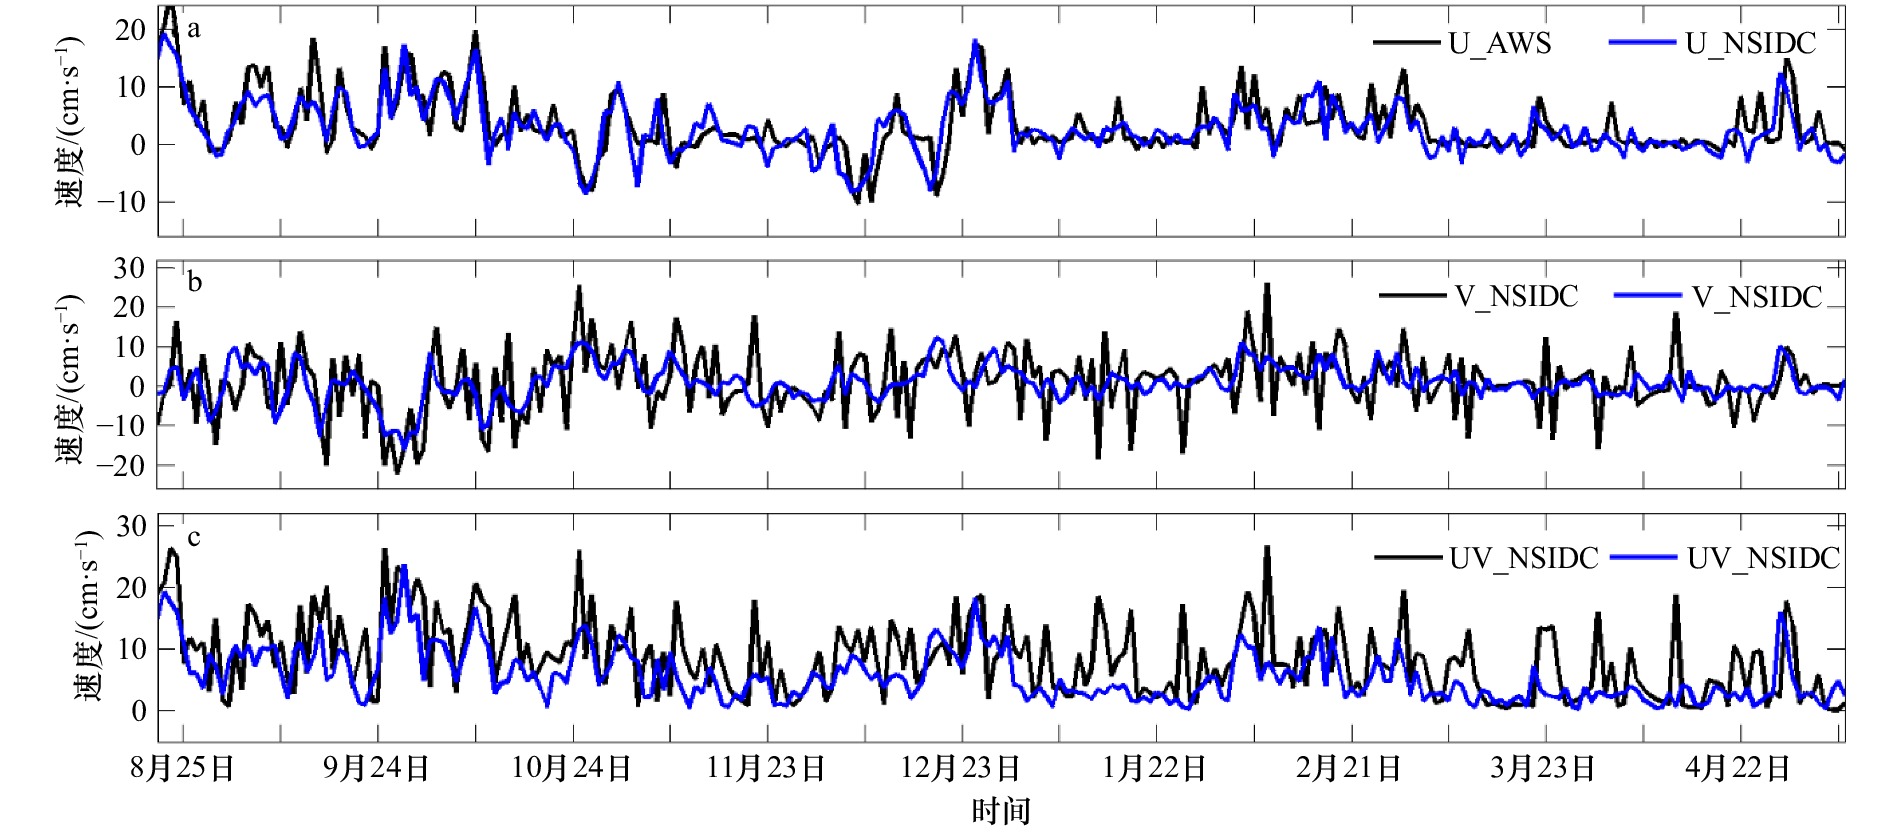
图 5 2018 年 8 月 21 日至 2019 年 5 月 8 日基于自动气象站轨迹计算(黑线)和 NSIDC(蓝线)日平均的纬向海冰漂移速度 (a),经向海冰漂移速度(b)和合成海冰漂移速度时间序列(c)
U_AWS、V_AWS和UV_AWS分别表示基于自动气象站轨迹计算的纬向、经向和合成海冰漂移速度。U_NSIDC、V_NSIDC和UV_NSIDC分别表示来自NSIDC海的纬向、经向和合成海冰漂移速度
Fig. 5 Time series of daily averaged zonal sea ice drift velocity (a), meridional sea ice drift velocity (b) and the sea ice drift velocity (d) for automatic meteorological station derived (black) and NISDC (blue) over the period from August 21, 2018 to May 8, 2019
U_AWS, V_AWS and UV_AWS indicate the zonal, meridional and synthesis sea ice drift velocity based on AWS, respectively. U_NSIDC, V_NSIDC and UV_NSIDC indicate the zonal, meridional and synthesis sea ice drift velocity from NSIDC, respectively
表 1 自动气象站传感器参数
Tab. 1 The type and key technical specifications of sensors for the drifting automatic meteorological station
要素 型号 测量范围 精度 气温 Vaisala HMP155 –90~60℃ ±0.1℃ 相对湿度 Vaisala HMP155 0~100% 3% 风速 XFY3-1 1.0~95.0 m/s 0~10 m/s时,≤±0.5 m/s;10~95 m/s时,≤±0.5% 标准风速 风向 XFY3-1 0°~360° ±3° 气压 Vaisala CS106 600~1 100 hPa 0.1 hPa 辐射 Li200x-135 400~1 100 nm 0.2 kW/(m2·mV) 数据采集器 CR1000-XT –55~60℃ – -
[1] Guemas V, Blanchard-Wrigglesworth E, Chevallier M, et al. A review on Arctic sea-ice predictability and prediction on seasonal to decadal time-scales[J]. Quarterly Journal of the Royal Meteorological Society, 2016, 142(695): 546−561. doi: 10.1002/qj.2401 [2] Olsen M S, Callaghan T V, Reist J D, et al. The changing Arctic cryosphere and likely consequences: An overview[J]. Ambio, 2011, 40(S1): 111−118. doi: 10.1007/s13280-011-0220-y [3] Bekryaev R V, Polyakov I V, Alexeev V A. Role of polar amplification in long-term surface air temperature variations and modern Arctic warming[J]. Journal of Climate, 2010, 23(14): 3888−3906. doi: 10.1175/2010JCLI3297.1 [4] Screen J A, Simmonds I. The central role of diminishing sea ice in recent Arctic temperature amplification[J]. Nature, 2010, 464(7293): 1334−1337. doi: 10.1038/nature09051 [5] Serreze M C, Barry R G. Processes and impacts of Arctic amplification: A research synthesis[J]. Global and Planetary Change, 2011, 77(1/2): 85−96. [6] Comiso J C, Meier W N, Gersten R. Variability and trends in the Arctic sea ice cover: Results from different techniques[J]. Journal of Geophysical Research: Oceans, 2017, 122(8): 6883−6900. doi: 10.1002/2017JC012768 [7] Lee H J, Kwon M O, Yeh S W, et al. Impact of poleward moisture transport from the North Pacific on the acceleration of sea ice loss in the Arctic since 2002[J]. Journal of Climate, 2017, 30(17): 6757−6769. doi: 10.1175/JCLI-D-16-0461.1 [8] Kinnard C, Zdanowicz C M, Fisher D A, et al. Reconstructed changes in Arctic sea ice over the past 1450 years[J]. Nature, 2011, 479(7374): 509−512. doi: 10.1038/nature10581 [9] Comiso J C. Large decadal decline of the Arctic multiyear ice cover[J]. Journal of Climate, 2012, 25(4): 1176−1193. doi: 10.1175/JCLI-D-11-00113.1 [10] Comiso J C, Hall D K. Climate trends in the Arctic as observed from space[J]. Wiley Interdisciplinary Reviews: Climate Change, 2014, 5(3): 389−409. doi: 10.1002/wcc.277 [11] 李珵, 苏洁, 魏立新, 等. 北极中央区海冰低密集度现象研究[J]. 海洋学报, 2018, 40(11): 33−45.Li Cheng, Su Jie, Wei Lixin, et al. Exploration of anomalous low sea ice concentration phenomenon in the Central Arctic[J]. Haiyang Xuebao, 2018, 40(11): 33−45. [12] 卞林根, 高志球, 陆龙骅, 等. 北冰洋夏季开阔洋面和浮冰近地层热量平衡参数的观测估算[J]. 中国科学(D辑: 地球科学), 2003, 46(6): 580−591. doi: 10.1007/BF02984536Bian Lingen, Gao Zhiqiu, Lu Longhua, et al. Observational estimation of heat budgets on drifting ice and open water over the Arctic Ocean[J]. Science in China Series D: Earth Sciences, 2003, 46(6): 580−591. doi: 10.1007/BF02984536 [13] 王杰, 郭井学, 王华军, 等. 中国第四次北极科学考察EM31-ICE走航海冰厚度数据分析[J]. 极地研究, 2012, 24(1): 47−52.Wang Jie, Guo Jingxue, Wang Huajun, et al. Data analysis of shipborne EM31-ICE measuring in the fourth Chinese national Arctic research expedition[J]. Chinese Journal of Polar Research, 2012, 24(1): 47−52. [14] 郝光华, 赵杰臣, 李春花, 等. 2017年夏季北极中央航道海冰观测特征及海冰密集度遥感产品评估[J]. 海洋学报, 2018, 40(11): 54−63.Hao Guanghua, Zhao Jiechen, Li Chunhua, et al. The sea ice observations and assessment of satellite sea-ice concentration along the central Arctic passage in summer 2017[J]. Haiyang Xuebao, 2018, 40(11): 54−63. [15] Perovich D K, Polashenski C. Albedo evolution of seasonal Arctic sea ice[J]. Geophysical Research Letters, 2012, 39(8): 8501. doi: 10.1029/2012GL051432 [16] Perovich D K, Jones K F, Light B, et al. Solar partitioning in a changing Arctic sea-ice cover[J]. Annals of Glaciology, 2011, 52(57): 192−196. doi: 10.3189/172756411795931543 [17] 卞林根, 丁明虎, 林祥, 等. 北冰洋中心区夏季大气边界层结构特征及其与海冰范围变化的关系[J]. 中国科学: 地球科学, 2016, 59(5): 1057−1065. doi: 10.1007/s11430-015-5238-8Bian Lingen, Ding Minghu, Lin Xiang, et al. Structure of summer atmospheric boundary layer in the center of Arctic Ocean and its relation with sea ice extent change[J]. Science China Earth Sciences, 2016, 59(5): 1057−1065. doi: 10.1007/s11430-015-5238-8 [18] Taskjelle T, Hudson S R, Granskog M A, et al. Spectral albedo and transmittance of thin young Arctic sea ice[J]. Journal of Geophysical Research: Oceans, 2016, 121(1): 540−553. doi: 10.1002/2015JC011254 [19] Hao Guanghua, Su Jie, Vihma T, et al. Trends, abrupt shifts and interannual variability of the Arctic wintertime seasonal sea ice from 1979 to 2019[J]. Annals of Glaciology, 2020, 61(83): 441−453. [20] Zhang Jinlun, Lindsay R, Schweiger A, et al. The impact of an intense summer cyclone on 2012 Arctic sea ice retreat[J]. Geophysical Research Letters, 2013, 40(4): 720−726. doi: 10.1002/grl.50190 [21] Stroeve J C, Kattsov V, Barrett A, et al. Trends in Arctic sea ice extent from CMIP5, CMIP3 and observations[J]. Geophysical Research Letters, 2012, 39(16): 28. doi: 10.1029/2012GL052676 [22] Long Mengyuan, Zhang Lujun, Hu Siyu, et al. Multi-aspect Assessment of CMIP6 models for Arctic sea ice simulation[J]. Journal of Climate, 2020, 34(4): 1−37. [23] Kern S, Khvorostovsky K, Skourup H, et al. The impact of snow depth, snow density and ice density on sea ice thickness retrieval from satellite radar altimetry: Results from the ESA-CCI Sea Ice ECV Project Round Robin Exercise[J]. The Cryosphere, 2015, 9(1): 37−52. doi: 10.5194/tc-9-37-2015 [24] Li Mengmeng, Ke Changqing, Xie Hongjie, et al. Arctic sea ice thickness retrievals from CryoSat-2: seasonal and interannual comparisons of three different products[J]. International Journal of Remote Sensing, 2020, 41(1): 152−170. doi: 10.1080/01431161.2019.1637961 [25] Uttal T, Curry J A, Mcphee M G, et al. Surface heat budget of the Arctic ocean[J]. Bulletin of the American Meteorological Society, 2002, 83(2): 255−276. doi: 10.1175/1520-0477(2002)083<0255:SHBOTA>2.3.CO;2 [26] Dethloff K, Tjernström M, Shupe M, et al. Multidisciplinary drifting Observatory for the Study of Arctic Climate MOSAIC and PARMARCMIP[C]//DFG Arctic Amplification Workshop, DFG. 2013. [27] Wei Zexun, Chen Hongxia, Lei Ruibo, et al. Overview of the 9th Chinese National Arctic research expedition[J]. Atmospheric and Oceanic Science Letters, 2020, 13(1): 1−7. doi: 10.1080/16742834.2020.1675137 [28] Tschudi M A, Meier W N, Stewart J S. An enhancement to sea ice motion and age products at the National Snow and Ice Data Center (NSIDC)[J]. The Cryosphere, 2020, 14(5): 1519−1536. doi: 10.5194/tc-14-1519-2020 [29] Dee D P, Uppala S M, Simmons A J, et al. The ERA-Interim reanalysis: Configuration and performance of the data assimilation system[J]. Quarterly Journal of the Royal Meteorological Society, 2011, 137(656): 553−597. doi: 10.1002/qj.828 [30] 卞林根, 王继志, 孙玉龙, 等. 北冰洋中心区海冰漂流与大气过程[J]. 海洋学报, 2014, 36(10): 48−55.Bian Lingen, Wang Jizhi, Sun Yulong, et al. Sea ice drifting and atmospheric processes over the central Arctic Ocean[J]. Haiyang Xuebao, 2014, 36(10): 48−55. [31] 郝光华, 杨清华, 赵杰臣, 等. 2016年南极中山站固定冰冰厚观测分析[J]. 海洋学报, 2019, 41(9): 26−39.Hao Guanghua, Yang Qinghua, Zhao Jiechen, et al. Observation and analysis of landfast ice arounding Zhongshan Station, Antarctic in 2016[J]. Haiyang Xuebao, 2019, 41(9): 26−39. [32] Xiu Yuanren, Li Zhijun, Lei Ruibo, et al. Comparisons of passive microwave remote sensing sea ice concentrations with ship-based visual observations during the CHINARE Arctic summer cruises of 2010–2018[J]. Acta Oceanologica Sinica, 2020, 39(9): 38−49. doi: 10.1007/s13131-020-1646-5 [33] Lei Ruibo, Li Na, Heil P, et al. Multiyear sea ice thermal regimes and oceanic heat flux derived from an ice mass balance buoy in the Arctic Ocean[J]. Journal of Geophysical Research: Oceans, 2014, 119(1): 537−547. doi: 10.1002/2012JC008731 -


 下载:
下载:


