

Study on the sea ice motion and its influence factors in the northern Nares Strait, Arctic in 2016−2017
-
摘要: 内尔斯海峡位于加拿大埃尔斯米尔岛与格陵兰岛之间,是北极海冰输出的重要通道之一,这些海冰融化后带来的表层淡水对巴芬湾、拉布拉多海的深层水形成具有重要影响。但由于该海峡较为狭窄,缺乏对此区域海冰运动情况的精细研究。本研究利用每日的哨兵1号影像提取了2016年9月至2017年8月的内尔斯海峡北部区域海冰运动信息,展示了海峡中浮冰的运动过程,并结合风速、海流速度等数据分析浮冰运动特征及影响因素。结果表明风和海流二者共同主导了海冰的运动过程,相关系数分别达到了0.767和0.709,由风速、海流速度、海冰密集度3个自变量与浮冰速度建立的多元线性回归模型复决定系数也达到了0.727。进一步分析发现,风和海流在速度相对稳定时对浮冰速度的影响都会减小。本研究关于风和海流等要素对海冰运动过程影响的研究结果,可以为海洋–大气动力学模型的研究提供参考。Abstract: The Nares Strait, located between Ellesmere Island, Canada and Greenland, is one of the important channels for the export of Arctic sea ice. The surface fresh water brought by the melting of these sea ice has a vital impact on the formation of deep water in the Baffin Bay and the Labrador Sea. However, due to its relatively narrow structure, there is no detailed study on the sea ice motion in this area. In this study, the daily Sentinel-1 images were used to extract the information of sea ice motion in the northern region of Nares Strait from September 2016 to August 2017, to show the motion process of ice floes in the strait, and to analyze the characteristics and influencing factors of ice floe motion combined with wind speed, current speed and other data. The results show that wind and current jointly dominate the motion of sea ice, with the correlation coefficients are 0.767 and 0.709, respectively. The multiple linear regression model established by wind speed, current speed and sea ice concentration with ice speed also has the complex determination coefficient reaching 0.727. Further analysis shows that both wind and sea current have relatively less influence on sea ice speed when their speed is relatively stable. The results of this study on the influence of wind and ocean currents on the process of sea ice motion can provide references for the study of ocean-atmospheric dynamics models.
-
Key words:
- Nares Strait /
- sea ice motion /
- Sentinel-1 /
- wind /
- ocean current
-
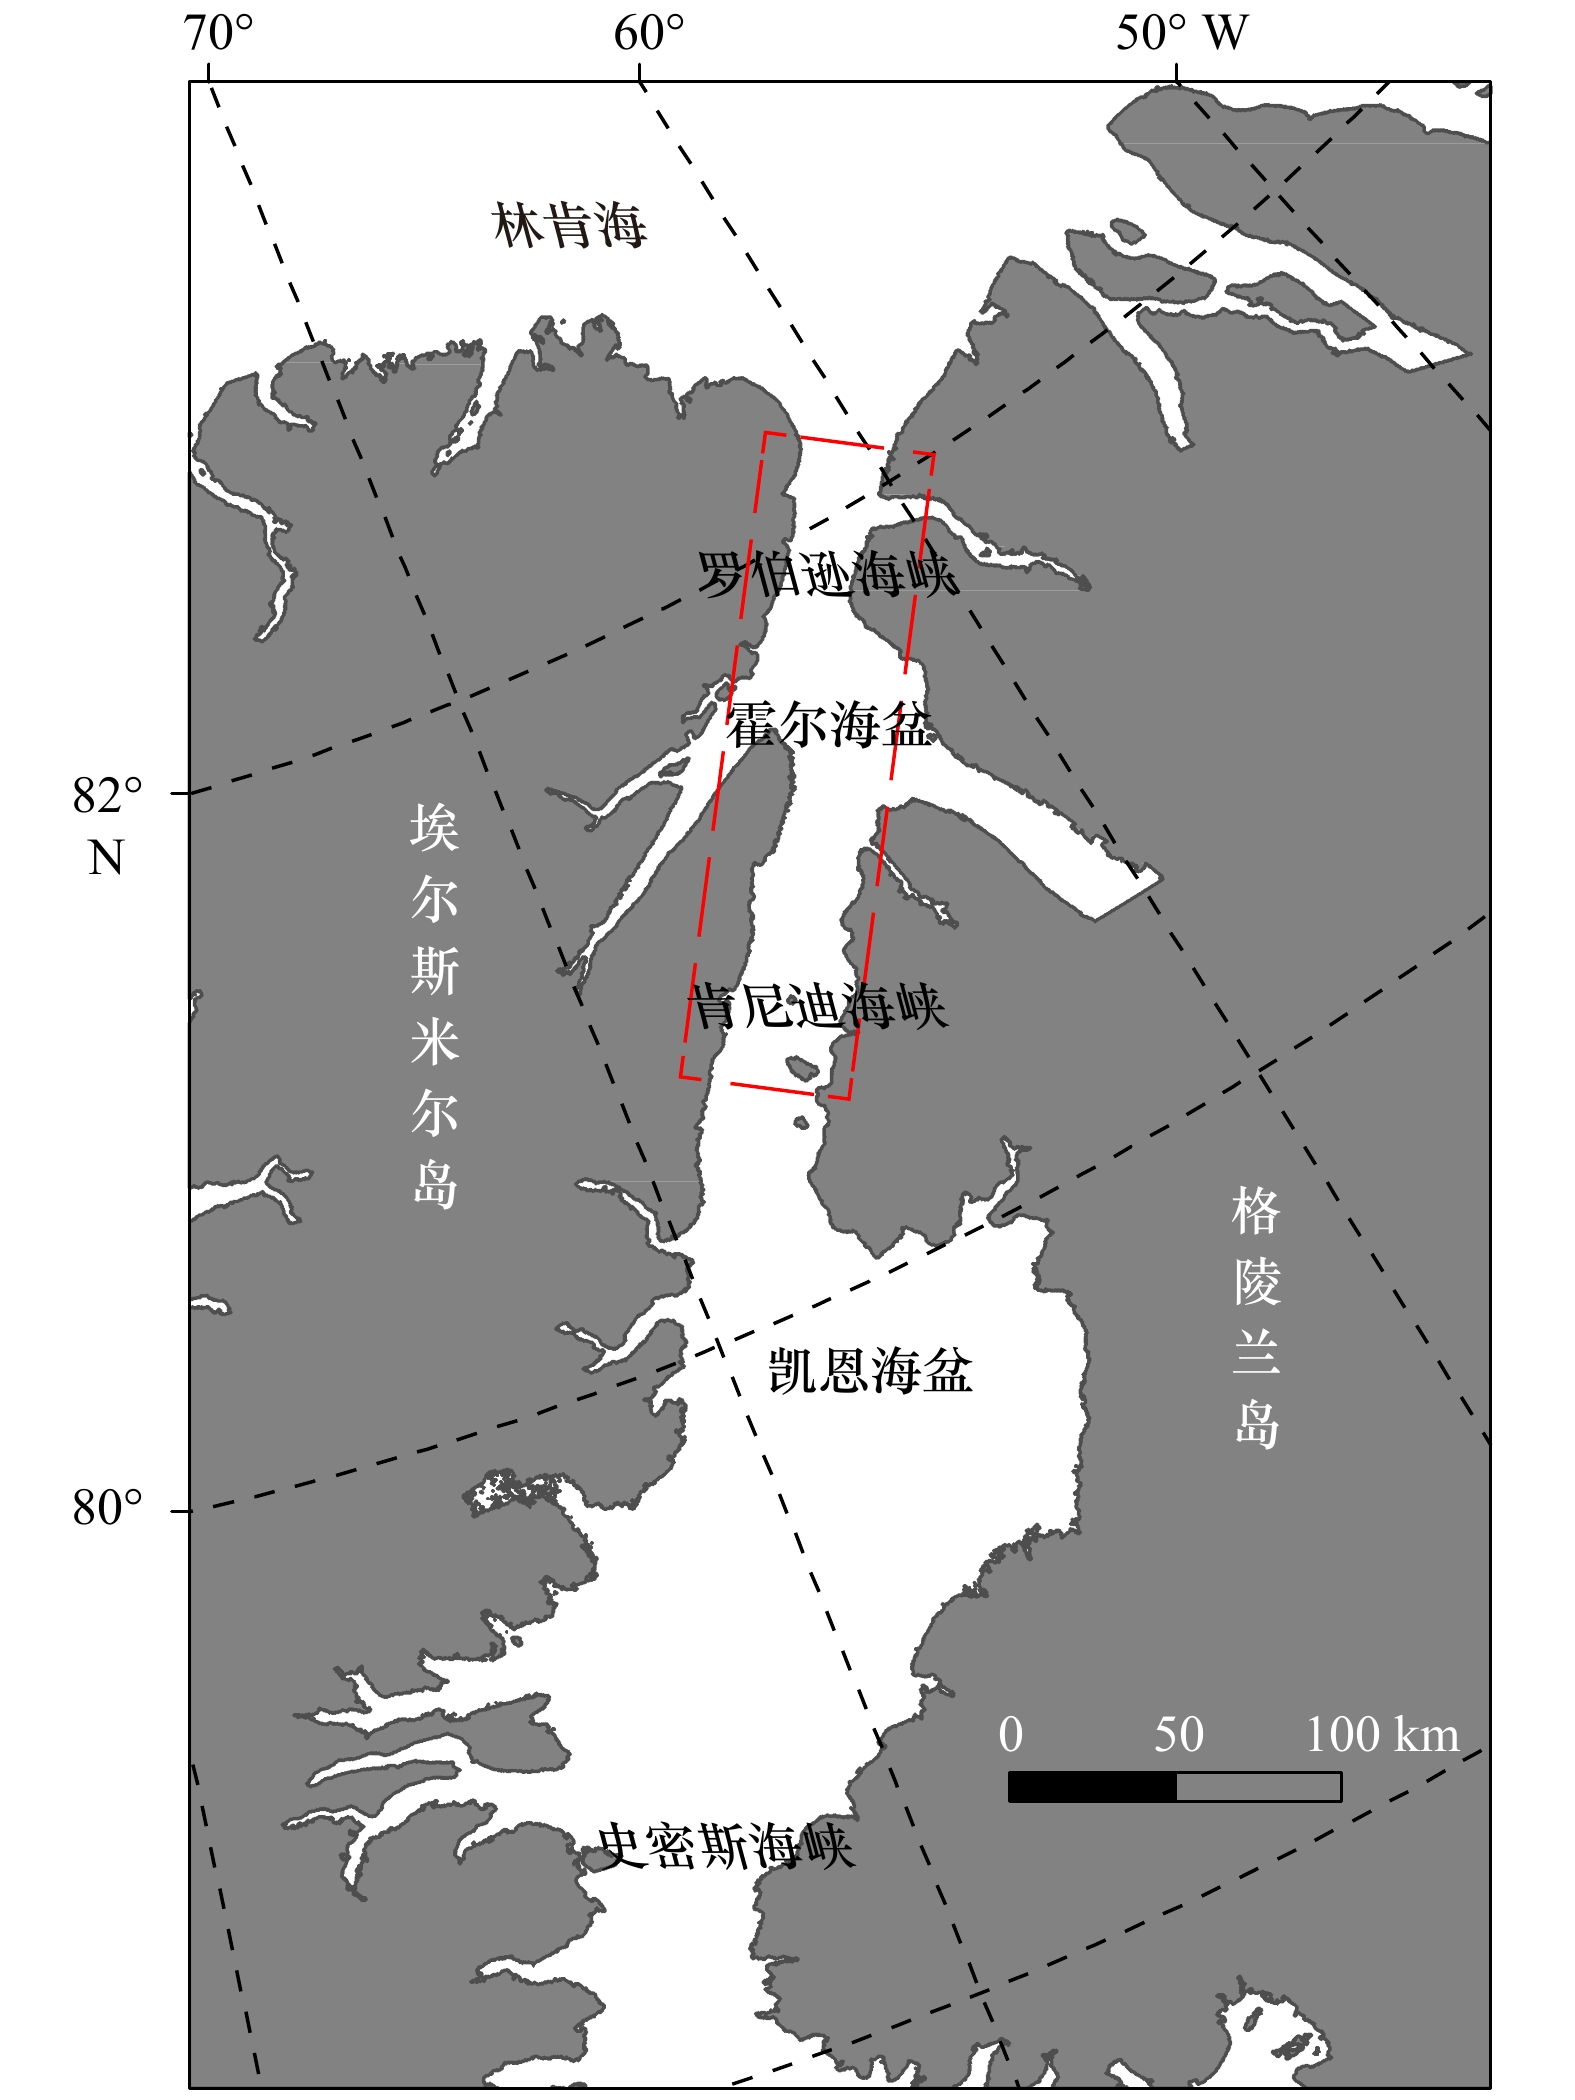
图 1 内尔斯海峡区域示意图(红色虚线框为本文研究区域)
Fig. 1 Map of the Nares Strait (the red dotted box showing the study area)

图 2 从哨兵1号影像中获取海冰运动数据方法示意
红色虚线为相邻两天影像中同一浮冰的轮廓,红点为浮冰几何中心的位置,通过计算两红点之间的距离(黄色箭头)以计算浮冰速度
Fig. 2 Schematic diagram for obtaining sea ice motion data from Sentinel-1 images
The red dotted lines are the outlines of the same ice floe in the successive images. The red dots show the position of geometric center. The ice floe speed is calculated by measuring the distance (the yellow arrow) between two red dots

图 3 不同日期内尔斯海峡北部区域冰况
Fig. 3 Ice regimes in the northern Nares Strait region on different days

图 4 2016年9月22日至2017年5月8日每日多年冰密集度
虚线分别为冰桥初步形成的日期2017年1月23日以及彻底稳定的日期2017年2月2日
Fig. 4 Daily multi-year ice concentration from September 22, 2016 to May 8, 2017
The dash lines show the date of initial formation of the ice bridge on January 23, 2017 and the date of complete stabilization on February 2, 2017, respectively

图 5 10个通过内尔斯海峡北部的浮冰轨迹
Fig. 5 Trajectories of 10 ice floes drifting through the north Nares Strait

图 6 62号浮冰运动轨迹
数字为海冰位置所对应的日期(2017年1月)
Fig. 6 The trajectory of No. 62 ice floe
The numbers indicating the date corresponding to the position of the ice floe (in January 2017)
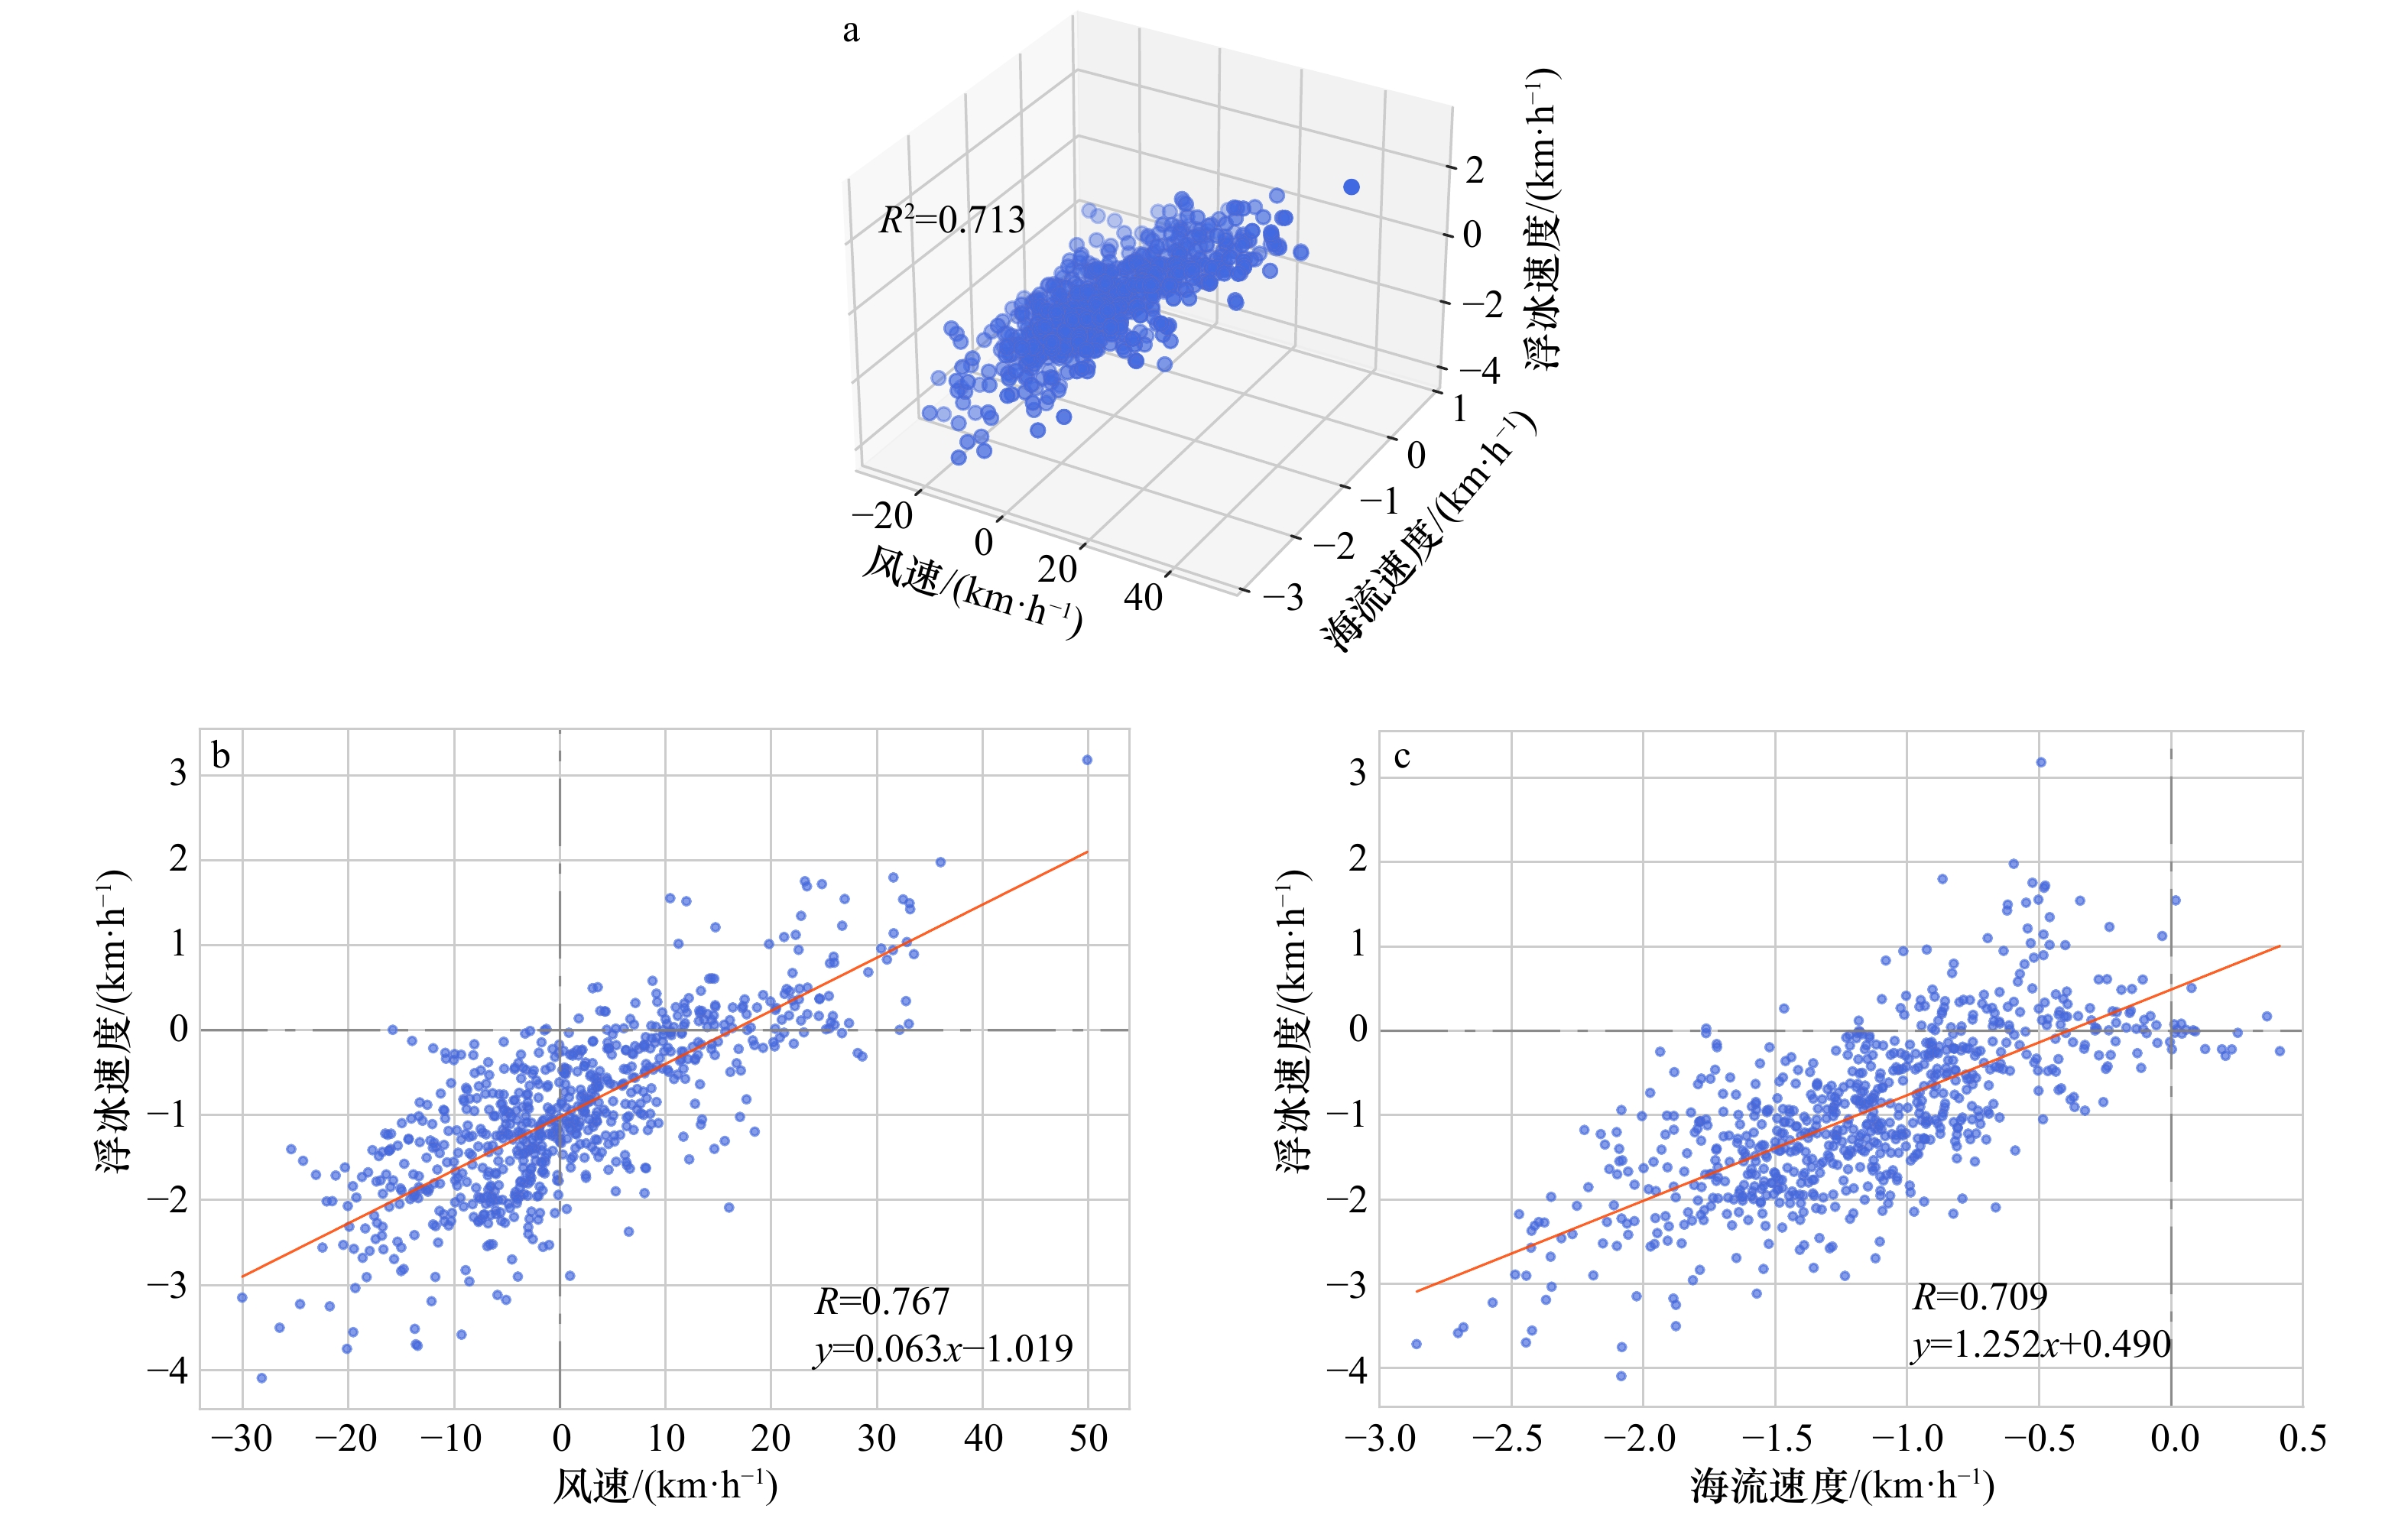
图 7 风速、海流速度与浮冰速度散点图
Fig. 7 Scatter plots of wind speed, current speed and ice floe speed

图 8 不同海冰密集度区间内风速、海流速度与浮冰速度的散点图
Fig. 8 Scatter plots of wind speed, current speed and ice floe speed in different sea ice concentration ranges
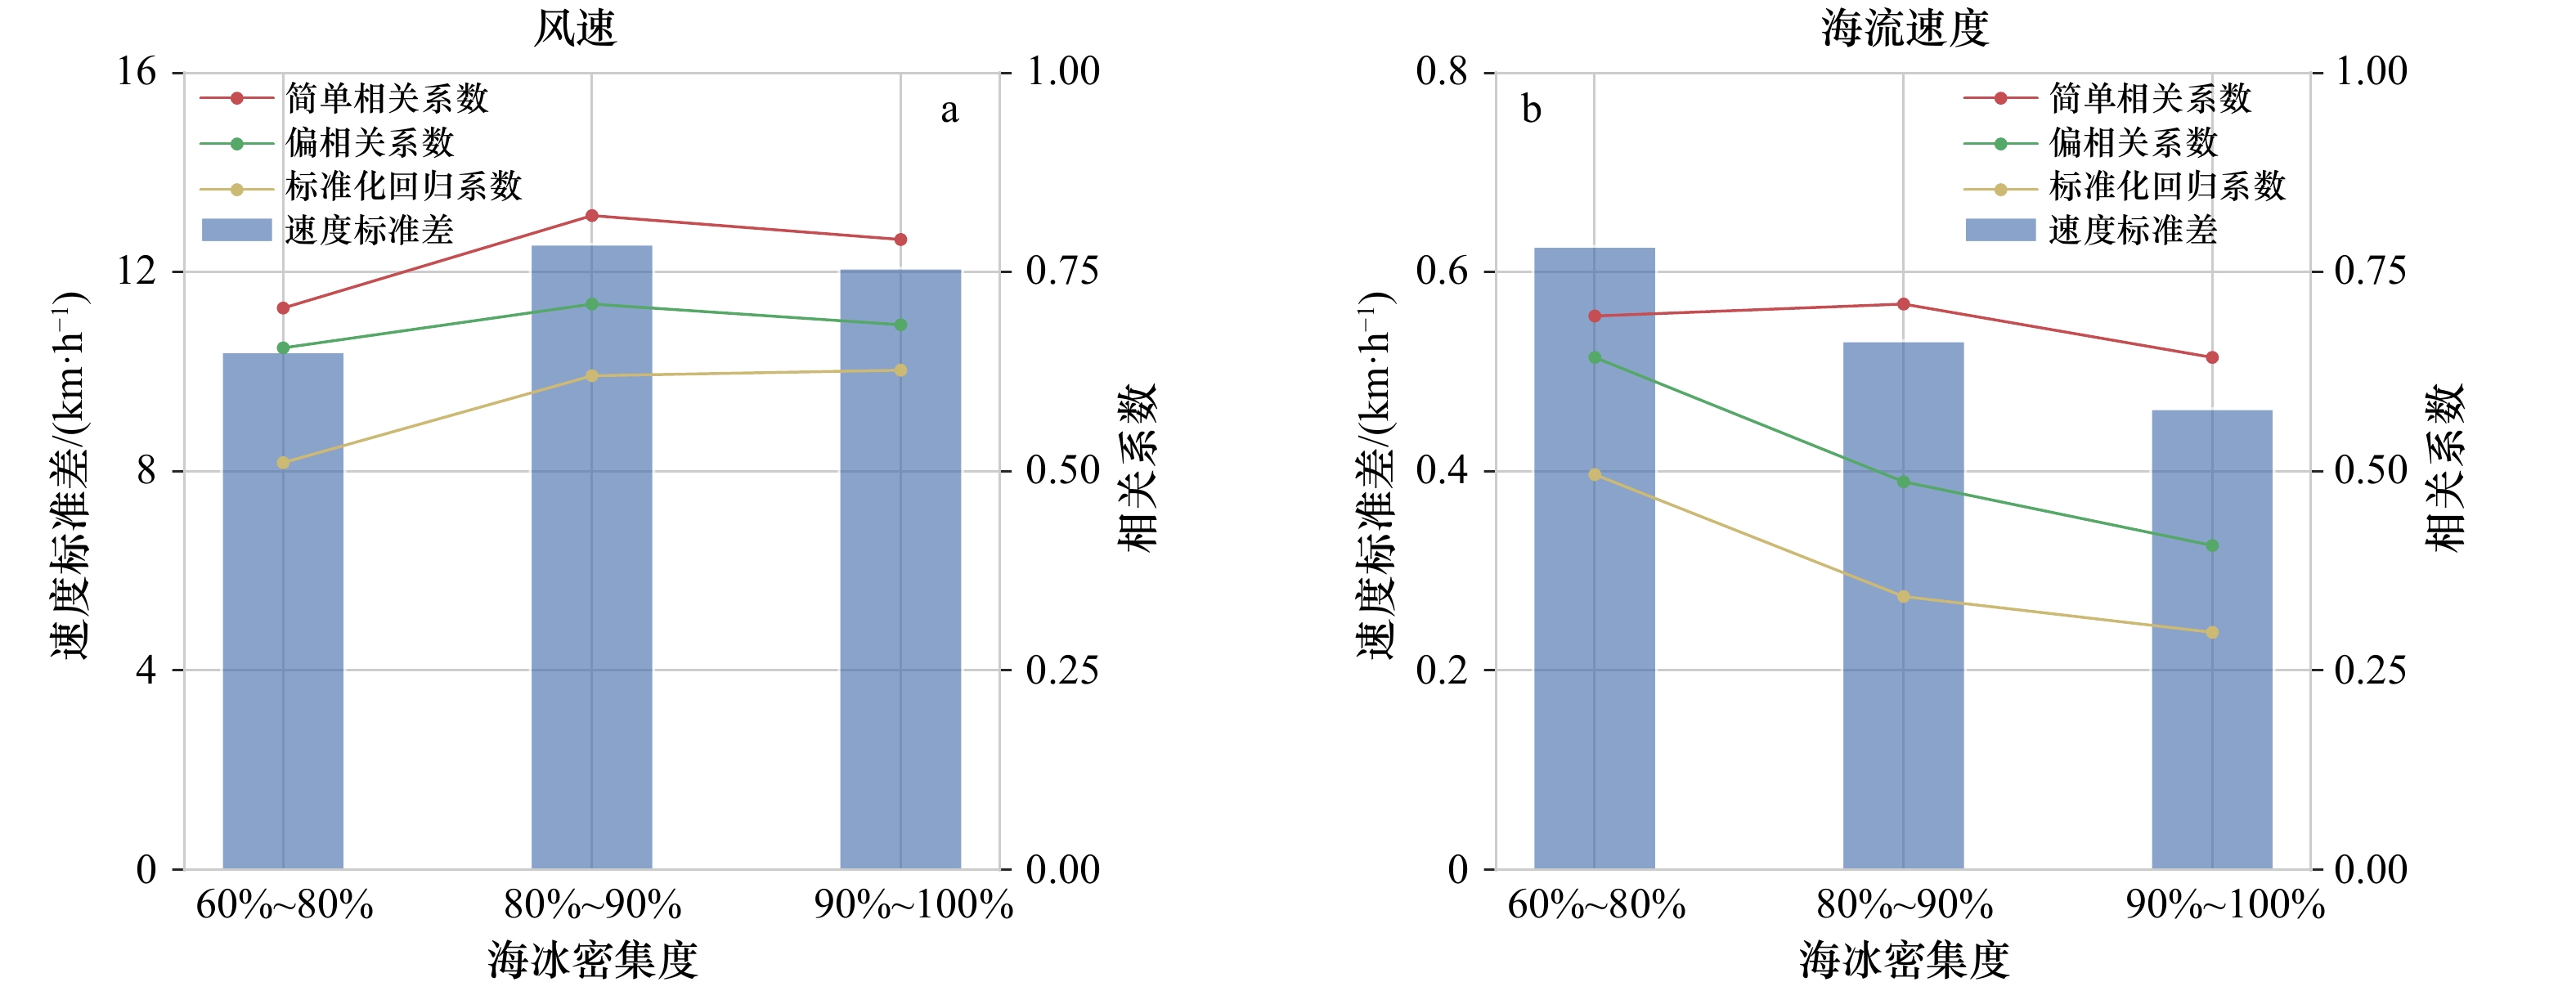
图 9 不同海冰密集度区间内风速(a)和海流速度(b)的统计参数
Fig. 9 Statistical parameters of wind (a) and current speed (b) in different ice concentration ranges
表 1 62号浮冰每日运动速度与对应风速、海流速度和海冰密集度
Tab. 1 Daily speed of No. 62 ice floe and corresponding wind speed, current speed and sea ice concentration
开始
日期结束
日期浮冰速度/(km·h−1) 风速/(km·h−1) 海流速度/(km·h−1) 海冰密
集度/%1月13日 1月14日 –0.78 –0.50 –0.69 98.9 1月14日 1月15日 –1.50 –12.63 –0.98 90.7 1月15日 1月16日 –1.06 0.54 –0.95 84.3 1月16日 1月17日 0.69 29.17 –0.83 90.9 1月17日 1月18日 3.18 49.90 –0.49 90.6 1月18日 1月19日 1.08 43.90 –0.32 93.3  下载: 导出CSV
表 2 浮冰速度与风速、海流速度和海冰密集度多元线性回归系数表
Tab. 2 Coefficients of multiple linear regression of ice floe speed and wind speed, current speed, and sea ice concentration
变量 标准化
回归系数p值 相关系数 VIF 零阶 偏 部分 风速 0.530 <0.001 0.767 0.650 0.446 1.414 海流速度 0.399 <0.001 0.709 0.539 0.334 1.426 海冰密集度 0.127 <0.001 0.307 0.231 0.124 1.053
下载: 导出CSV
-
[1] Zhang Jinlun, Rothrock D, Steele M. Recent changes in Arctic sea ice: The interplay between ice dynamics and thermodynamics[J]. Journal of Climate, 2000, 13(17): 3099−3114. doi: 10.1175/1520-0442(2000)013<3099:RCIASI>2.0.CO;2 [2] 武炳义. 冬季北极海冰运动主模态的构成及其与海平面气压变化的关系[J]. 大气科学, 2005, 29(5): 747−760. doi: 10.3878/j.issn.1006-9895.2005.05.08Wu Bingyi. Forming of the leading mode of winter Arctic sea ice motion and its relation with sea level pressure[J]. Chinese Journal of Atmospheric Sciences, 2005, 29(5): 747−760. doi: 10.3878/j.issn.1006-9895.2005.05.08 [3] Stern H L, Lindsay R W. Spatial scaling of Arctic sea ice deformation[J]. Journal of Geophysical Research: Oceans, 2009, 114(C10): C10017. doi: 10.1029/2009JC005380 [4] 左正道, 高郭平, 程灵巧, 等. 1979−2012年北极海冰运动学特征初步分析[J]. 海洋学报, 2016, 38(5): 57−69.Zuo Zhengdao, Gao Guoping, Cheng Lingqiao, et al. Preliminary analysis of kinematic characteristics of Arctic sea ice from 1979 to 2012[J]. Haiyang Xuebao, 2016, 38(5): 57−69. [5] 李瑜洁, 高晓清, 张录军, 等. 近30年北极海冰运动特征分析[J]. 高原气象, 2019, 38(1): 114−123.Li Yujie, Gao Xiaoqing, Zhang Lujun, et al. Analysis on the characteristics of Arctic sea ice movement in recent 30 years[J]. Plateau Meteorology, 2019, 38(1): 114−123. [6] Petrou Z I, Tian Yingli. High-resolution sea ice motion estimation with optical flow using satellite spectroradiometer data[J]. IEEE Transactions on Geoscience and Remote Sensing, 2017, 55(3): 1339−1350. doi: 10.1109/TGRS.2016.2622714 [7] 吴辉碇, 白珊, 张占海. 海冰动力学过程的数值模拟[J]. 海洋学报, 1998, 20(2): 1−13.Wu Huiding, Bai Shan, Zhang Zhanhai. Numerical simulation for dynamical processes of sea ice[J]. Haiyang Xuebao, 1998, 20(2): 1−13. [8] 刘煜, 吴辉碇. 第2讲 海冰动力学[J]. 海洋预报, 2017, 34(5): 99−110. doi: 10.11737/j.issn.1003-0239.2017.05.011Liu Yu, Wu Huiding. Sea ice dynamics[J]. Marine Forecasts, 2017, 34(5): 99−110. doi: 10.11737/j.issn.1003-0239.2017.05.011 [9] Jones E P, Eert A J. Waters of Nares Strait in 2001[J]. Polarforschung, 2006, 74(1/3): 185−189. [10] GEBCO Bathymetric Compilation Group 2020. The GEBCO_2020 Grid-a continuous terrain model of the global oceans and land[EB/OL]. (2020−04−28) [2020−12−20]. https://www.bodc.ac.uk/data/published_data_library/catalogue/10.5285/a29c5465-b138-234d-e053-6c86abc040b9/. [11] Kwok R, Pedersen L T, Gudmandsen P, et al. Large sea ice outflow into the Nares Strait in 2007[J]. Geophysical Research Letters, 2010, 37(3): L03502. [12] Münchow A. Volume and freshwater flux observations from Nares Strait to the west of Greenland at daily time scales from 2003 to 2009[J]. Journal of Physical Oceanography, 2016, 46(1): 141−157. doi: 10.1175/JPO-D-15-0093.1 [13] Gelderloos R, Straneo F, Katsman C A. Mechanisms behind the temporary shutdown of deep convection in the Labrador Sea: Lessons from the great salinity anomaly years 1968–71[J]. Journal of Climate, 2012, 25(19): 6743−6755. doi: 10.1175/JCLI-D-11-00549.1 [14] Goosse H, Fichefet T, Campin J M. The effects of the water flow through the Canadian Archipelago in a global ice-ocean model[J]. Geophysical Research Letters, 1997, 24(12): 1507−1510. doi: 10.1029/97GL01352 [15] Zhang Jinlun, Steele M. Effect of vertical mixing on the Atlantic Water layer circulation in the Arctic Ocean[J]. Journal of Geophysical Research: Oceans, 2007, 112(C4): C04S04. [16] Dickson R R, Meincke J, Malmberg S A, et al. The “great salinity anomaly” in the northern North Atlantic 1968–1982[J]. Progress in Oceanography, 1988, 20(2): 103−151. doi: 10.1016/0079-6611(88)90049-3 [17] Samelson R M, Agnew T, Melling H, et al. Evidence for atmospheric control of sea-ice motion through Nares Strait[J]. Geophysical Research Letters, 2006, 33(2): L2506. doi: 10.1029/2005GL025016 [18] Vincent R F, Marsden R F, McDonald A. Short time-span ice tracking using sequential AVHRR imagery[J]. Atmosphere-Ocean, 2001, 39(3): 279−288. doi: 10.1080/07055900.2001.9649681 [19] Kwok R. Variability of Nares Strait ice flux[J]. Geophysical Research Letters, 2005, 32(24): L24502. doi: 10.1029/2005GL024768 [20] Rallabandi B, Zheng Zhong, Winton M, et al. Formation of sea ice bridges in narrow straits in response to wind and water stresses[J]. Journal of Geophysical Research: Oceans, 2017, 122(7): 5588−5610. doi: 10.1002/2017JC012822 [21] Vincent R F. A study of the north water polynya ice arch using four decades of satellite data[J]. Scientific Reports, 2019, 9(1): 20278. doi: 10.1038/s41598-019-56780-6 [22] Moore G W K, Howell S E L, Brady M, et al. Anomalous collapses of Nares Strait ice arches leads to enhanced export of Arctic sea ice[J]. Nature Communications, 2021, 12(1): 1−8. doi: 10.1038/s41467-020-20314-w [23] Barber D G, Hanesiak J M, Chan W, et al. Sea-ice and meteorological conditions in Northern Baffin Bay and the North Water polynya between 1979 and 1996[J]. Atmosphere, 2001, 39(3): 343−359. [24] Torres R, Snoeij P, Geudtner D, et al. GMES Sentinel-1 mission[J]. Remote Sensing of Environment, 2012, 120: 9−24. doi: 10.1016/j.rse.2011.05.028 [25] Hersbach H, Bell B, Berrisford P, et al. ERA5 hourly data on single levels from 1979 to present[EB/OL]. (2018-06-14) [2020-12-20]. https://doi.org/10.24381/cds.adbb2d47. [26] Shokr M E, Wang Zihan, Liu Tingting. Sea ice drift and arch evolution in the Robeson Channel using the daily coverage of Sentinel-1 SAR data for the 2016–2017 freezing season[J]. The Cryosphere, 2020, 14(11): 3611−3627. doi: 10.5194/tc-14-3611-2020 [27] Lellouche J M, Greiner E, Le Galloudec O, et al. Recent updates to the Copernicus marine service global ocean monitoring and forecasting real-time 1/12° high-resolution system[J]. Ocean Science, 2018, 14(5): 1093−1126. doi: 10.5194/os-14-1093-2018 [28] Koenig Z, Provost C, Sennéchael N, et al. The Yermak Pass Branch: A major pathway for the Atlantic water north of Svalbard?[J]. Journal of Geophysical Research: Oceans, 2017, 122(12): 9332−9349. doi: 10.1002/2017JC013271 [29] Melsheimer C, Spreen G. AMSR2 ASI sea ice concentration data, Arctic, version 5.4 (NetCDF) (July 2012−December 2018) [EB/OL]. (2019−08−04) [2020−12−20]. https://doi.org/10.1594/PANGAEA.898399. [30] 郝光华, 赵杰臣, 李春花, 等. 2017年夏季北极中央航道海冰观测特征及海冰密集度遥感产品评估[J]. 海洋学报, 2018, 40(11): 54−63.Hao Guanghua, Zhao Jiechen, Li Chunhua, et al. The sea ice observations and assessment of satellite sea-ice concentration along the Central Arctic Passage in summer 2017[J]. Haiyang Xuebao, 2018, 40(11): 54−63. [31] Xiu Yuanren, Li Zhijun, Lei Ruibo, et al. Comparisons of passive microwave remote sensing sea ice concentrations with ship-based visual observations during the CHINARE Arctic summer cruises of 2010–2018[J]. Acta Oceanologica Sinica, 2020, 39(9): 38−49. doi: 10.1007/s13131-020-1646-5 [32] Shokr M, Lambe A, Agnew T. A new algorithm (ECICE) to estimate ice concentration from remote sensing observations: An application to 85-GHz passive microwave data[J]. IEEE Transactions on Geoscience and Remote Sensing, 2008, 46(12): 4104−4121. doi: 10.1109/TGRS.2008.2000624 [33] Shokr M, Agnew T A. Validation and potential applications of Environment Canada Ice Concentration Extractor (ECICE) algorithm to Arctic ice by combining AMSR-E and QuikSCAT observations[J]. Remote Sensing of Environment, 2013, 128: 315−332. doi: 10.1016/j.rse.2012.10.016 [34] Ye Yufang, Shokr M, Heygster G, et al. Improving multiyear sea ice concentration estimates with sea ice drift[J]. Remote Sensing, 2016, 8(5): 397. doi: 10.3390/rs8050397 [35] Ye Yufang, Heygster G, Shokr M. Improving multiyear ice concentration estimates with reanalysis air temperatures[J]. IEEE Transactions on Geoscience and Remote Sensing, 2016, 54(5): 2602−2614. doi: 10.1109/TGRS.2015.2503884 [36] Haller M, Brümmer B, Müller G. Atmosphere-ice forcing in the transpolar drift stream: Results from the DAMOCLES ice-buoy campaigns 2007–2009[J]. The Cryosphere, 2014, 8(1): 275−288. doi: 10.5194/tc-8-275-2014 [37] 何晓群, 刘文卿. 应用回归分析[M]. 5版. 北京: 中国人民大学出版社, 2019.He Xiaoqun, Liu Wenqing. Applied Regression Analysis[M]. 5th ed. Beijing: China Renmin University Press, 2019. [38] 高阳. 对多重共线性检测指标的一些研究[D]. 兰州: 兰州大学, 2019.Gao Yang. Some discussion on multi-collinearity detection indices[D]. Lanzhou: Lanzhou University, 2019. [39] Vihma T, Tisler P, Uotila P. Atmospheric forcing on the drift of Arctic sea ice in 1989–2009[J]. Geophysical Research Letters, 2012, 39(2): L02501. [40] Lei Ruibo, Heil P, Wang Jia, et al. Characterization of sea-ice kinematic in the Arctic outflow region using buoy data[J]. Polar Research, 2016, 35: 22658. doi: 10.3402/polar.v35.22658 [41] Leppäranta M. The Drift of Sea Ice[M]. Berlin: Springer, 2011. -

计量
- 文章访问数: 688
- HTML全文浏览量: 137
- PDF下载量: 90
- 被引次数: 0
