

The role of large-scale circulation on the consistent positive salinity anomaly in the Indian sector of the Antarctic
-
摘要: 南极印度洋扇区分布了许多南极底层水的生成区,此海域海水盐度变化对全球的气候变化有着深远影响。本文采用EN4再分析数据、实测海豹资料和WOD18数据,结合大气再分析和海冰密集度数据,对南极印度洋扇区表面盐度长期变化及其对大尺度环流异常的响应进行探究。2008年以来,南极沿岸出现显著的海表面持续性高盐异常,其中印度洋扇区变化最为显著,表层高盐水主要集中在达恩利冰间湖附近与沙克尔顿冰架以北的海域。沿岸海域的高盐陆架水向北扩张且影响深度不断加深,高盐的绕极深层水上涌也更加明显。此高盐异常与南极涛动(Antarctic Oscillation,AAO)、印度洋偶极子(Indian Ocean Dipole,IOD)两种大尺度环流密切相关。AAO与IOD正位相下,西风显著增强,促进海冰大量生成,为海表面提供了大量的盐通量。同时,海表面出现更显著的风场旋度负异常与低压异常,促进高盐深层水上涌,对高盐异常有重要维持作用。此外,纬向风剪切与蒸发增强也是影响该高盐异常的重要局地过程。Abstract: The key regions for formation of the Antarctic Bottom Water occupied in the Indian sector of the Southern Ocean. The salinity change of the region has a profound influence on the global climate change. EN4 reanalysis-gridded data, measured seal data, WOD18 data combined with atmospheric reanalysis and sea ice concentration data were all used to explore the sea surface salinity changes in the Indian sector of the Southern Ocean and the response to large-scale circulation anomaly. The observation and reanalysis data both illustrated a significant positive surface salinity anomaly occurred in the Antarctic coast since 2008, especially in the Indian sector. The surface positive salinity anomaly was mainly centered in the Darnley Polynya and the north of Shackleton Ice Shelf. The high salinity shelf water expanded northward from the Antarctic coast and deepened. Meanwhile, the upwelling of Circumpolar Deep Water became increasingly distinct. Our study showed that this positive salinity anomaly was connected with the Antarctic Oscillation (AAO) and the Indian Ocean Dipole (IOD). During the positive AAO and IOD phases, the westerly wind enhanced significantly in the Indian sector and promoted the formation of sea ice, which increased surface salt flux. The significant negative wind curl and low pressure anomaly resulted in the upwelling of salty Circumpolar Deep Water and maintained the positive salinity anomaly. Additionally, increased locally zonal wind shear and enhanced evaporation were important factors as well.
-

图 1 1950−2018年60°S以南的EN4海表面盐度EOF分析结果
a为EOF分析的时间序列。b、c分别为EOF分析的第一、第二模态,图中数值为对应的方差贡献率
Fig. 1 The first two EOFs of EN4 sea surface salinity in the south of 60°S from 1950 to 2018
The time series of the first two EOFs are shown in a. b and c are the first and second mode with each contribution

图 2 南极印度洋扇区表层盐度变化(a)及其小波分析(b)
Fig. 2 The low frequency change of sea surface salinity derived from the observed and reanalysis data (a) and the wavelet analysis (b) in the Indian sector of the Southern Ocean (ISO)

图 3 MEOP、WOD与EN4数据给出的1979–2002年(a)、2008–2018年(b)的南极印度洋扇区表层盐度分布
Fig. 3 Surface salinity distribution derived from MEOP, WOD and EN4 in the Indian sector of the Antarctic during 1979–2002 (a) and 2008–2018 (b) respectively

图 4 南极印度洋扇区两个时段的实测年均盐度(a)、各年7月(b)和2月(c)盐度的垂直廓线
Fig. 4 The mean salinity profile observations in ISO during two time periods (a), and mean salinity profile in July (b), February (c) of each year
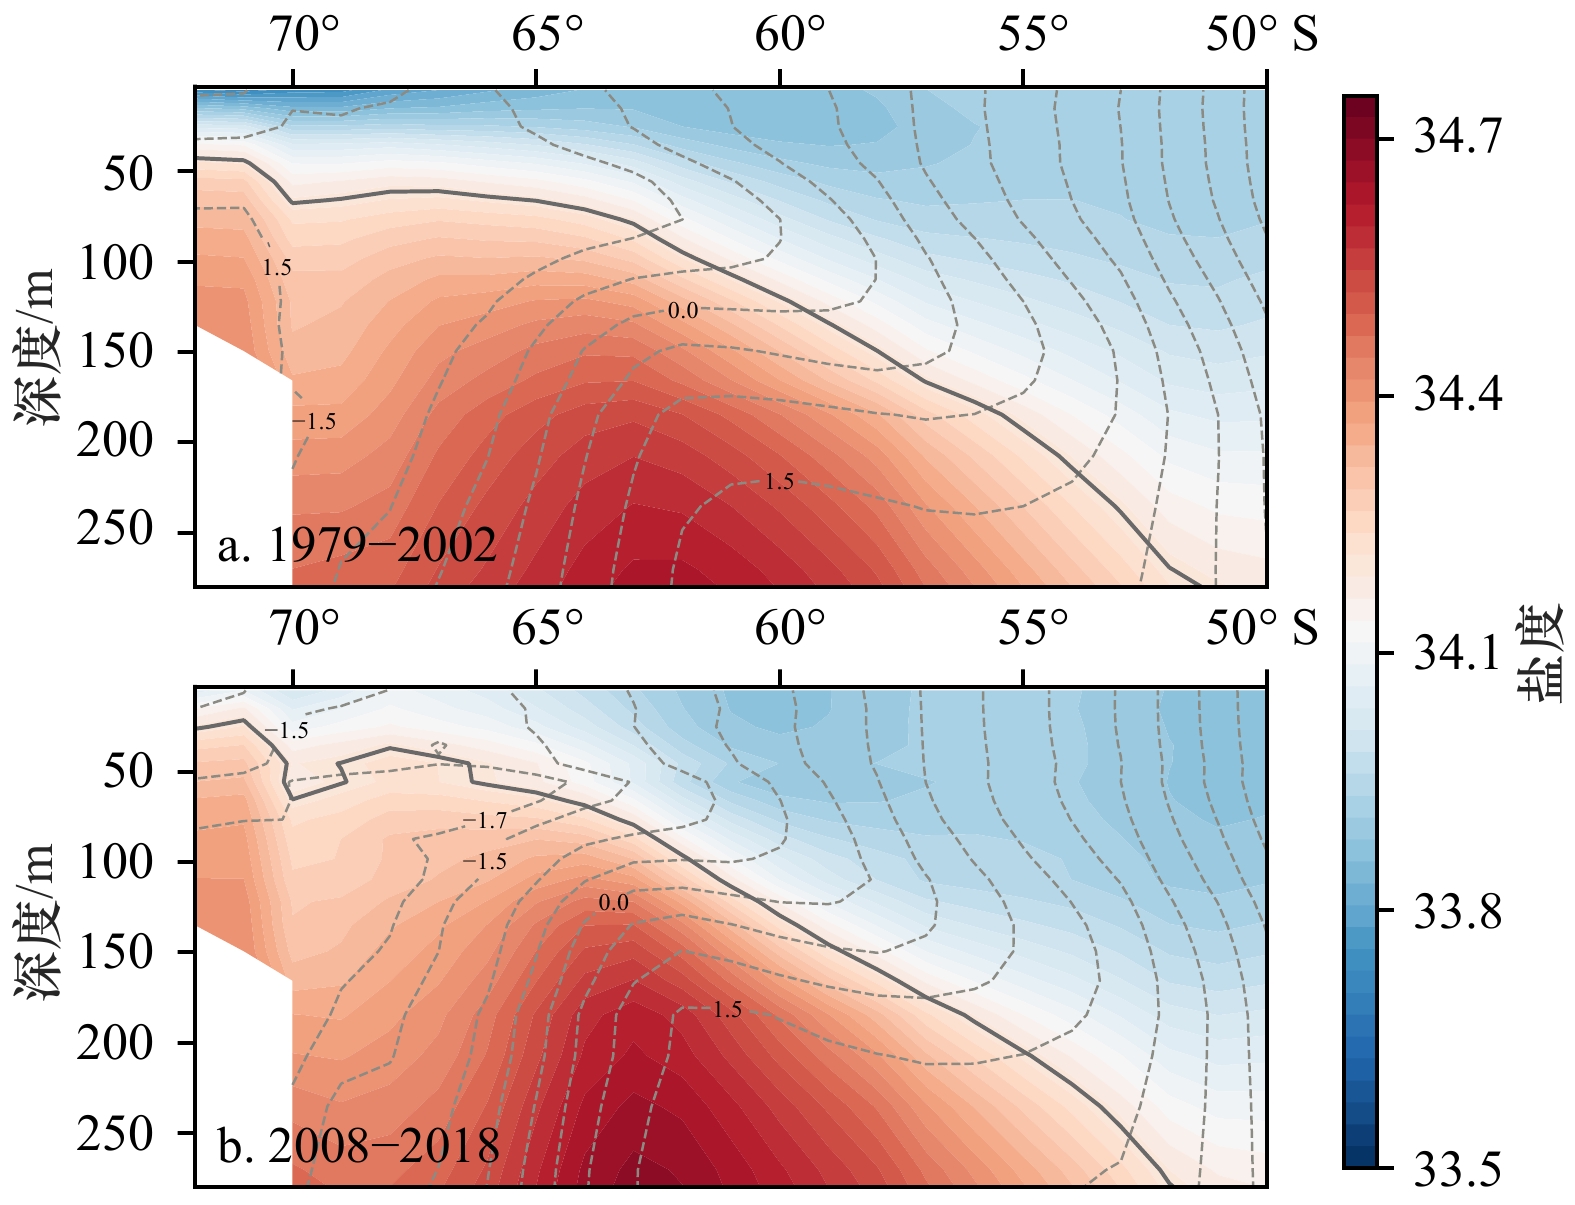
图 5 1979–2002年(a)和2008–2018年(b)南极印度洋扇区EN4经向温(等值线,单位:°C)盐断面
Fig. 5 Meridional mean salinity and temperature (isoline, unit: °C) sections in ISO (30°–120°E) during 1979–2002 (a) and 2008–2018 (b)

图 6 1979−2018年间AAO、IOD指数序列与环流异常期间的南极海表面盐度异常合成分析结果
Fig. 6 The AAO and IOD indices and the corresponding composite analysis of sea surface salinity anomaly in the Antarctic from 1979 to 2018

图 7 南极冬季海表面气压异常与风场旋度异常的合成分析
图中实线代表正异常,虚线代表负异常
Fig. 7 The composite analysis of sea surface pressure anomaly and wind curl anomaly in the Antarctic in winter
The solid line and the dashed line are corresponding to the positive and negative anomaly respectively

图 8 南极冬季风场异常与秋季海冰密集度异常的合成分析
Fig. 8 The composite analysis of winter wind anomaly and autumn sea ice concentration anomaly in the Antarctic
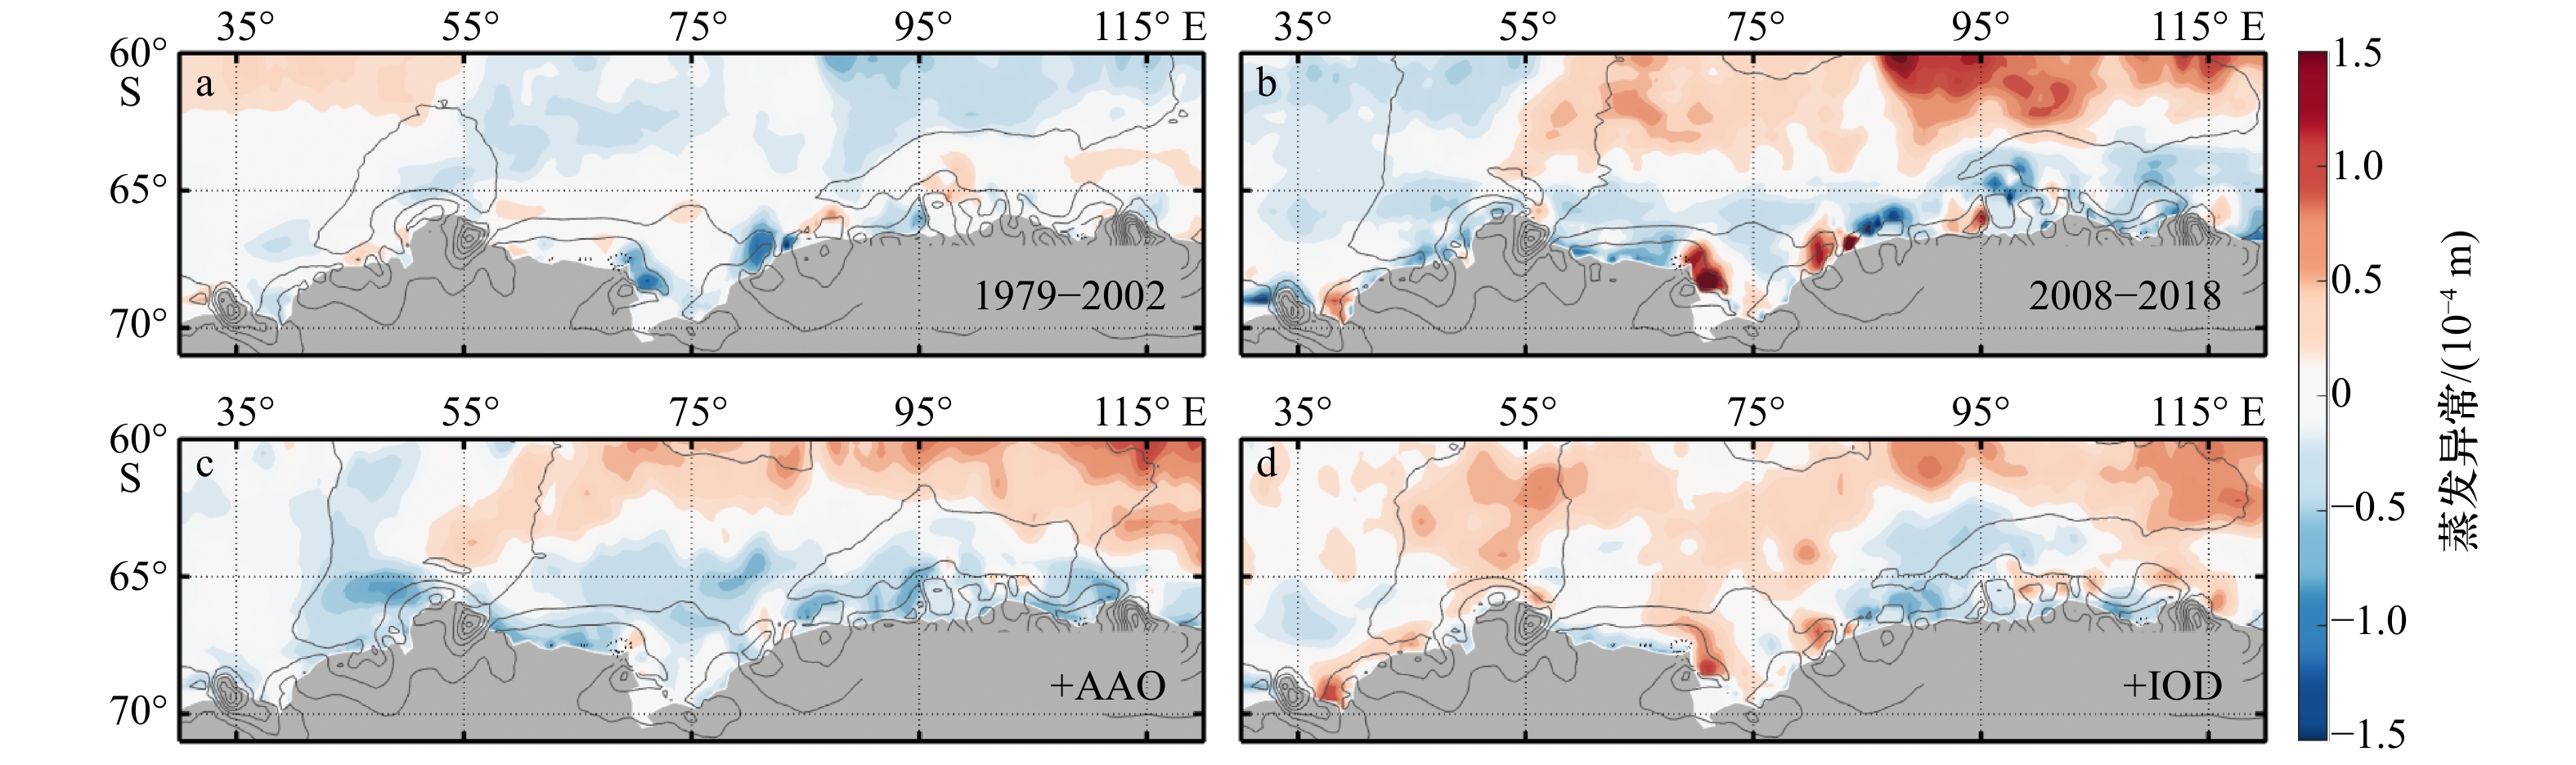
图 10 蒸发异常与降水异常在1979–2002年、2008–2018年两个时间段的平均态与AAO、IOD正位相下的合成分析
图中颜色表示为蒸发异常,等值线表示降水异常,实线对应正异常,虚线对应负异常。a、b为二者在两个时间段的平均态,c、d为二者在AAO、IOD下的合成分析
Fig. 10 The climatological evaporation and precipitation anomaly during the 1979–2002, 2008–2018, and the composite analysis of AAO, IOD positive phases
The shading color represents evaporation anomaly. The solid line and the dashed line are the positive and negative precipitation anomaly, respectively. a and b are the climatology of evaporation/precipitation anomaly in two period, c and d are their composite analysis corresponding to positive AAO and IOD phase
表 1 1979−2018年间AAO、IOD指数的环流异常年份
Tab. 1 The anomaly years of AAO and IOD indices from 1979 to 2018
环流 正位相 负位相 AAO 1979、1989、1993、1998、1999、2008、2010、2015、2016 1980、1981、1991、1992、2002、2007 IOD 1982、1994、1997、2011、2015、2017 1980、1984、1985、1989、1992、1996  下载: 导出CSV
-
[1] Haumann F A, Gruber N, Münnich M, et al. Sea-ice transport driving Southern Ocean salinity and its recent trends[J]. Nature, 2016, 537(7618): 89−92. doi: 10.1038/nature19101 [2] Durack P J. Ocean salinity and the global water cycle[J]. Oceanography, 2015, 28(1): 20−31. doi: 10.5670/oceanog.2015.03 [3] Durack P J, Wijffels S E. Fifty-year trends in global ocean salinities and their relationship to broad-scale warming[J]. Journal of Climate, 2010, 23(16): 4342−4362. doi: 10.1175/2010JCLI3377.1 [4] Curran M A J, Van Ommen T D, Morgan V I, et al. Ice core evidence for Antarctic sea ice decline since the 1950s[J]. Science, 2003, 302(5648): 1203−1206. doi: 10.1126/science.1087888 [5] 林丽娜, 陈红霞, 刘娜. 普里兹湾及邻近海域多航次水文特征比较分析[J]. 海洋科学进展, 2015, 33(4): 460−470. doi: 10.3969/j.issn.1671-6647.2015.04.004Lin Li’na, Chen Hongxia, Liu Na. A comparative analysis on hydrographic features during several cruises in the region of Prydz Bay, Antarctic[J]. Advances in Marine Science, 2015, 33(4): 460−470. doi: 10.3969/j.issn.1671-6647.2015.04.004 [6] 陈红霞, 林丽娜, 史久新. 南极普里兹湾及其邻近海域水团研究[J]. 海洋学报, 2014, 36(7): 1−8.Chen Hongxia, Lin Li’na, Shi Jiuxin. Study on water masses in Prydz Bay and its adjacent sea area[J]. Haiyang Xuebao, 2014, 36(7): 1−8. [7] 徐智昕, 许建平, 高郭平, 等. 2011年冬季南极普里兹湾及其邻近海域水文特征与水团分析[J]. 海洋科学进展, 2016, 34(2): 226−239. doi: 10.3969/j.issn.1671-6647.2016.02.008Xu Zhixin, Xu Jianping, Gao Guoping, et al. Study on hydrographic features and water masses in the Prydz Bay and its adjacent waters in Antarctic winter of 2011[J]. Advances in Marine Science, 2016, 34(2): 226−239. doi: 10.3969/j.issn.1671-6647.2016.02.008 [8] 林丽娜, 陈红霞, 刘娜. 南极普里兹湾73°E断面地转流及水文特征分析[J]. 海洋科学进展, 2013, 31(3): 332−342. doi: 10.3969/j.issn.1671-6647.2013.03.005Lin Li’na, Chen Hongxia, Liu Na. Zonal geostrophic currents and hydrographic features along 73°E in the Prydz Bay, Antarctica[J]. Advances in Marine Science, 2013, 31(3): 332−342. doi: 10.3969/j.issn.1671-6647.2013.03.005 [9] Masuda S. Determining subsurface oceanic changes in the Indian sector of the Southern Ocean using Argo float data[J]. Polar Science, 2020, 23: 100498. doi: 10.1016/j.polar.2019.100498 [10] Pezza A B, Rashid H A, Simmonds I. Climate links and recent extremes in Antarctic sea ice, high-latitude cyclones, Southern Annular Mode and ENSO[J]. Climate Dynamics, 2012, 38(1/2): 57−73. [11] Cheon W G, Cho C B, Gordon A L, et al. The role of oscillating Southern Hemisphere westerly winds: Southern Ocean coastal and open-ocean polynyas[J]. Journal of Climate, 2018, 31(3): 1053−1073. doi: 10.1175/JCLI-D-17-0237.1 [12] Hazel J E, Stewart A L. Are the near-Antarctic easterly winds weakening in response to enhancement of the Southern Annular Mode?[J]. Journal of Climate, 2019, 32(6): 1895−1918. doi: 10.1175/JCLI-D-18-0402.1 [13] Nuncio M, Yuan Xiaojun. The influence of the Indian Ocean dipole on Antarctic sea ice[J]. Journal of Climate, 2015, 28(7): 2682−2690. doi: 10.1175/JCLI-D-14-00390.1 [14] Yang Jiao, Du Zhiheng, Xiao Cunde. Sea salt sodium record in a shallow ice core from east Antarctica as a potential proxy of the Antarctic sea ice extent in Southern Indian Ocean[J]. Journal of Ocean University of China, 2019, 18(6): 1351−1359. doi: 10.1007/s11802-019-4084-2 [15] Graham J A, Heywood K J, Chavanne C P, et al. Seasonal variability of water masses and transport on the Antarctic continental shelf and slope in the southeastern Weddell Sea[J]. Journal of Geophysical Research: Oceans, 2013, 118(4): 2201−2214. doi: 10.1002/jgrc.20174 [16] Ohshima K I, Fukamachi Y, Williams G D, et al. Antarctic bottom water production by intense sea-ice formation in the Cape Darnley Polynya[J]. Nature Geoscience, 2013, 6(3): 235−240. doi: 10.1038/ngeo1738 [17] 丁卓铭, 张林, 卞林根, 等. 普里兹湾沿岸下降风特征分析[J]. 极地研究, 2015, 27(4): 351−363.Ding Zhuoming, Zhang Lin, Bian Lingen, et al. Analysis of katabatic winds on the coast of Prydz Bay[J]. Chinese Journal of Polar Research, 2015, 27(4): 351−363. [18] Aoki S, Ono K, Hirano D, et al. Continuous winter oceanic profiling in the Cape Darnley Polynya, East Antarctica[J]. Journal of Oceanography, 2020, 76(5): 365−372. doi: 10.1007/s10872-020-00550-w [19] Good S A, Martin M J, Rayner N A. EN4: Quality controlled ocean temperature and salinity profiles and monthly objective analyses with uncertainty estimates[J]. Journal of Geophysical Research: Oceans, 2013, 118(12): 6704−6716. doi: 10.1002/2013JC009067 [20] Boyer T P, Antonov J I, Baranova O K, et al. World ocean database 2013[R]. Silver Spring: NOAA, 2013. [21] Roquet F, Williams G, Hindell M A, et al. A Southern Indian Ocean database of hydrographic profiles obtained with instrumented elephant seals[J]. Scientific Data, 2014, 1(1): 140028. doi: 10.1038/sdata.2014.28 [22] ERA5 monthly averaged data on single levels from 1979 to present[DB/OL]. (2019–04–18) [2020–12–28]. https://cds.climate.copernicus.eu/cdsapp#!/dataset/reanalysis-era5-single-levels-monthly-means?tab=overview. [23] Saji N H, Yamagata T. Possible impacts of Indian Ocean dipole mode events on global climate[J]. Climate Research, 2003, 25(2): 151−169. [24] Comiso J C, Nishio F. Trends in the sea ice cover using enhanced and compatible AMSR-E, SSM/I, and SMMR data[J]. Journal of Geophysical Research: Oceans, 2008, 113(C2): C02S07. [25] Kern S, Lavergne T, Notz D, et al. Satellite passive microwave sea-ice concentration data set intercomparison: Closed ice and ship-based observations[J]. The Cryosphere, 2019, 13(12): 3261−3307. [26] Yuan Xiaojun, Martinson D G. The Antarctic dipole and its predictability[J]. Geophysical Research Letters, 2001, 28(18): 3609−3612. doi: 10.1029/2001GL012969 [27] 史久新. 南极冰架–海洋相互作用研究综述[J]. 极地研究, 2018, 30(3): 287−302.Shi Jiuxin. A review of ice shelf-ocean interaction in Antarctica[J]. Chinese Journal of Polar Research, 2018, 30(3): 287−302. [28] Guo Guijun, Shi Jiuxin, Gao Libao, et al. Reduced sea ice production due to upwelled oceanic heat flux in Prydz Bay, East Antarctica[J]. Geophysical Research Letters, 2019, 46(9): 4782−4789. doi: 10.1029/2018GL081463 [29] Campbell E C, Wilson E A, Moore G W K, et al. Antarctic offshore polynyas linked to Southern Hemisphere climate anomalies[J]. Nature, 2019, 570(7761): 319−325. doi: 10.1038/s41586-019-1294-0 [30] Langlais C E, Rintoul S R, Zika J D. Sensitivity of Antarctic circumpolar current transport and eddy activity to wind patterns in the Southern Ocean[J]. Journal of Physical Oceanography, 2015, 45(4): 1051−1067. doi: 10.1175/JPO-D-14-0053.1 [31] Thompson A F, Stewart A L, Spence P, et al. The Antarctic slope current in a changing climate[J]. Reviews of Geophysics, 2018, 56(4): 741−770. doi: 10.1029/2018RG000624 [32] Yu Lejiang, Yang Qinghua, Vihma T, et al. Features of extreme precipitation at progress station, Antarctica[J]. Journal of Climate, 2018, 31(22): 9087−9105. doi: 10.1175/JCLI-D-18-0128.1 [33] Grieger J, Leckebusch G C, Raible C C, et al. Subantarctic cyclones identified by 14 tracking methods, and their role for moisture transports into the continent[J]. Tellus A: Dynamic Meteorology and Oceanography, 2018, 70(1): 1−18. [34] Lefebvre W, Goosse H. An analysis of the atmospheric processes driving the large-scale winter sea ice variability in the Southern Ocean[J]. Journal of Geophysical Research: Oceans, 2008, 113(C2): C02004.4. -

计量
- 文章访问数: 424
- HTML全文浏览量: 222
- PDF下载量: 64
- 被引次数: 0
