

Multi temporal and spatial difference analysis of various MSS models and Arctic sea ice freeboard
-
摘要: 基于2017年4月、2018年4月和2019年4月的CryoSat-2 L1B数据,比较分析了UCL13、DTU10、DTU13、DTU15和DTU18 5种不同平均海表面高度(MSS)模型及其反演的北极海冰干舷的多时空尺度差异。以UCL13为基准,对比分析不同MSS模型的差异和所反演的海冰干舷的差异,实验结果表明,不同MSS模型之间的平均绝对偏差范围为0.19~0.26 m,标准差范围为0.55~0.57 m,其中DTU18与UCL13的差异最小。以UCL13为基准,其他4种MSS模型反演的海冰干舷的平均绝对偏差为0.50~0.79 cm,标准差范围为1.17~1.74 cm。通过与冰桥计划(Operation IceBridge,OIB)机载数据相比,5种MSS模型反演的海冰干舷的相关系数范围为0.70~0.71,均方根误差范围为7.7~7.8 cm。故不同MSS模型之间的偏差对整个北极地区的海冰干舷反演的影响较小,偏差以相同的方式影响冰间水道和浮冰高度测量,因此相互抵消,但在冰间水道分布稀疏的区域,如加拿大群岛北部和拉普捷夫海区域,不同MSS模型反演的海冰干舷差异较大。Abstract: Based on the CryoSat-2 L1B data for April 2017−2019, this study compares and analyzes the multi temporal and spatial scale differences of UCL13, DTU10, DTU13, DTU15 and DTU18 mean sea surface height (MSS) models and the Arctic sea ice freeboard retrieval. The differences of various mean sea surface height models and the sea ice freeboard retrieval are compared with UCL13. The experimental results show that the average absolute deviation range between different MSS models is 0.19−0.26 m as well as the standard deviation range is 0.55−0.57 m, among which the difference between DTU18 and UCL13 is the smallest. The mean absolute deviation range of sea ice freeboard retrieved by the other four MSS models is 0.50−0.79 cm with the standard deviation range is 1.17−1.74 cm. Compared to airborne Operation IceBridge (OIB) data, the correlation coefficients of sea ice freeboard retrieved by the five MSS models range from 0.70 to 0.71 with the root mean square error range is 7.7−7.8 cm. Therefore, the biases between various MSS models have little influence on sea ice freeboard retrievals in the entire Arctic region, since biases impact both the lead and ice floe height measurements in the same way, and thus cancel out. However, in the areas with sparse leads, such as the northern Canadian Islands and the Laptev Sea, the sea ice freeboard retrieved by different MSS models varies greatly.
-
Key words:
- mean sea surface height /
- CryoSat-2 /
- Arctic /
- sea ice freeboard /
- differential analysis
-
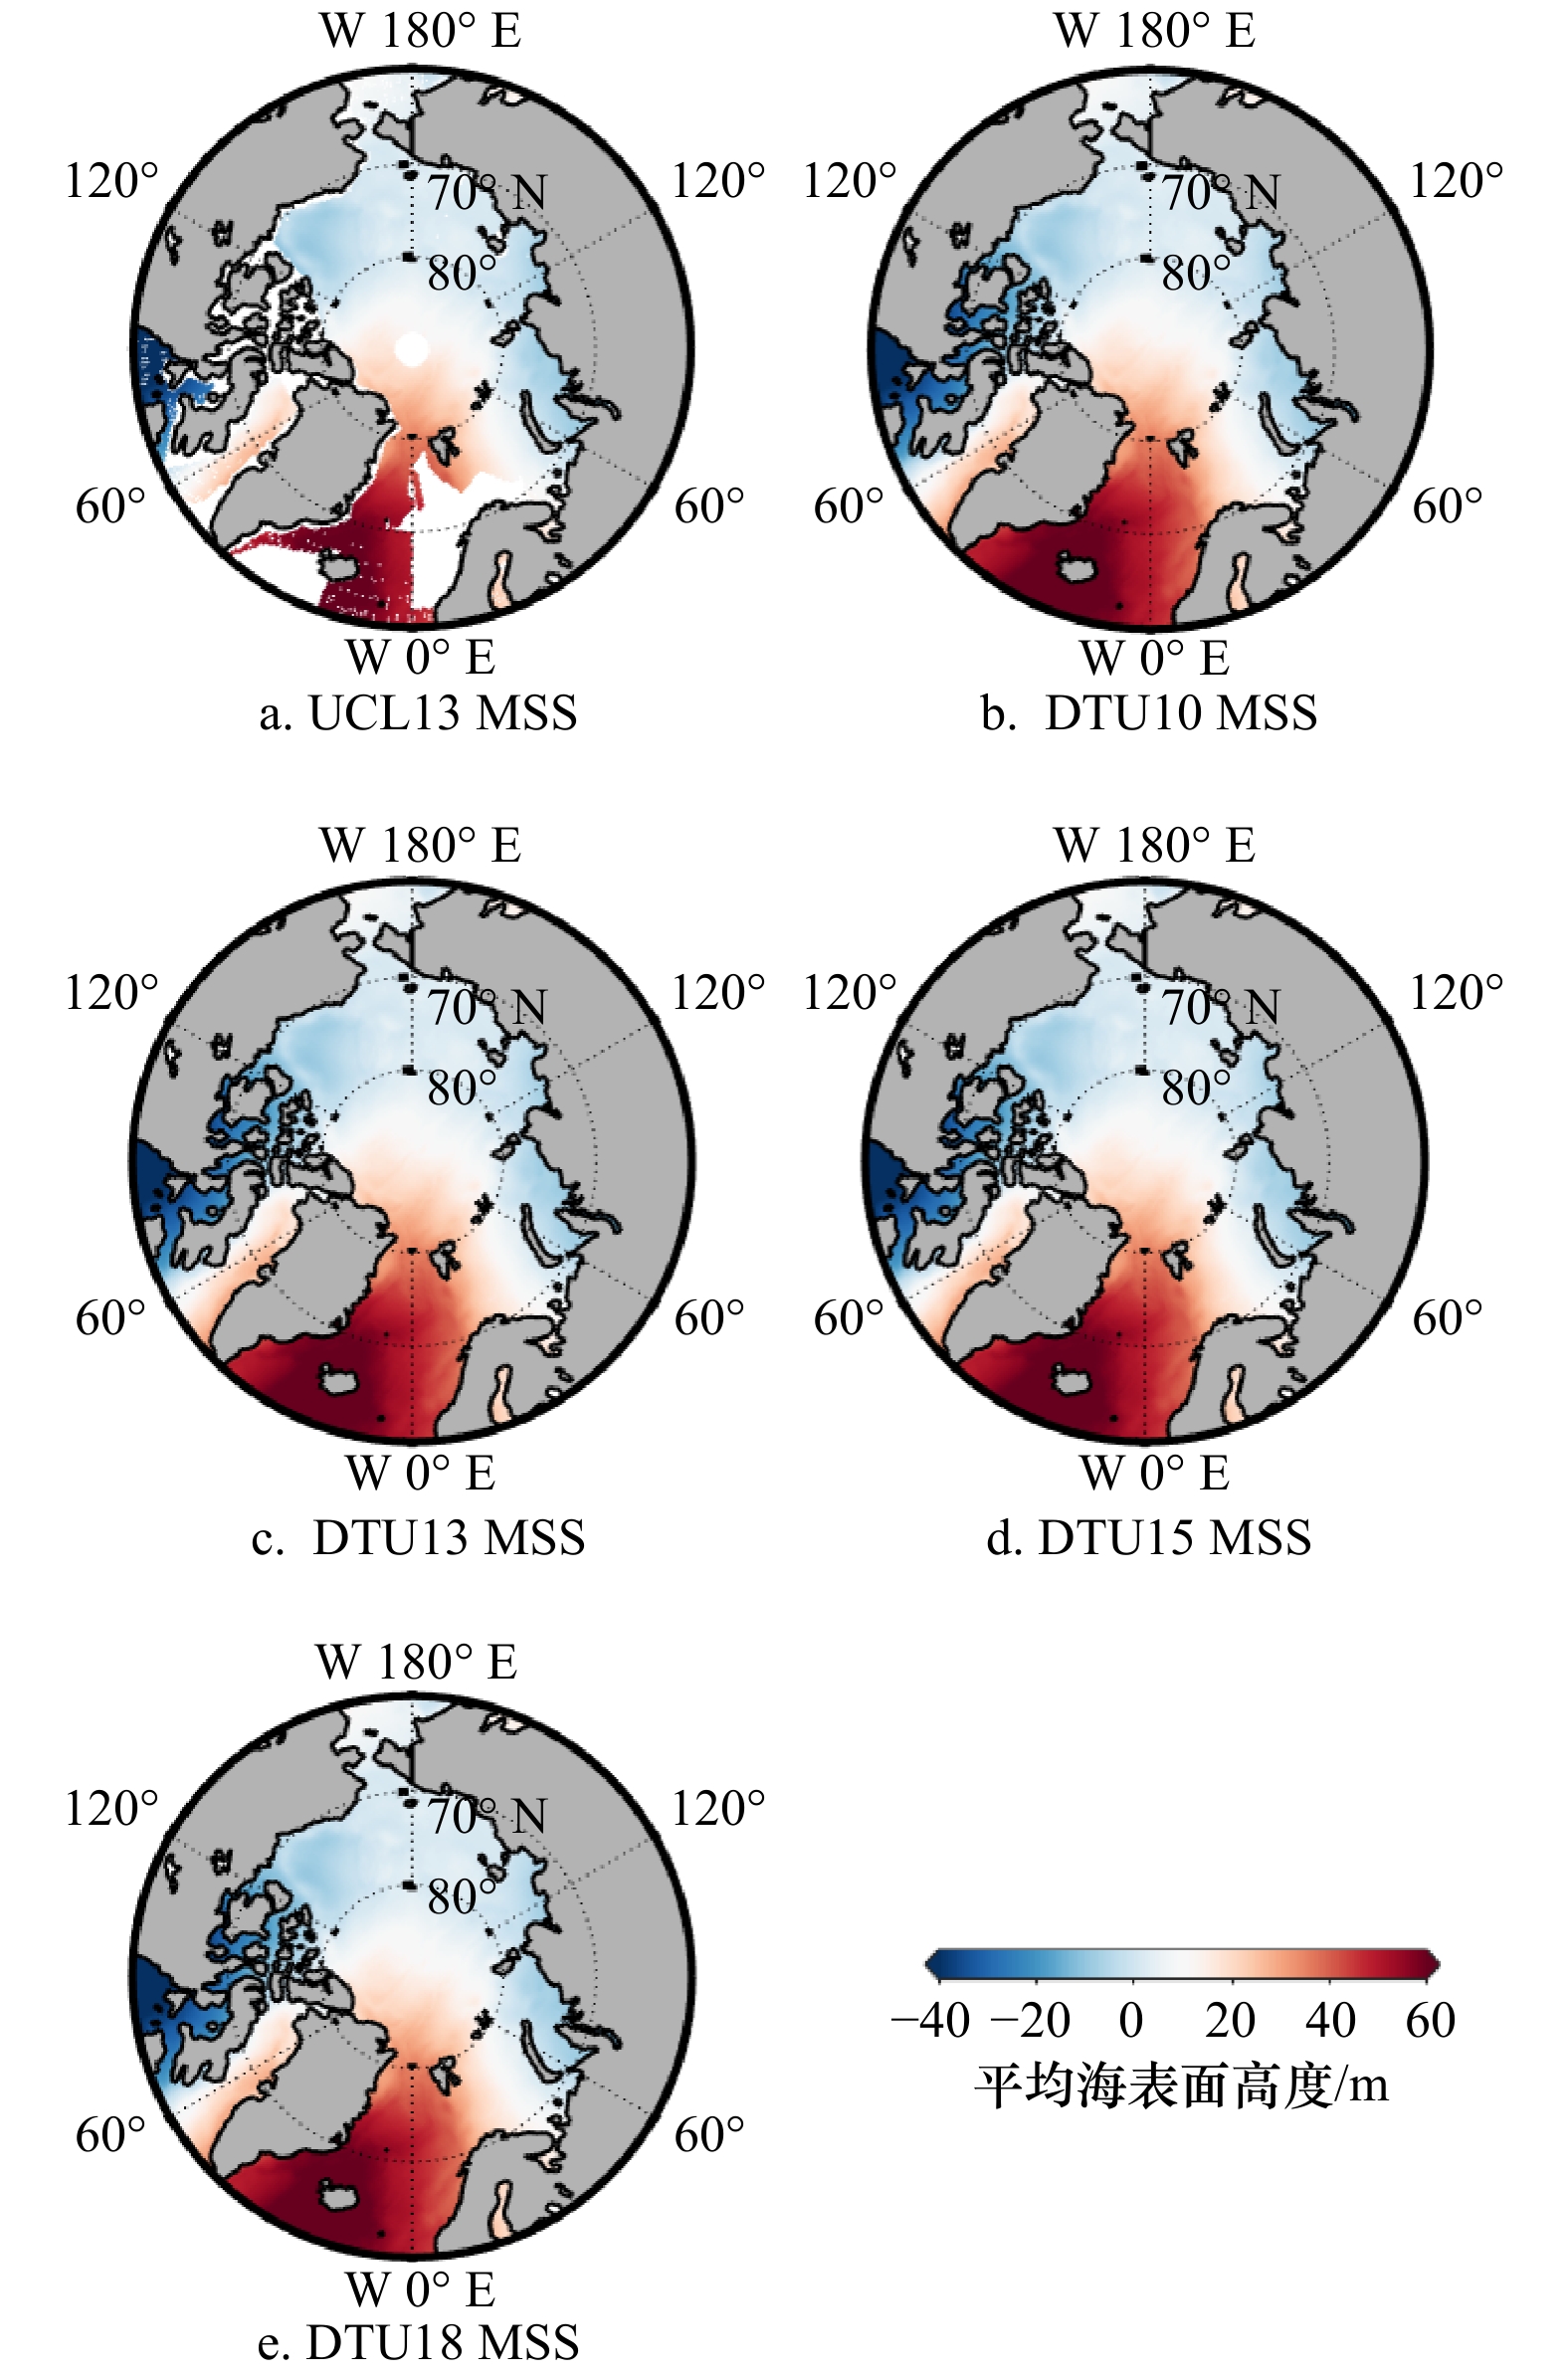
图 1 不同MSS模型模拟的空间分布
Fig. 1 Spatial distribution of different mean sea surface height models
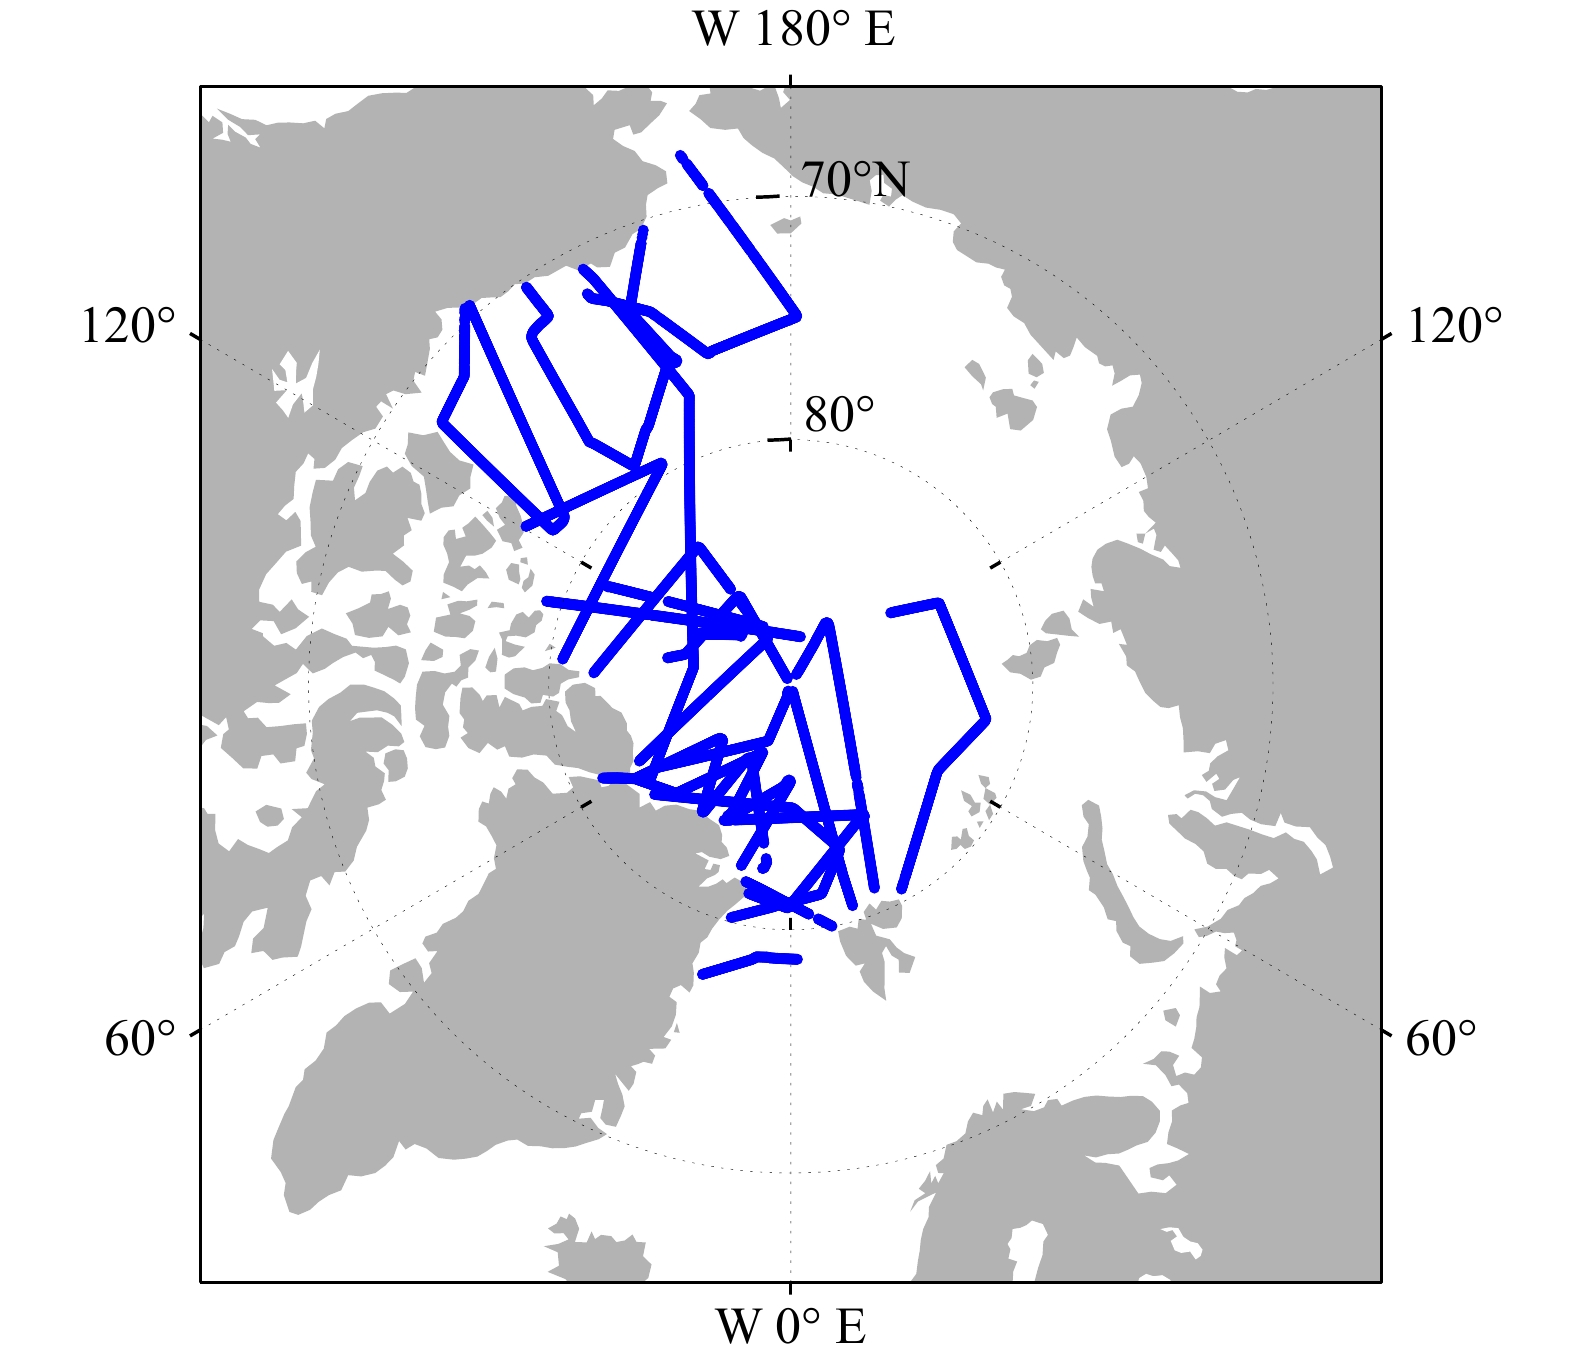
图 2 OIB于2017年4月、2018年4月和2019年4月的飞行路线
Fig. 2 Flight lines of OIB for April 2017, April 2018 and April 2019
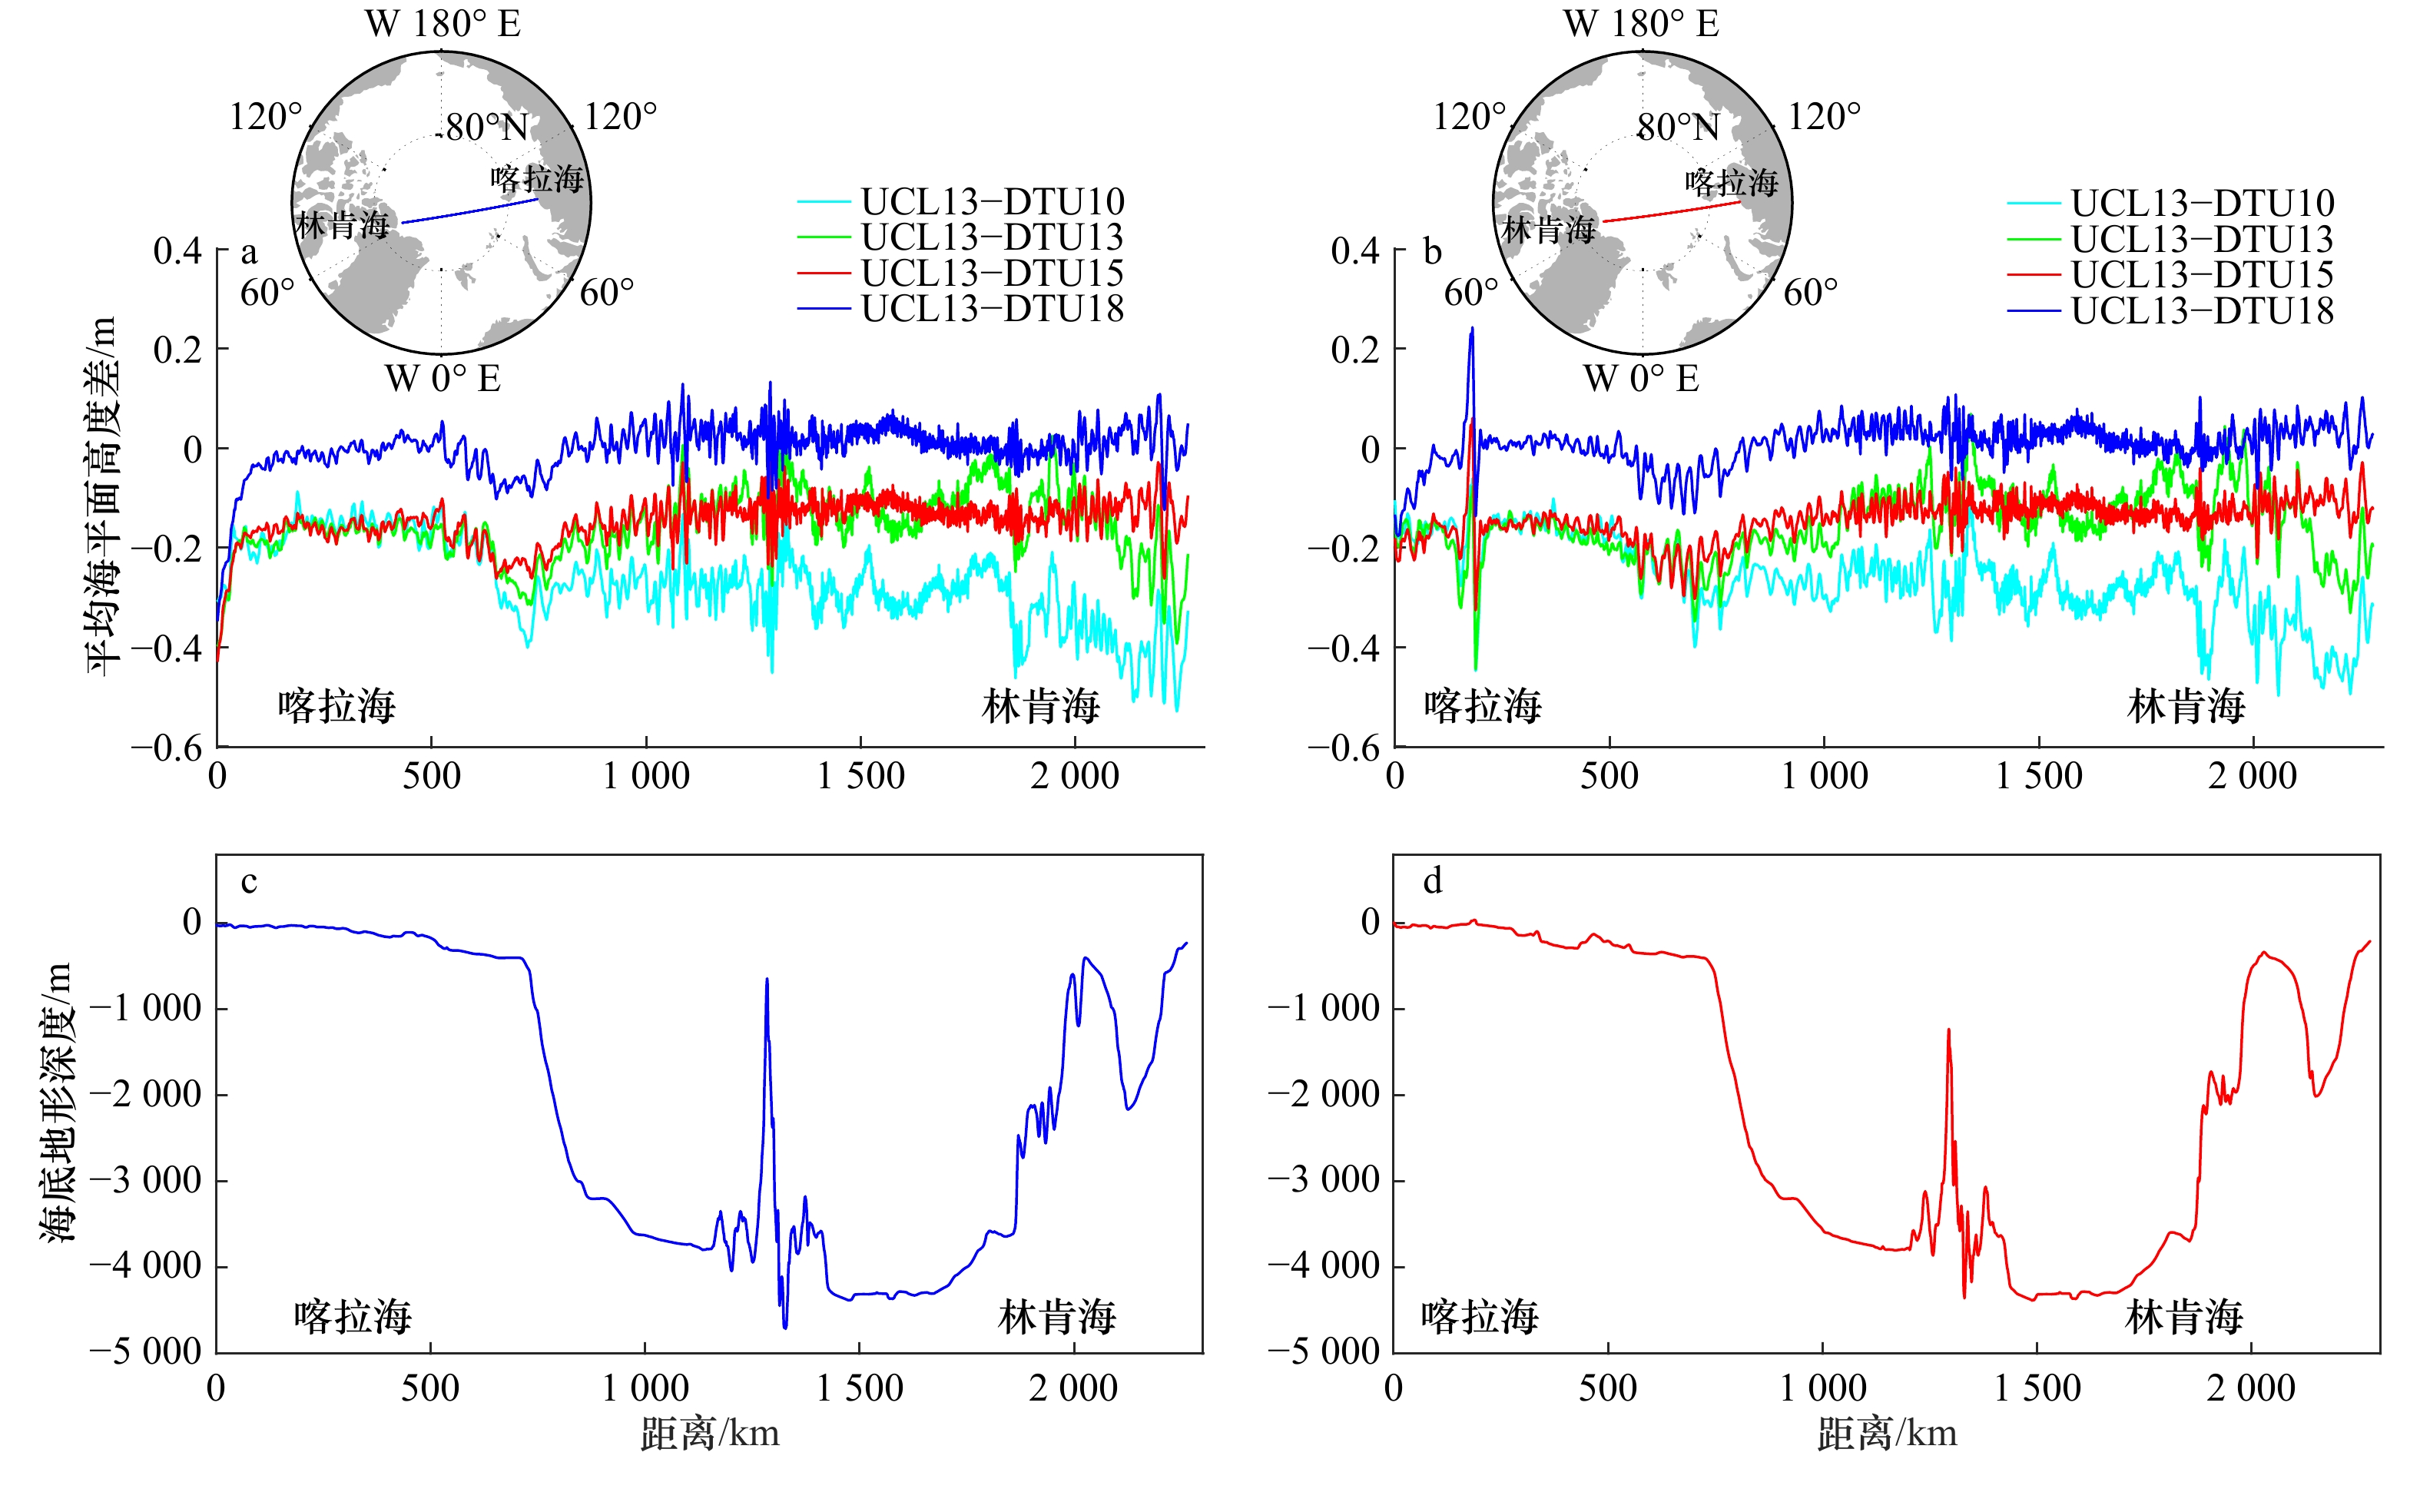
图 4 UCL13和DTU系列MSS模型的平均海平面高度沿轨差异(a,b)和沿轨水深(c,d)
a, c. 轨道号47928;b, d. 轨道号47986
Fig. 4 Track difference of mean sea surface height (a, b) between UCL13 and series of DTU MSS models as well as bathymetric chart (c, d)
a, c. Track number 47928; b, d. track number 47986
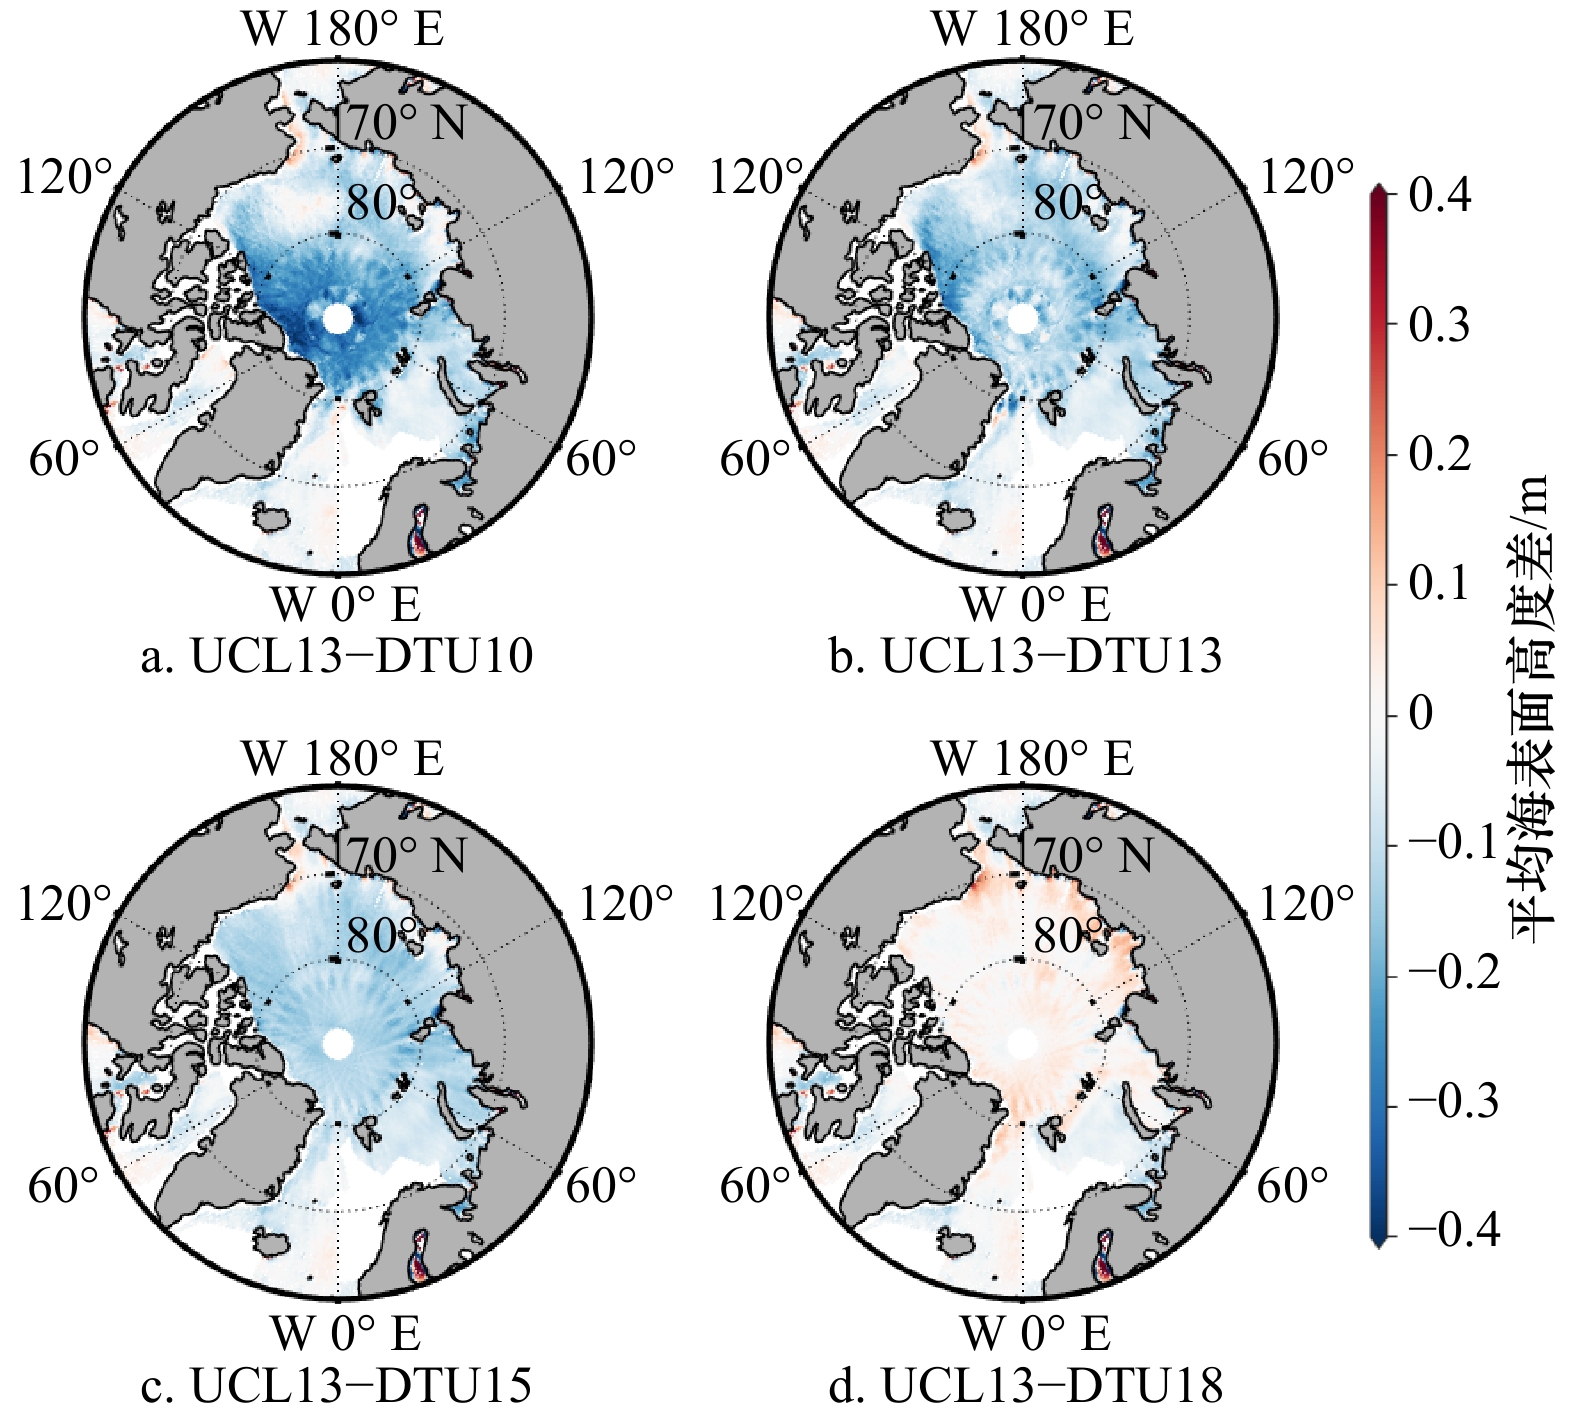
图 5 UCL13和DTU MSS系列模型的平均海平面高度网格差异
Fig. 5 Grid differences of mean sea surface height between UCL13 and series of DTU MSS models
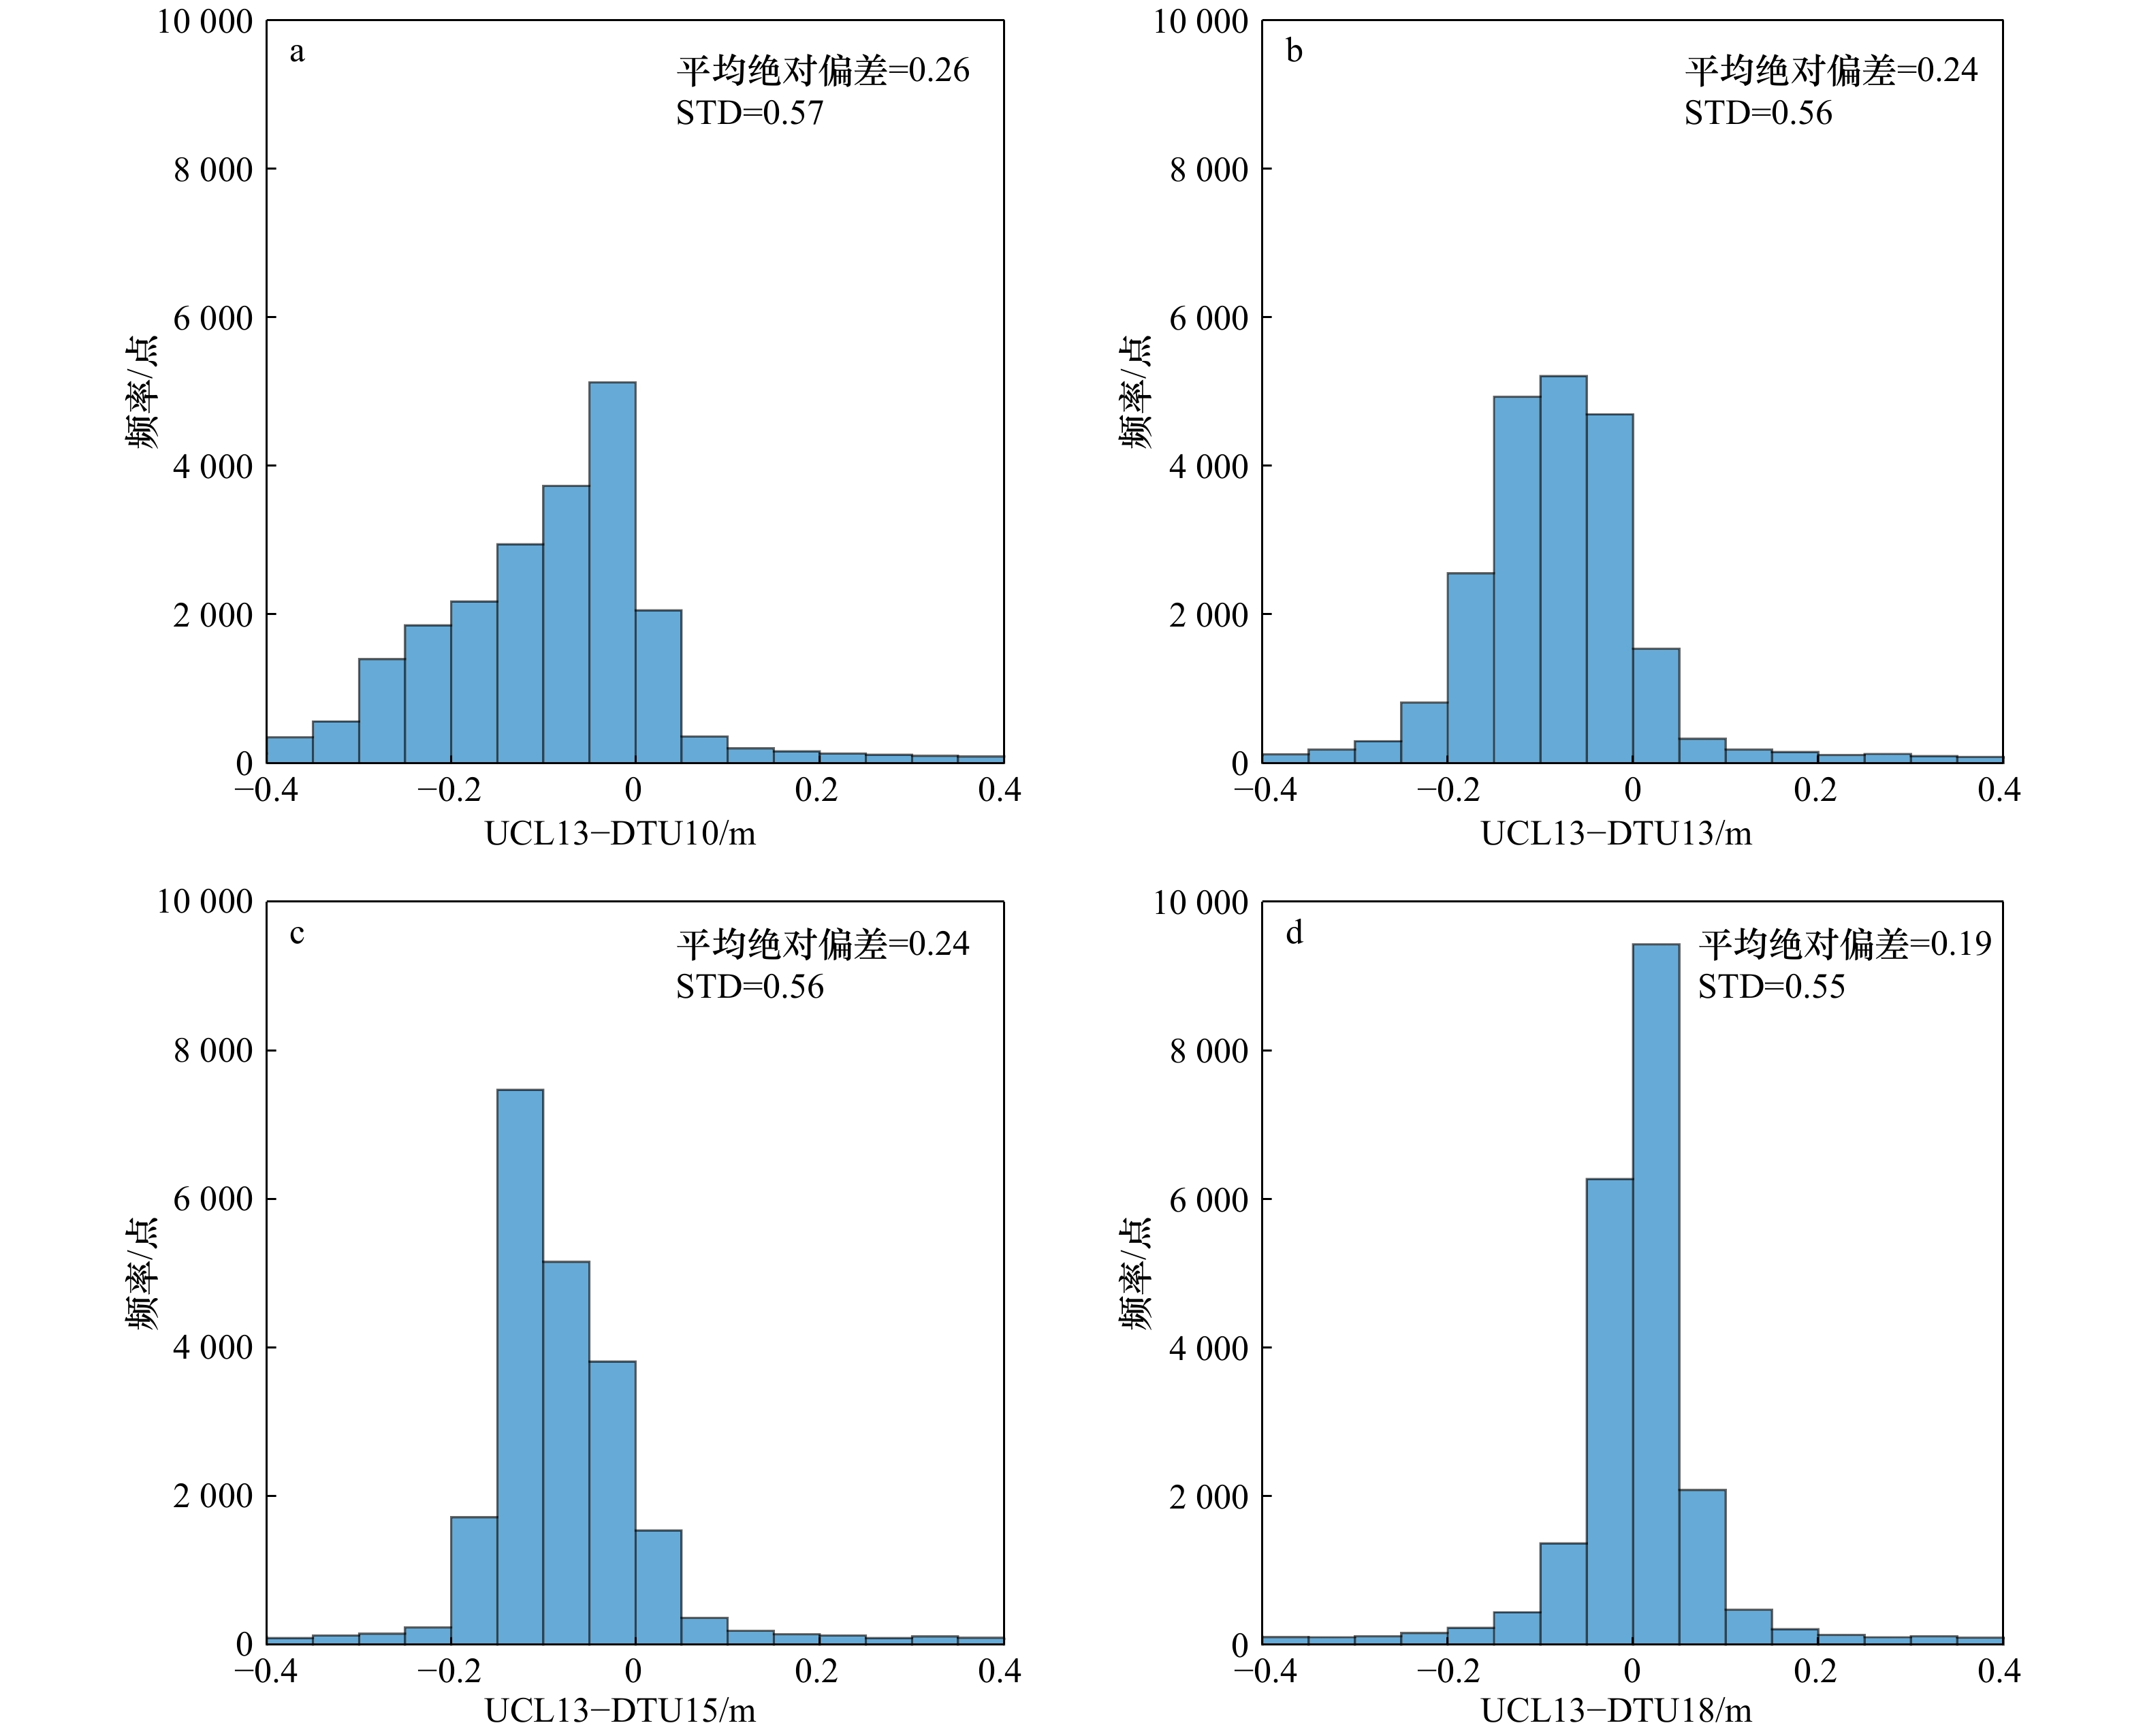
图 6 UCL13和DTU系列MSS模型的网格差异直方图
Fig. 6 Histogram of grid differences between UCL13 and series of DTU MSS models

图 7 5种MSS模型反演的北极海冰干舷空间分布
Fig. 7 Spatial distribution of Arctic sea ice freeboard retrieved by five MSS models

图 8 UCL13和DTU系列MSS模型的北极海冰干舷沿轨差异直方图(a,b)和箱线图(c,d)
a, c. 轨道号47928;b, d. 轨道号47986
Fig. 8 Track difference of Arctic sea ice freeboard (a, b) between UCL13 and series of DTU MSS models as well as boxplot (c, d)
a, c. track number 47928; b, d. track number 47986
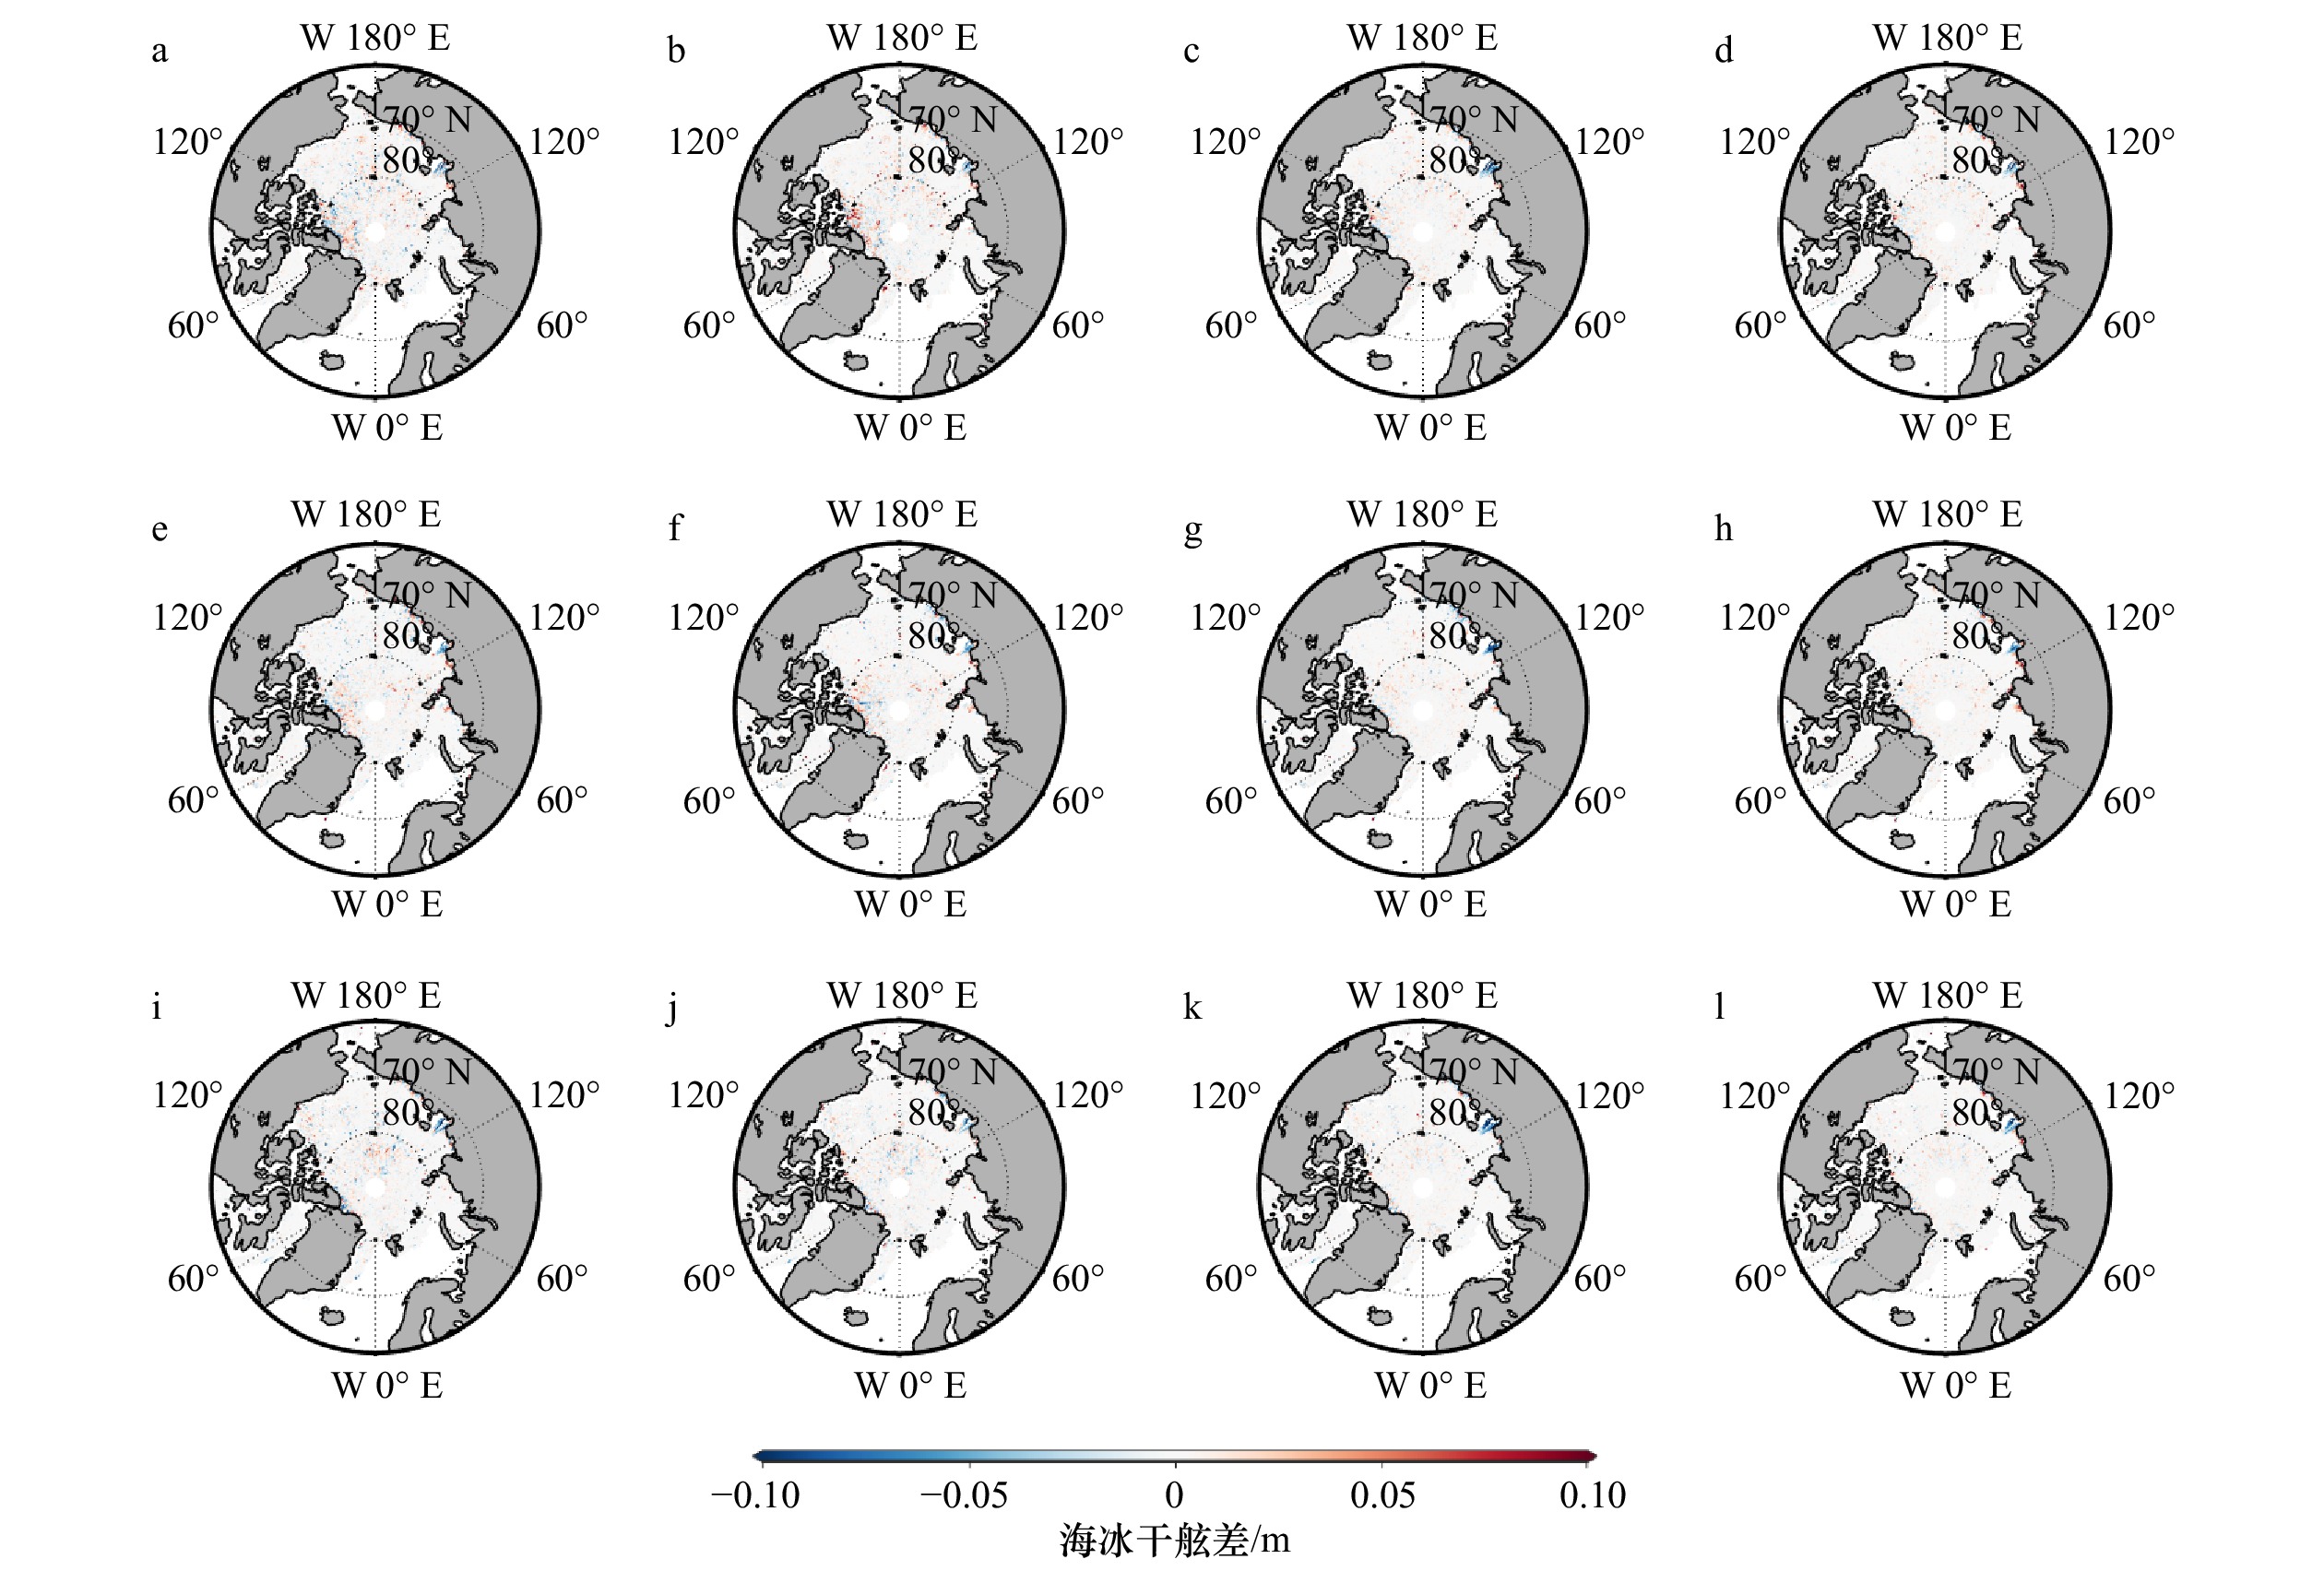
图 9 UCL13和DTU系列MSS模型的北极海冰干舷网格差异
a, e, i. UCL13-DTU10;b, f, j. UCL13-DTU13;c, g, k. UCL13-DTU15;d, h, l. UCL13-DTU18;a–d. 2019年4月;e–h. 2018年4月;i–l. 2017年4月
Fig. 9 Grid differences of Arctic sea ice freeboard between UCL13 and series of DTU MSS models
a, e, i. UCL13-DTU10; b, f, j. UCL13-DTU13; c, g, k. UCL13-DTU15; d, h, l. UCL13-DTU18. a–d. April 2019; e–h. April 2018; i–l. April 2017
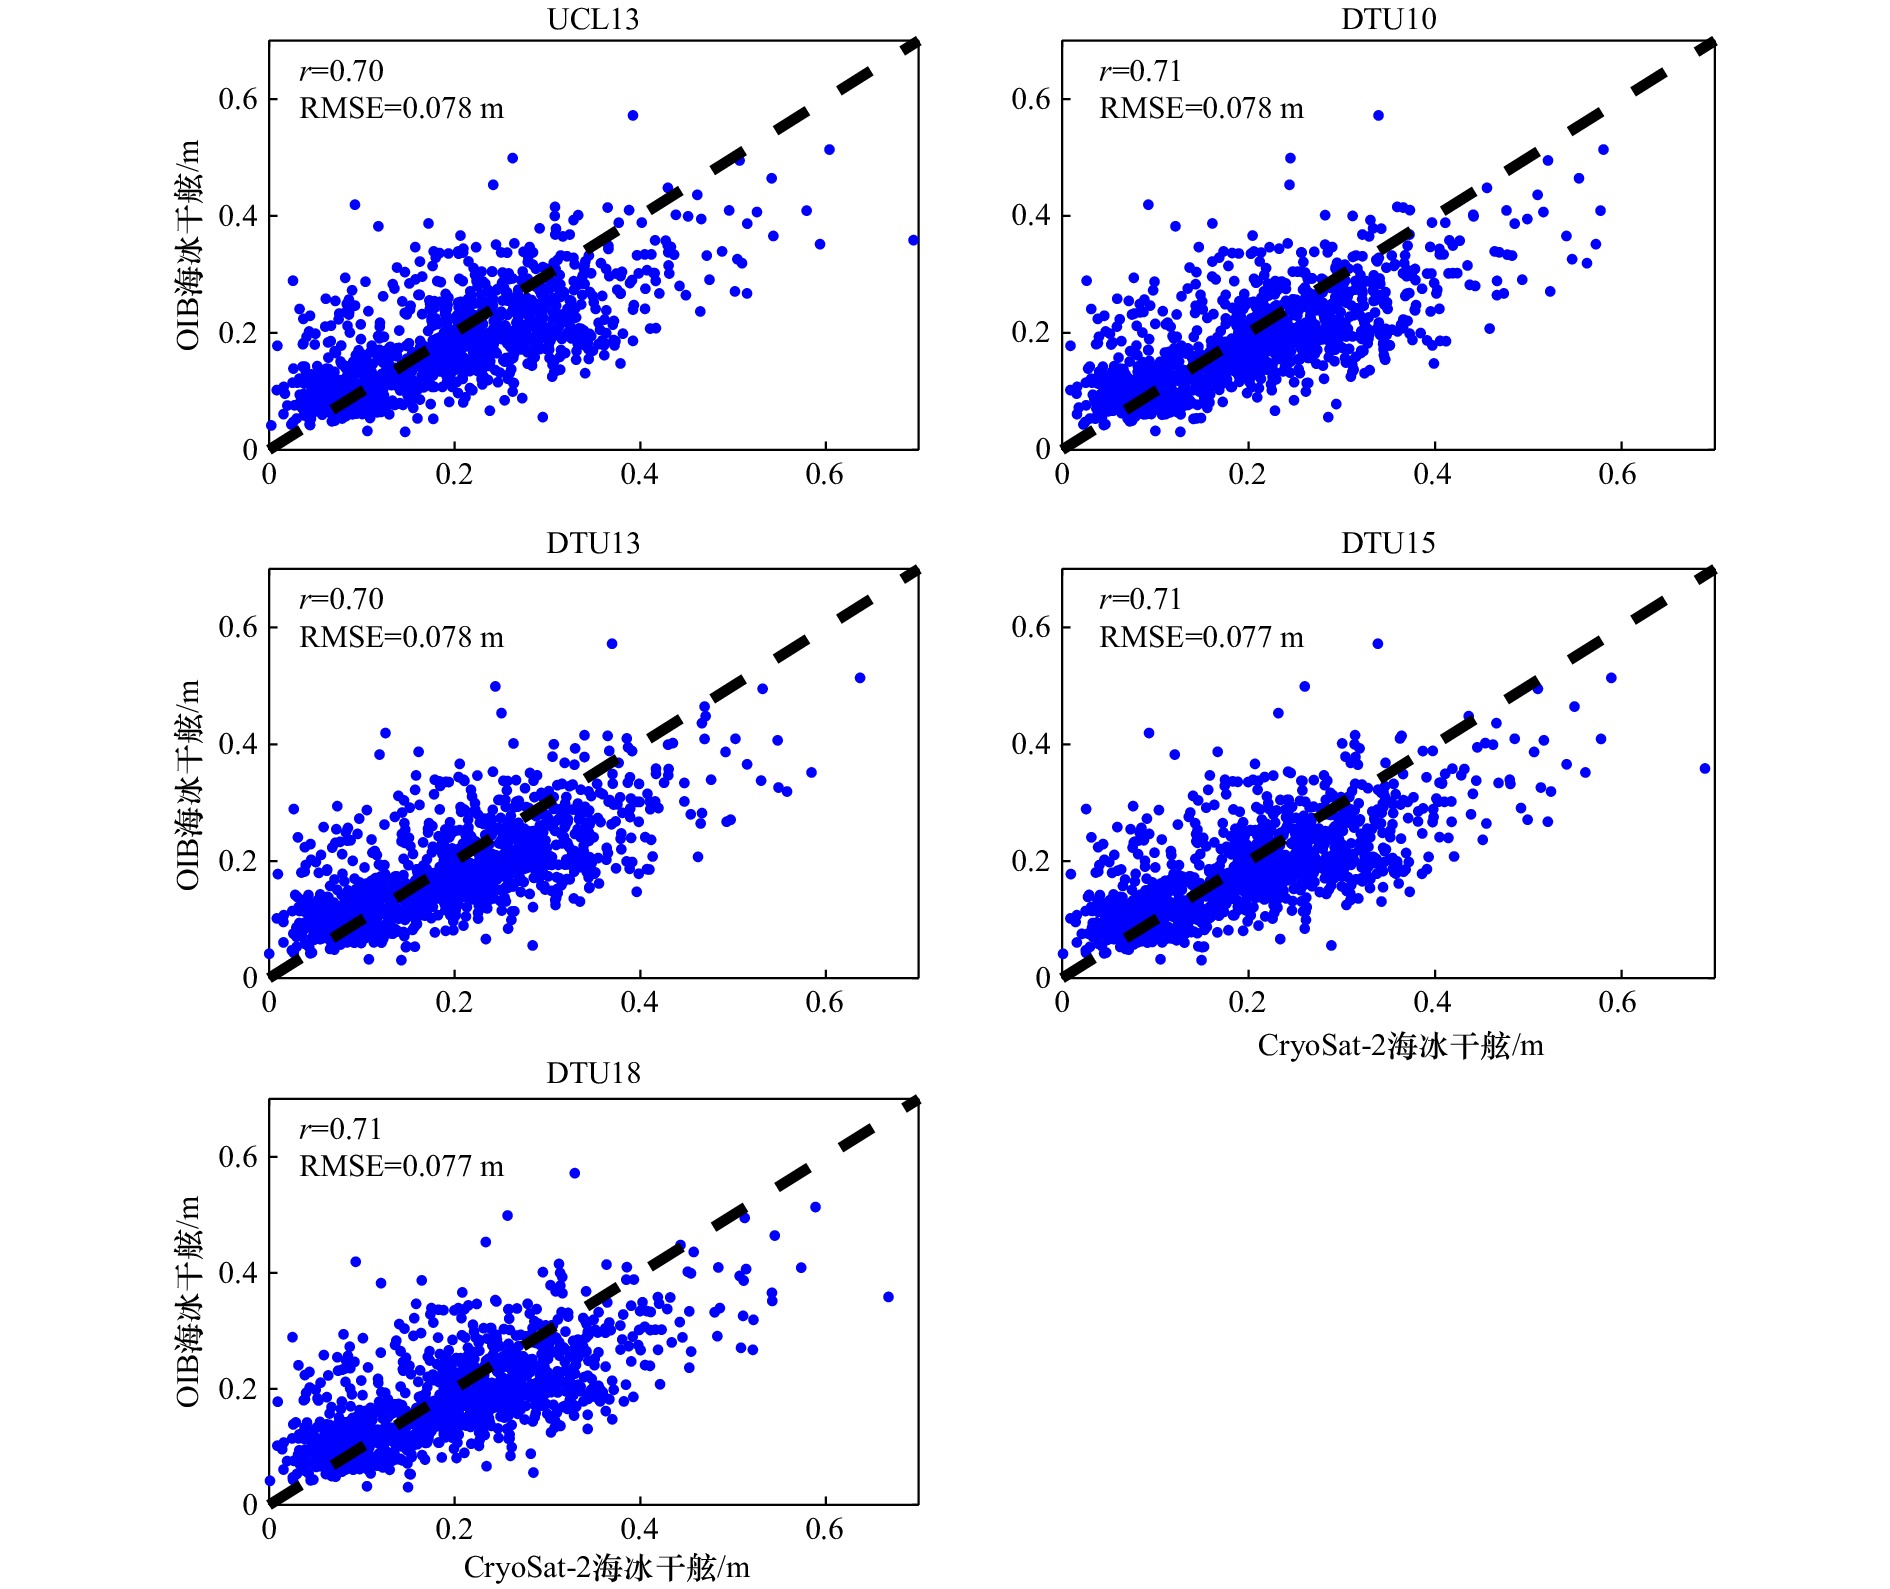
图 10 5种不同MSS模型反演的海冰干舷与实测OIB数据的验证
Fig. 10 Validation of sea ice freeboard retrieved from five different MSS models and measured OIB data
表 1 UCL13和DTU系列MSS模型的北极海冰干舷网格差异统计表
Tab. 1 Grid differences statistics of Arctic sea ice freeboard between UCL13 and series of DTU MSS models
对比网络 平均绝对偏差/标准差(单位:m) 2017年4月 2018年4月 2019年4月 UCL13−DTU10 0.006 9/0.017 4 0.007 0/0.014 9 0.007 9/0.016 8 UCL13−DTU13 0.006 4/0.017 3 0.006 3/0.014 0 0.007 2/0.015 8 UCL13−DTU15 0.005 4/0.015 8 0.005 2/0.012 7 0.005 7/0.013 7 UCL13−DTU18 0.005 2/0.014 5 0.005 0/0.011 7 0.005 5/0.012 8  下载: 导出CSV
-
[1] Thomas D N, Dieckmann G S. Sea Ice[M]. 2nd ed. Ames, Iowa: Wiley-Blackwell, 2010. [2] Xu Shiming, Zhou Lu, Liu Jiping, et al. Data synergy between altimetry and L-band passive microwave remote sensing for the retrieval of sea ice parameters—A theoretical study of methodology[J]. Remote Sensing, 2017, 9(10): 1079. doi: 10.3390/rs9101079 [3] Arneth A, Barbosa H, Benton T, et al. Summary for Policymakers[M]. Geneva: The Intergovernmental Panel on Climate Change, 2019. [4] Laxon S W, Giles K A, Ridout A L, et al. CryoSat-2 estimates of Arctic sea ice thickness and volume[J]. Geophysical Research Letters, 2013, 40(4): 732−737. doi: 10.1002/grl.50193 [5] 季青. 基于卫星测高技术的北极海冰厚度时空变化研究[D]. 武汉: 武汉大学, 2015.Ji Qing. Study on spatial-temporal change of Arctic sea ice thickness based on satellite altimetry[D]. Wuhan: Wuhan University, 2015. [6] 沈校熠. 基于CryoSat-2的海冰厚度反演方法研究[D]. 南京: 南京大学, 2018.Shen Xiaoyi. Research on CryoSat-2 sea ice thickness retrieval method[D]. Nanjing: Nanjing University, 2018. [7] Paul S, Hendricks S, Ricker R, et al. Empirical parametrization of Envisat freeboard retrieval of Arctic and Antarctic sea ice based on CryoSat-2: Progress in the ESA climate change initiative[J]. The Cryosphere, 2018, 12(7): 2437−2460. doi: 10.5194/tc-12-2437-2018 [8] European Space Agency. CryoSat-2 product handbook[EB/OL]. (2020−11−23)[2020−12−01]. http://science-pds.cryosat.esa.int/. [9] Skourup H, Farrell S L, Hendricks S, et al. An assessment of state-of-the-art mean sea surface and geoid models of the Arctic Ocean: Implications for sea ice freeboard retrieval[J]. Journal of Geophysical Research: Oceans, 2017, 122(11): 8593−8613. doi: 10.1002/2017jc013176 [10] Ridout A. New mean sea surface for the CryoSat-2 L2 SAR chain[R]. Tech Note C2-TN-UCL-BC-0003 Issue 1.0. London, UK: CPOM, University College London. [11] Andersen O B. The DTU10 global gravity field and mean sea surface–improvements in the Arctic[C]//Second International Symposium of the Gravity Field of the Earth (IGFS2). Fairbanks, Alaska, 2010. [12] Andersen O, Knudsen P, Stenseng L. The DTU13 MSS (Mean Sea Surface) and MDT (Mean Dynamic Topography) from 20 years of satellite altimetry[M]//Jin Shuanggen, Barzaghi R. IGFS 2014. Cham: Springer, 2015: 111–121. [13] Andersen O B, Stenseng L, Piccioni G, et al. The DTU15 MSS (Mean Sea Surface) and DTU15LAT (Lowest Astronomical Tide) reference surface[C]//Abstract from ESA Living Planet Symposium 2016. Prague: Czech Republic, 2016. [14] Andersen O, Knudsen P, Stenseng L. A New DTU18 MSS mean sea surface–improvement from SAR altimetry[C]//25 Years of Progress in Radar Altimetry Symposium. Portugal, 2018. [15] 张晰, 赵全芳, 孟俊敏, 等. 适用于Ku波段雷达高度计海冰干舷高度反演的积雪校正方法[J]. 海洋技术学报, 2020, 39(2): 1−9.Zhang Xi, Zhao Quanfang, Meng Junmin, et al. Snow correction method for sea ice freeboard retrieval applied to Ku Band radar altimeters[J]. Journal of Ocean Technology, 2020, 39(2): 1−9. [16] Li Mengmeng, Ke Changqing, Xie Hongjie, et al. Arctic sea ice thickness retrievals from CryoSat-2: Seasonal and interannual comparisons of three different products[J]. International Journal of Remote Sensing, 2020, 41(1): 152−170. doi: 10.1080/01431161.2019.1637961 [17] Becker J J, Sandwell D T, Smith W H F, et al. Global bathymetry and elevation data at 30 arc seconds resolution: SRTM30_PLUS[J]. Marine Geodesy, 2009, 32(4): 355−371. doi: 10.1080/01490410903297766 [18] Ricker R, Hendricks S, Helm V, et al. Sensitivity of CryoSat-2 arctic sea-ice freeboard and thickness on radar-waveform interpretation[J]. The Cryosphere, 2014, 8(4): 1607−1622. doi: 10.5194/tc-8-1607-2014 [19] Shen Xiaoyi, Similä M, Dierking W, et al. A new retracking algorithm for retrieving sea ice freeboard from CryoSat-2 radar altimeter data during winter–spring transition[J]. Remote Sensing, 2019, 11(10): 1194. doi: 10.3390/rs11101194 [20] Armitage T W K, Ridout A L. Arctic sea ice freeboard from AltiKa and comparison with CryoSat-2 and Operation IceBridge[J]. Geophysical Research Letters, 2015, 42(16): 6724−6731. doi: 10.1002/2015gl064823 [21] Tilling R L, Ridout A, Shepherd A. Estimating Arctic sea ice thickness and volume using CryoSat-2 radar altimeter data[J]. Advances in Space Research, 2018, 62(6): 1203−1225. doi: 10.1016/j.asr.2017.10.051 -


计量
- 文章访问数: 506
- HTML全文浏览量: 176
- PDF下载量: 42
- 被引次数: 0
